Extending the limits of globule detection††thanks: Based on observations with ISO, an ESA project with instruments funded by ESA Member States (especially the PI countries: France, Germany, the Netherlands and the United Kingdom) and with the participation of ISAS and NASA.
A faint MJysr-1 bipolar globule was discovered with the ISOPHOT 170 m Serendipity Survey (ISOSS). ISOSS J 20246+6541 is a cold ( K) FIR source without an IRAS pointsource counterpart. In the Digitized Sky Survey B band it is seen as a 3′size bipolar nebulosity with an average excess surface brightness of mag/″. The CO column density distribution determined by multi-isotopic, multi-level CO measurements with the IRAM-30m telescope agrees well with the optical appearance. An average hydrogen column density of cm-2 was derived from both the FIR and CO data. Using a kinematic distance estimate of 400 pc the NLTE modelling of the CO, HCO+, and CS measurements gives a peak density of cm-3. The multiwavelength data characterise ISOSS 20246+6541 as a representative of a class of globules which has not been discovered so far due to their small angular size and low 100m brightness. A significant overabundance of 13CO is found COC18O. This is likely due to isotope selective chemical processes.
Key Words.:
ISM: clouds – dust, extinction – ISM: molecules – Infrared: ISM: continuum – Surveys1 Introduction
Bok globules were originally detected in absorption against HII regions by Bok and Reilly (1947), and are known as small, dense interstellar clouds in the solar neighbourhod (pc). They were identified optically, and mostly the nearby ones have been catalogued so far. It is expected that they are similarily common elsewhere in the Galactic disk and in fact a few distant ones are already investigated eg. by Launhardt & Henning (1997). Their FIR properties were determined by Clemens & Barvainis (1988) based on IRAS data. They emphasized the importance of finding FIR faint cold globules since these are representatives of the inactive (i.e. non-starforming) interstellar medium. Starless globules with small apparent size and low temperature (thus also very low 100 m brightness) can be seen only by good sensitivity at wavelengths over 100 m. An ISOPHOT study of pre-stellar cores in dark clouds with low 100 m brightness were recently reported by Ward-Thompson et al. (2002). The ISOPHOT 170 m Serendipity Survey (ISOSS) can be used to locate cold galactic objects even without any preliminary identification. This raises the possibility of detection of the ”missing” globules via ISOSS. We present our results on ISOSS J 20246+6541 proving that it is, indeed, a small and cold isolated molecular cloud - one of the so far missed population.
2 Observation and data analysis
We searched ISOSS at medium galactic latitudes for 170 m point sources without IRAS counterparts. The ISOSS measurements, calibration, and data analysis for interstellar clouds are described by Bogun et al. (1996), Stickel et al. (2000) and Tóth et al. (2000) respectively. ISOSS J 20246+6541 was detected as an MJysr-1 () pointlike (FWHM ′) source at RA(2000)=20h24m36s Dec(2000)=+6540 (l=99.80, b=15.70). It is without an IRAS point source counterpart.
The optical appearance of CISS1 and its neighourhood was studied using 40′ 40′ Digital Sky Survey (DSS) blue and red images. Photometry on DSS plates of all USNO (Monet et al. 1998) sources have been done where R and B 18mag. Integrated photographic density was derived for all these USNO sources. Photographic density values DN of the background were measured at each plate at 25 positions where neither star, nor significant background emission enhancement was seen. The background value is and in photographic density units for R and B bands respectively. Photometric calibration of the plates was made following Cutri’s (1993) method. The photographic density to magnitude calibration formulae were derived as vs. magnitude relations. The scatter is large for faint stars, and the extrapolation to low photographical density (i.e. high magnitude) values results in a large error bar. In order to make surface brightness maps of ISOSS J 20246+6541, stars were removed from the optical images by substituting the average surrounding DN value.
The (1–0) and (2–1) rotational lines of CO, 13CO and C18O were measured in Aug. 1998 with the IRAM-30 telescope. A region centered on ISOSS 20246+6541 was mappen in on-the-fly mode in 12CO(1–0), 12CO(2–1) and 13CO(1–0) with angular resolutions of 20″, 10″, 20″ respectively. Pointed measurements were performed in all the above mentioned transitions at the 13CO(1–0) peak position (22h24m46s, 65°40′01″). Spectral resolutions of 0.1, 0.05 and 0.03kms-1 were used. These spectra are shown in Fig. 1.
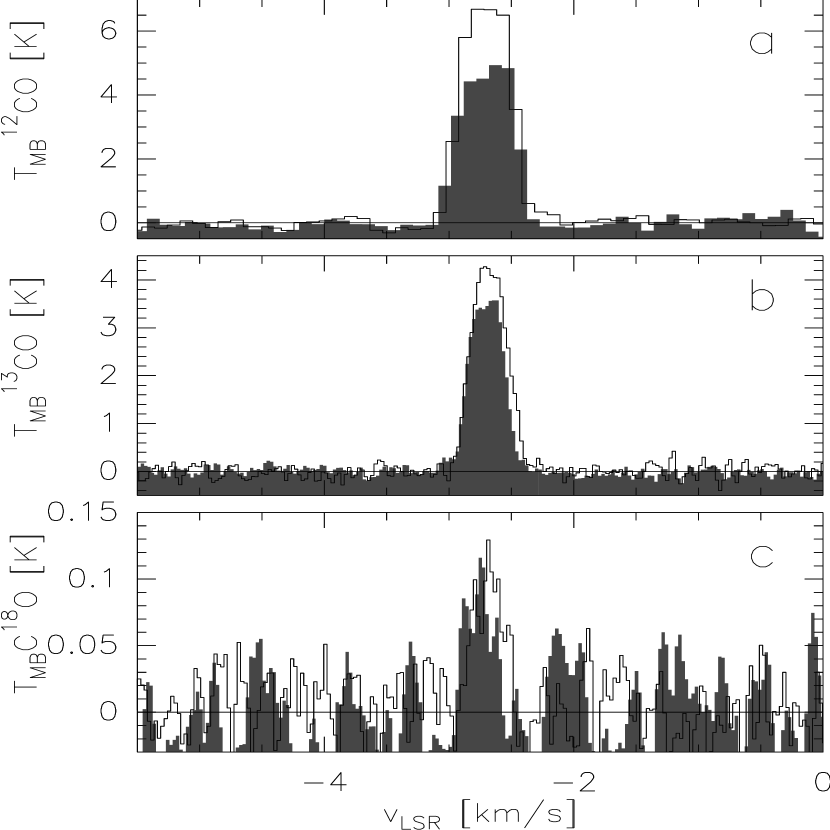
The lines are narrow with a FWHM of kms-1. The result of the 1998 C18O pointed measurements were confirmed in Sept. 2000 when also the CS(2–1) and (3–2) as well as the HCO+(1–0) and (2–1) transitions were observed with the IRAM-30 telescope. The C18O, CS(2–1) and HCO+(1–0) lines were detected with and well resolved with the 0.03kms-1 spectral channels. The data were calibrated to the scale of corrected antenna temperature, , by observing loads at ambient and cold temperature, as in the conventional “chopper-wheel” calibration for millimetre wavelength observations. The data were converted to the main-beam scale by applying the relation . The values for the main-beam efficiency, , are 0.70 and 0.42 (July 1998), and 0.75 and 0.53 (September 2000), and the values for the forward efficiency, , are 0.92 and 0.85 for CO(1–0) and CO(2–1), respectively. We checked the calibration by observing the standard sources DR 21 and W3OH and found it always to be better than 20 %.
3 Results
3.1 FIR results and derived parameters
ISOSS J 20246+6541 is a faint FIR source with an upper limit on the brightness of about 0.5 MJysr-1 derived from the “raw” (IRDS format) IRAS data. Comparison of ISOSS and ISSA data (Wheelock et al. 1994) was made as described by Tóth et al. (2000). An upper limit of the colour temperature of 14.5 K was estimated from the bisector slope of the vs. scatter plot. Assuming a dust temperature of 14.5 K, an average dust column density of gcm-2 was derived following Hildebrand (1983). This corresponds to an average hydrogen column density of HI+2Hcm-2 where a hydrogen-to-dust mass ratio of 110 (Launhardt & Henning 1997) was assumed.
3.2 Optical images
ISOSS J 20246+6541 appears as a faint, isolated reflection cloud west of the L1155/L1157 cloud complex. When smoothed to 15″ the excess diffuse surface brightness distribution of ISOSS 20246+6541 shows a “bright” lobe at the NE and a fainter fragmented one at SE. The POSS B band diffuse surface brightness is shown in Fig. 2 a, where the contours are drawn from 22.7 mag/ by mag/ . The lowest contour corresponds to three times the standard deviation of photographical density outside the globule on the star-removed, smoothed image.
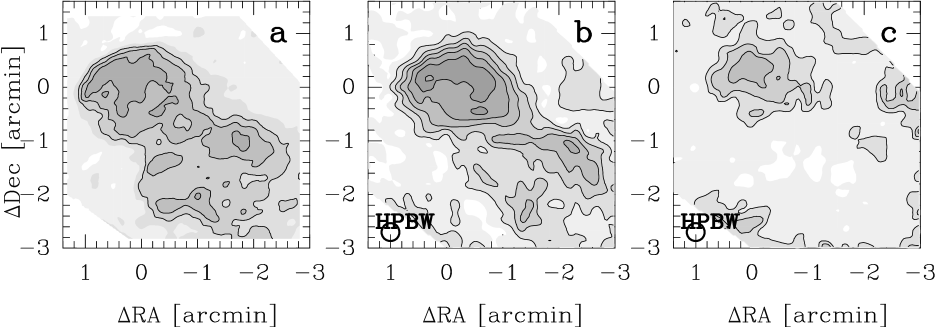
a: B band diffuse surface brightness, contours are from 22.7 mag (i.e. background level + converted to magnitudes) mag
The diffuse surface brightness contours indicate a sharp cloud edge at NE. The structures at offset coordinates (-0.5, -1.8) are less reliable due to residuals of a removed 11.9 mag star GSC 04245-00803. b: CO (1–0)), contours are from 1.5 Kkms-1 with 1.5 Kkms-1 steps; c:13CO (1–0), contours are from 1.0 Kkms-1 with 1.0 Kkms-1 steps; CO isotopomer line intensities are integrated in the velocity interval -5 kms-1 vLSR 0 kms-1.
The average background surface brightness is 22.8/. Linear interpolation of the Leinert et al. (1998) table of the B band sky brightness distribution gives at the the cloud position 102 , which agrees well with our result. The average excess surface brightness of ISOSS J 20246+6541 is mag/″in the DSS B band. The same morphology is shown by the B and R surface brightness distributions, except that the SE lobe is slightly more red than the NW lobe. The lack of a dark core indicates an average visual extinction below mag.
3.3 Molecular line results, and derived parameters
All observed lines show a LSR velocity of -2.7kms-1. The FWHM widths of the 12CO lines are around 0.4kms-1, and around 0.3kms-1 for all the other detected lines. The 12CO and 13CO integrated intensity distributions are shown in Figs. 2 b and c. The bipolar shape is well seen and the CO line intensities are in accordance with the excess surface brightness distribution, the NE lobe being much brighter. The two lobes show the same radial velocity.
The physical parameters were at first approximated
from the and spectra of the
peak intensity positions,
assuming an isothermal spherical cloud in LTE which uniformly fills the beam.
The LTE CO(1-0) excitation temperature is CO K,
characteristic of non-starforming molecular clouds.
We derived an optical depth of from the observed
CO(1-0) and 13CO(1-0) line ratio assuming the terrestrial
isotopic density ratio of 89.
The CO column density was calculated using the standard LTE formula:
,
resulting in
cm-2,
which corresponds to
cm-2 assuming
.
This result is in agreement with the column density derived
from the FIR data.
The 12CO and 13CO lines trace the ISM well over
most of the cloud.
A comparison of C18O to 13CO lines (both 1-0 and 2-1)
at the centre of the NE lobe indicates an underabundance of
C18O by a factor of 4. This effect is expected in cold clouds
with moderate density,
exposed to UV radiation (Glassgold et al. 1985). A more careful modelling
may account for it as we show in the Discussion session.
4 Discussion
4.1 Distance of ISOSS J 20246+6541
The distance of ISOSS 20246+6541 can be estimated, relating it to its neighbours. Its nearest neighbours are L1122 and (Lynds 1998), and the YDM97~CO1 (Yonekura 1997). The 13CO survey of Cepheus by Yonekura (1997) covers the position of ISOSS J 20246+6541 and their Fig. 6 a indicates few small clouds around ISOSS J 20246+6541 (i.e. YDM97~CO1, YDM97~CO2, YDM97~CO3) and one even smaller unnumbered peak very close to ISOSS J 20246+6541 at l b. All the listed Yonekura clouds have kms-1, and they are counted into the “close group” of clouds, which on the other hand is associated with extended FIR features around ISOSS J 20246+6541. The nearest molecular clouds with negative are YDM97~CO7, CO9, CO10 at 0 7. ISOSS 20246+6541 itself has kms-1. It probably belongs to the ISM layer of the nearby Cepheus Flare GMC, and is located at about 400pc (Kun 1998). We note that applying the size-linewidth relation of Larson (1981) the globule may be between 100 and 400pc.
4.2 Radiative transfer models
We have modelled the NE lobe of the bipolar globule with spherically symmetric cloud models, although the NE clump shows some deviations from spherical symmetry in both 12CO and 13CO (see Fig. 2 b and c. With RA=20h24m44s Dec=+654004 as the centre position, we have averaged spectra in concentric rings with radii increasing by 10 intervals up to a radii of 90. The effective resolution of the averaged spectra is 40 for the 1–0 lines and 20 for the 2–1 lines.
We set the cloud parameters as follows.
(1) We assume a density distribution with a density ratio
100 between the centre and the cloud surface.
(2) The kinetic temperature is assumed to rise linearly from the cloud
centre. This is a crude
approximation of the actual temperature structure of for a
small, spherically symmetric globule without internal heating sources
(e.g. Leung 1985; Nelson & Langer 1999)
but will suffice for the present purposes.
The temperature gradient, i.e. the difference between the
outermost and innermost shells
K, 6 K or 10K. Higher contrast
means too high a temperature for the outer cloud, in contradiction with
the observed small linewidth.
(3) Extinction-dependent relative molecular abundances
were
estimated according to Warin et al. (1996).
The cloud is cold, exposed to UV radiation and it has a peak
visual extinction between 1 and 2 mag.
In these conditions isotope selective processes
result in a relative overabundance of 13CO and relative
underabundance of C18O according to Bally and Langer (1982).
When applying the Warin et al. (1996) relative abundances, we
introduced an intrinsic extinction at the cloud boundary since the
12CO lines are not vanishing at the boundary of the NE lobe.
This assumption is supported by the presence of surrounding
extended cirrus-like emission seen in 100 m on the ISSA image.
(4). Distance: 100, 200, 400, 600, 800, 1000, and 2000pc
were tested.
When the density, temperature, relative abundance distributions and the distance is set to a value allowed by the above constrains, the free model parameters are the central density (), the intrinsic linewidth () and the angular diameter () of the model cloud. The radiative transfer problem is solved with Monte Carlo simulation (Juvela 1997). The computed spectra are convolved to the resolution of the observed spectra and the quality of the fit between the two is estimated with a weighted value. The model cloud is divided into 31 shells of equal thickness and the free parameters are optimized separately for 12CO and 13CO. We then select the set of parameters which provides the best fits for both. Since the 12CO observations only probe the outer layers of the cloud, the 12CO based estimate of the column density is uncertain. Modelling based on the 13CO line, however, gives surprisingly similar results when the appropriate average relative abundance value CO is selected. The models are not sensitive to 20% changes in the average molecular abundances or density, although similar changes of the kinetic temperature or size are, critical (see Fig. 3).
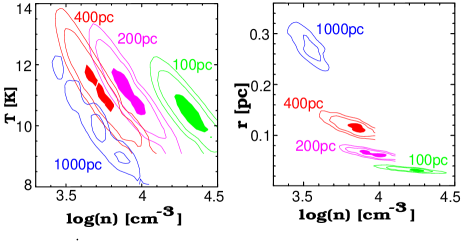
Synthetic spectra for C18O CS and HCO+ were generated with the NLTE model using the best parameter sets (lowest ) from the 12CO 13CO analysis. The relative abundances were varied up to 100% and the other parameters up to 30%. The C18O lines were best reproduced assuming an average relative abundance of , an extreme but possible underabundance by factor of 28 (Glassgold et al. 1985). The pointed measurements supported the density and temperature results shown in Fig. 3. The derived NLTE kinetic temperature is around 11K and assuming a distance of 400 pc the peak hydrogen density and the size of the NE lobe is =6.7104 cm-3 and 0.12 pc respectively. The column density estimate is cm-2. The total gas mass would be .
With 1021 cm-2, the visual extinction towards the cloud centre is 1 (Bohlin et al. 1978) and for UV photons the cloud is optically thick unless it is very clumpy. External heating, however, is reduced by the surrounding ISM, which is represented by the nonvanishing 12CO lines. This may be the reason that a moderate 6K temperature contrast was found to be more likely than a 10K contrast or isothermal.
Although the SW clump is clearly elongated similar modelling was carried out for that part of the cloud. Observed spectra were averaged over annuli at radii up to 50 from the clump centre. Assuming a model where the kinetic temperature increases linearly from the centre, we obtain a peak column density of =2.91020 cm-2 based on the CO spectra.
5 Concluding remarks
-
(i)
ISOSS 20246+6541 is a small isolated molecular cloud discovered by its 170 m emission.
-
(ii)
The globule appears as bipolar in both optical surface brightness and mm-line maps.
-
(iii)
A distance of 400 pc is likely, setting the diameter of the northern lobe to approximately 0.1 pc.
-
(iv)
The average physical parameters are: K, Hcm-3.
-
(v)
In the environment of ISOSS 20246+6541 we found further 15 ISOSS sources with similar FIR parameters. One of those is another previously unknown globule as seen on DSS2 images.
-
(vi)
The population of small and faint starless globules can only be explored by high sensitivity FIR measurements such as those carried out by PHT-C2 on board ISO.
-
(vii)
We note that there are no other ISO measurements but the ISOSS within 40′distance from ISOSS J 20246+6541. Our finding thus also demonstrates the importance of such ubiased surveys by future missions like Planck.
Acknowledgements.
We acknowledge the numerous valuable comments by Prof. Kalevi Mattila, and important notes by Dr. Mark Rawlings. The ISOPHOT project and Postoperation Phase was funded by the Deutsche Agentur für Raumfahrtangelegenheiten (DARA, now DLR), the Max-Planck-Gesellschaft, the Danish, British and Spanish Space Agencies and several European and American institutes.Members of the Consortium on the ISOPHOT Serendipity Survey (CISS) are MPIA Heidelberg, ESA ISO SOC Villafranca, AIP Potsdam, IPAC Pasadena, Imperial College, London.
L. V. Tóth acknowledges an MPI research fellow grant. This research was partly supported by the OTKA F-022566 grant and by the Academy of Finland through grants No. 158300 and 173727.
This research has made use of the Digitized Sky Survey, produced at the Space Telescope Science Institute, NASA’s Astrophysics Data System Abstract Service, the Simbad Database, operated at CDS, Strasbourg, France.
References
- Bally and Langer (1982) Bally J. and Langer W.D., 1982, ApJ 255, 143
- Bogun et al. (1996) Bogun S., Lemke D., Klaas U., et al., 1996, A&A 315, L71
- Bohlin et al. (1978) Bohlin R.C., Savage B.D., Drake J.F., 1978, ApJ 224, 132
- Bok and Reilly (1947) Bok B.J., Reilly E.F., 1947, ApJ 105, 255
- Clemens & Barvainis (1988) Clemens D.P., Barvainis R. 1988, ApJS 68, 257
- Cutri et al. (1993) Cutri R.M., Low F.J., Guhathrakurta P., 1993, PASP 105, 106
- Glassgold et al. (1985) Glassgold A.E., Huggins P.J., & Langer W.D. 1985, ApJ 290, 615
- Hildebrand (1983) Hildebrand R.H., 1983, QJRAS 24, 267
- Hotzel et al. (2001) Hotzel S., Harju J., Lemke D. et al.2001, A&A 372, 302
- Juvela (1997) Juvela M., 1997, A&A 322, 943
- Kun (1998) Kun M., 1998, ApJS 115, 59
- Larson (1981) Larson R.B. 1981, MNRAS 194, 809
- Launhardt & Henning (1997) Launhardt R., Henning T., 1997, A&A 326, 329
- Leinert et al. (1998) Leinert Ch., Bowyer S., Haikala L.K. et al., 1998 A&AS 127, 1
- Lemke et al. (1996) Lemke D., Klaas U., Abolins J., et al., 1996, A&A 315, L64
- Lynds (1998) Lynds, B.T., 1962, ApJS, 7, 1.
- Leung (1985) Leung C.M. 1985, in Protostars & Planets II, Black D.C., Matthews M.S. (eds.), The University of Arizona Press, Tucson, p. 104
- Monet et al. (1998) Monet, D.G. et al. 1998, USNO-A2.0, Washington DC, USNO
- Nelson (1999) Nelson R.P., Langer W.D. 1999, ApJ 524, 923
- Stickel et al. (2000) Stickel M., Lemke D., Klaas U. et al., 2000, A&A 359, 865
- Tóth et al. (2000) Tóth L.V., Hotzel S., Krause O., et al., 2000, A&A, 364, 769
- Ward-Thompson et al. (2002) Ward-Thompson, D., André, P., Kirk, J.M., 2002, MNRAS 329, 257
- Warin et al. (1996) Warin S., Benayoun J.J., Viala Y.P. 1996, A&A 308, 535
- Wheelock et al. (1994) Wheelock S.L., Gautier T.N., Chillemi J., et al., 1994, IRAS sky survey atlas: Explanatory supplement. JPL Publication 94-11, IPAC, JPL
- Yonekura (1997) Yonekura Y., Dobashi K., Mizuno A., et al., 1997, ApJS 110, 21.