Discovery of a Methane Dwarf from the IfA-Deep Survey11affiliation: Based on observations obtained at the Subaru Telescope, Infrared Telescope Facility, and W. M. Keck Observatory.
Abstract
We present the discovery of a distant methane dwarf, the first from the Institute for Astronomy (IfA) Deep Survey. The object (“IfA 0230-Z1”) was identified from deep optical and -band imaging, being conducted as an IfA-wide collaboration using the prime-focus imager Suprime-Cam on the Subaru 8.2-m Telescope. IfA 0230-Z1 is extremely red in the (0.8–1.2 µm) bands but relatively blue in ; such colors are uniquely characteristic of T dwarfs. A near-IR spectrum taken with the Keck Telescope shows strong H2O absorption and a continuum break indicative of CH4, confirming the object has a very cool atmosphere. Comparison with nearby T dwarfs gives a spectral type of T3–T4 and a distance of 45 pc. Simple estimates based on previous T dwarf discoveries suggest that the IfA survey will find a comparable number of T dwarfs as the 2MASS survey, albeit at a much larger average distance. We also discuss the survey’s ability to probe the galactic scale height of ultracool (L and T) dwarfs.
1 Introduction
In the past few years, observational studies of substellar objects have been revolutionized, in large part from the advent of wide-field sky surveys, namely the 2-Micron All-Sky Survey (2MASS; Skrutskie et al., 1997), the Deep Near-Infrared Survey of the Southern Sky (DENIS; Epchtein et al., 1999), and the Sloan Digital Sky Survey (SDSS; York et al., 2000). The coolest of the known substellar objects, the T dwarfs, are identified by absorption features from CH4, which becomes the dominant C-bearing molecule for K (Fegley & Lodders, 1996). The first T dwarf, GL 229B, was found as a companion to a nearby M star (Nakajima et al., 1995). Field T dwarfs have subsequently been found by SDSS (Strauss et al., 1999; Tsvetanov et al., 2000; Leggett et al., 2000; Geballe et al., 2002), 2MASS (Burgasser et al., 1999, 2000b, 2000a, 2002), and the NTT Deep Field (Cuby et al., 1999). To date, more than 20 of these objects are known (Burgasser, 2001). These objects are of great interest for numerous reasons, e.g., they are the lowest mass field objects known to date, and their physical properties are in many ways more akin to giant planets than to stars.
The spectral energy distributions (SEDs) of T dwarfs are distinct from all other known astronomical bodies, characterized by steeply rising flux in the optical from 0.8–1.0 µm due to the pressure-broadened K I doublet and a near-IR continuum () showing strong absorption from H2O, CH4, and collisionally induced H2 opacity (Kirkpatrick et al., 1999; Burrows et al., 2000; Liebert et al., 2000; Burgasser et al., 2002; Geballe et al., 2002; Leggett et al., 2002). As a result, their broad-band colors are unique: their optical colors are extremely red up to -band (1.25 µm), while near-IR colors are at least as blue as early-type stars, with the coolest objects being uniquely blue in the IR. Hence, pure infrared surveys such as 2MASS can identify the coolest T dwarfs, which have very strong CH4 absorption, but are insensitive to the warmer objects, which have IR colors similar to main sequence stars, giant stars, and asteroids. In contrast, the far-red ( and ) bands of the SDSS provide good sensitivity to T dwarfs over a wide range of temperture, including “L/T transition” objects (e.g. Leggett et al., 2000) where methane is just beginning to appear in the SEDs. In addition, the much higher etendue of current optical imagers compared to near-IR ones indicates that surveys in the far-red should be very scientifically fruitful. However, the relatively shallow depth of SDSS means that T dwarfs can be found only out to a distance of 30 pc.
The IfA-Deep Survey is an imaging survey being conducted as collaboration among many members of the Institute for Astronomy (IfA) at the University of Hawaii during 2001–2002. The project uses the prime-focus imager Suprime-Cam on the Subaru 8.2-m Telescope to map several blank fields in the far-red, the bands (0.6–1.0 µm), with a total area of 2.5 sq. degrees. This survey will serve a variety of scientific programs, including weak lensing; searches for high-redshift supernovae, extremely red galaxies, and high-redshift clusters; galactic structure studies; and time-variability surveys. Since the survey is on-going, a complete description of its properties awaits a future paper. The baseline design calls for 10 nights of observing, reaching limiting 5 Vega magnitudes of , , and mags, though the final outcome will depend on the vicissitudes of telescope performance and weather. Here we present the discovery of the survey’s first T dwarf, “IfA 0230-Z1”, found from the first clear night of observations. We also examine the survey’s total T dwarf yield and its sensitivity to the vertical scale height of ultracool dwarfs once completed.
2 Observations
2.1 Subaru/Suprime-Cam: Optical Imaging
Optical imaging of the RA 02:30 hr field of the IfA-Deep Survey was obtained on 22 October 2001 UT using the prime focus imager Suprime-Cam (Miyazaki et al., 1998) on the Subaru 8.2-m Telescope on Mauna Kea, Hawaii. The instrument is a mosaic of ten contiguous 20484096 MIT/Lincoln Lab phase 2 and 3 CCDs with a total field of view of 34′27′. Conditions were photometric with 08 FWHM seeing. We imaged two adjacent fields with a total area of 0.5 sq. degrees. Dithered , , -band observations were obtained with integrations of 560 s, 645 s, and 960 s per filter per pointing, respectively. The and -band filter are Cousins filters. The filter has an effective wavelength of 9195 Å and a FWHM of 1410 Å, very similar to that used by the SDSS survey (Fukugita et al., 1996).
Images were flattened, defringed, warped onto a common sky coordinate system, registered, and cleaned of cosmic rays. A preliminary photometric calibration of the and data was done using optical imaging previously obtained from smaller telescopes, which was calibrated with standards from Landolt (1992). For the data, the preliminary calibration was done by comparing the colors of stars in the Suprime-Cam data with the stellar locus. The latter was synthesized from the spectral energy distributions of Gunn & Stryker (1983) and the instrumental (filter+detector+atmosphere) transmission profiles. The resulting magnitudes in Table 1 are Vega-based.
2.2 IRTF/Spex and Keck/NIRSPEC: Infrared Follow-Up
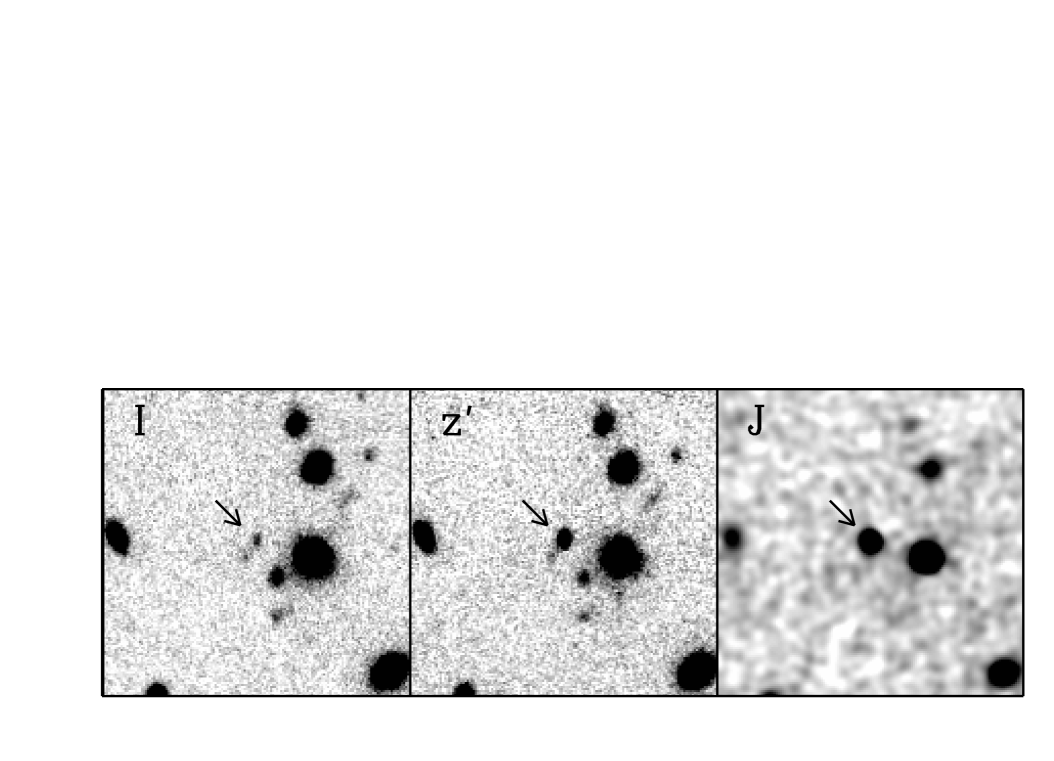
We identified an extremely red stellar object at RA(2000) = 02:26:37.6, DEC(2000) = 00:51:54.7 in the and -band imaging. We refer to it as “IfA 0230-Z1” hereinafter. We obtained and -band photometry on 06 November 2001 UT using the facility spectrograph Spex (Rayner et al., 1998). Spex has a slit-viewing camera, which uses a 512512 InSb array from Raytheon-SBRC and has a pixel scale of 0118 pixel-1. Conditions were photometric with 085 FWHM seeing. We obtained a total of 18 min and 10 min of integration at and -band respectively. The Spex filters were purchased as part of the Mauna Kea Filter Consortium (Simons & Tokunaga, 2001; Tokunaga et al., 2001), and hence will be common to most of the current major infrared telescopes. We obtained images of the standard star SJ 9105 from Persson et al. (1998) immediately after observing IfA 0230-Z1. The resulting magnitudes in Table 1 are Vega-based.
We obtained an -band spectrum of IfA 0230-Z1 on 10 November 2001 UT with the Keck Telescope and the facility spectrograph NIRSPEC (McLean et al., 1998). NIRSPEC uses a 10241024 InSb ALADDIN detector from Raytheon-SBRC. A total of 30 min of integration was obtained in low resolution mode using the NIRSPEC-5 blocking filter and the 076 slit. Conditions were very non-photometric due to high thick cirrus. The object was dithered on the slit between exposures. The slit PA was set to 736 east of north, so that the bright object 565 away (“object A”) was also on the slit for all the exposures. This provided a well-detected reference for registering the frames, and also a check on the resulting spectrophotometry (see below). A nearby A0V star was observed immediately afterward to calibrate the telluric and instrumental throughput.
The spectra were reduced using custom IDL scripts. The raw images on the NIRSPEC detector are curved in both the spectral and spatial directions. After subtracting a dark frame and dividing by a flat field, the individual images were cleaned of outlier pixels and rectified using traces of the arc lamp lines and the object spectra. Pairs of images taken at successive nods were subtracted to remove the sky emission. Images were then registered, shifted, and stacked to form a final 2-d mosaic of the spectrum. Extractions of 1-d spectra from the mosaic were done in a manner to produce reliable errors based on photon counting (Poisson) statistics. Details will be presented in a future paper. We divided the extracted spectra by the spectra of the A0V calibrator star and then multiplied by a 9720 K blackbody to restore the true shape of the continuum. Hydrogen absorption features in the calibrator were removed by linear interpolation. Wavelength calibration was done with spectra of argon and neon lamps.
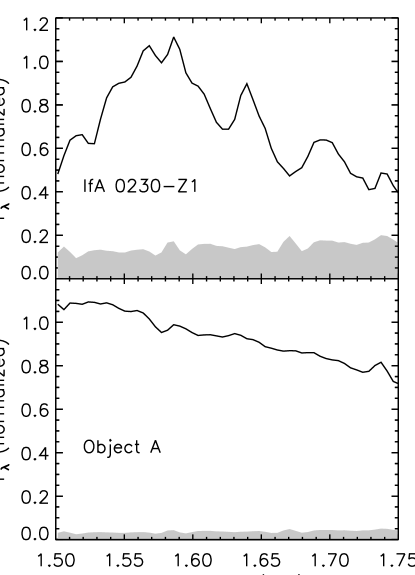
The spectral resolution () of the original extracted spectra was (9.7 Å); many of the telluric OH emission lines are well-separated from each other. The resulting S/N was only pixel-1, so we smoothed the spectra with a 32 pixel FWHM Gaussian, with proper weighting accounting for the measurement errors, and rebinned the data to 2 pixels per spectral resolution element. The final spectra have a resolution of and are plotted in Figure 2.
3 Analysis
3.1 Spectral Classification
The -band colors of IfA 0230-Z1 are extremely red, while the colors are relatively blue. Such colors are uniquely characteristic of T dwarfs. IfA 0230-Z1 has mag (Vega), comparable to the reddest known T dwarfs. Its color of 0.340.05 indicate a spectral type of T3–T4 (Leggett et al., 2002).
Figure 2 shows the Keck/NIRSPEC spectra of IfA 0230-Z1 and object A, which were observed simultaneously and reduced in an identical fashion. The spectrum of object A shows a featureless continuum , consistent with the near-IR continuum of a low redshift galaxy (Mannucci et al., 2001). On the other hand, IfA 0230-Z1 shows a peak in its continuum around 1.58 µm. The continuum is depressed in the blue and the red around the peak, indicating the presence of H2O and CH4 absorption, respectively. Since object A’s spectrum does not show any such features, we conclude that these features are real and not due to, e.g., systematic errors in the spectrophotometry due to telluric water vapor.111We also observed IfA 0230-Z1 using Keck/NIRSPEC with the same instrumental configuration on the previous night for a total of 20 min. Conditions were more cloudy, and the resulting spectrum had much lower S/N. However, the overall shape of the object’s continuum was consistent with the higher S/N data in Figure 2, with a factor of 2 drop from the peak to the reddest wavelengths. Given its very low S/N, we chose not to use this data.
Figure 2 provides a comparison of IfA 0230-Z1 with local T dwarfs found in the SDSS and classified by Geballe et al. (2002). Based on this, we estimate a spectral type of T3–T4 for IfA 0230-Z1, which agrees with the typing from the broad-band colors alone. Since the shape of the -band continuum is changing rapidly with spectral type, the uncertainty in the spectral typing is no more than 1 spectral subclass.
3.2 Distance
Only three T dwarfs have known distances, all of them companions to main sequence stars. Two of them, GL 229B and GL 570D, are much cooler objects than IfA 0230-Z1, with stronger CH4 absorption (Oppenheimer et al., 1995; Burgasser et al., 2000b). The third, GL 86B, appears to have modest methane absorption like IfA 0230-Z1, but its magnitudes and colors are poorly known (Els et al., 2001). Also, at fixed effective temperature/spectral type, younger (less massive) brown dwarfs will be more luminuous than older (more massive) ones. Hence, even if there were T3 dwarfs with known distances, their ages and hence their luminosities might be different than IfA 0230-Z1.
We estimate the distance as follows. For ages older than 0.1 Gyr, the radius of a brown dwarf is largely independent of its mass, to within about 30% (Burrows et al., 2001). Hence, . The bolometric correction at -band is observed to be nearly constant for late-L and T dwarfs (Leggett et al., 2002) so the absolute -band magnitude will scale directly with 4. The difference in effective temperature between the late-L dwarfs and the late-T dwarf GL 229B is estimated to be quite small, perhaps only 1300 to 1000 K (Kirkpatrick et al., 2000; Burgasser et al., 2002). Adopting K for IfA 0230-Z1 means its -band absolute magnitude will be 0.6 mag brighter than for GL 229B, which has mag (Leggett et al., 1999). (Note that this is a differential comparison and does not depend on the absolute scale adopted.) Hence, we estimate mag for IfA 0230-Z1. This compares favorably to the two L8 dwarfs with known distances, which have an average mag (Kirkpatrick et al., 2000). The resulting distance estimate for IfA 0230-Z1 is 45 pc, with an error of 20% (9 pc) based on the uncertainties in the radius and absolute -band magnitude.
3.3 Survey Predictions: Number Counts and Scale Height of Ultracool Dwarfs
The 0230 field of the IfA-Deep survey is contained with the SDSS Early Data Release (Stoughton et al., 2002), but IfA 0230-Z1 is 0.6 mags too faint in to be detected by SDSS. With the detection of only a single object, any discussion of the T dwarf number counts at magnitudes fainter than SDSS is unwarranted. However, we can do a simple comparison. The first five T dwarfs from SDSS (Strauss et al., 1999; Tsvetanov et al., 2000; Leggett et al., 2000) were found in an area of 355 square degrees, with an effective limiting magnitude of mags (Vega). This means a surface density of about 1 per 70 square degrees. Our -band imaging of the 0230 field used in this paper reaches 4 mags deeper. Assuming a uniform volume density of T dwarfs, the expected surface density would be 1 per 0.3 square degrees, consistent with our discovery of a single object. The final IfA survey will go a factor of 3 deeper in flux and cover 5 times more area, suggesting a total yield of 40 T dwarfs. In comparison, 13 T dwarfs have been found from the 40% of the 2MASS data searched to date (Burgasser, 2001). This suggests the IfA survey will find a comparable number of T dwarfs as the entire 2MASS survey, albeit at a much larger average distance. However, these numbers should be taken with caution since they are based on the small sample of objects found to date by SDSS.
The completed IfA-Deep survey will be sensitive to T dwarfs out to 300 pc and L dwarfs out to 2 kpc. By probing several lines of sight, the survey should provide the first insights into the vertical scale height of ultracool dwarfs. To examine this aspect quantiatively, we consider a simple model of an exponential disk based on Wainscoat et al. (1992), with a radial scale length of 3.5 kpc and different vertical scale heights. For the L dwarfs, we adopt a local volume density of 0.01 pc-3 and assume an equal number of objects per spectral subclass (L0 to L8), consistent with the analyses of Reid et al. (1999) and Chabrier (2001). We adopt a local volume density for T dwarfs of 0.006 pc-3, using the Burgasser (2001) results for T5 to T8 dwarfs and then doubling it to account for early T dwarfs excluded from their 2MASS-selected sample. For the T dwarfs, we assume half the population is in early T dwarfs, with the rest equally divided into T6, T7, and T8 dwarfs. These inputs are very approximate, but consistent with the limited current observations. Finally, we compute -band absolute magnitudes using data from Kirkpatrick et al. (2000), Burgasser et al. (2000b), Els et al. (2001), and Leggett et al. (2002).
The differences in the observed counts of L and T dwarfs between our low and high galactic latitude fields will be very sensitive to the objects’ vertical scale height. The 0230 field lies at very high galactic latitude (), while other fields in the IfA-Deep Survey cover lower latitudes, down to the 0749 field at . For a canonical scale height of 325 pc, we predict the counts of L dwarfs in our high and low latitude fields will differ by a factor of 3. In contrast, if the scale height for ultracool objects is 100 pc, akin to the Population I constitutents of the Galactic disk (Cox, 2000), the difference between high and low latitude counts will be much larger, about a factor of 9. For the T dwarfs, the dependence on scale height has a different behavior, since our survey is only sensitive to much closer objects. For a 325 pc scale height, the low latitude field is predicted to have about 1.5 times as many T dwarfs as the high latitude field. However, in the case of a 100 pc scale height, there should be 3 times as many T dwarfs in the low latitude field compared to the high latitude field.
4 Conclusions
We have found a methane dwarf from the first night of observations for the IfA-Deep Survey. The object has very red optical colors and relatively blue near-IR colors. Its -band spectrum shows strong H2O and modest CH4 absorption. The inferred spectral type is T3–T4. The majority of T dwarfs known to date have very deep CH4 absorption, so IfA 0230-Z1 is an interesting object in that it lies in a transition region of spectral type (and hence ), where methane is beginning to dominate the SED. The colors of early T-type objects, like IfA 0230-Z1, make them difficult to identify in pure near-IR surveys such as 2MASS but they are easily distinguished in our deep optical/far-red survey. Such objects are useful to understand the physics of ultracool atmospheres. Slightly warmer objects, the late L-dwarfs, have extremely red near-IR colors, which have been interpreted as being due to the role of dust. However, the very blue near-IR colors of T dwarfs are consistent with “clear”, i.e., dust-free, atmospheres (e.g. Tsuji, 2001).
With its high sensitivity in the far-red bands, the IfA-Deep survey will be an excellent means to search for brown dwarfs. Preliminary estimates based on the T dwarf discoveries by SDSS suggests the IfA survey will find a comparable number of T dwarfs as the 2MASS survey, albeit at a much larger average distance. The final survey will go 100 times fainter than SDSS, raising the possibility of finding isolated brown dwarfs much cooler than those found to date. Furthermore, the survey will be sensitive to T dwarfs out to 300 pc and L dwarfs out to kpc along several lines of sight, at galactic latitudes ranging from . This raises the possibility of providing the first insights into the vertical scale height of ultracool dwarfs, thereby telling us about their origin in a galactic context.
References
- Burgasser (2001) Burgasser, A. J. 2001, in 4th Tetons Summer Conference on Galactic Structure, Stars, and the Interstellar Medium, in press (astro-ph/0101242)
- Burgasser et al. (1999) Burgasser, A. J. et al. 1999, ApJ, 522, L65
- Burgasser et al. (2000a) —. 2000a, AJ, 120, 1100
- Burgasser et al. (2000b) —. 2000b, ApJ, 531, L57
- Burgasser et al. (2002) —. 2002, ApJ, 564, 421
- Burrows et al. (2001) Burrows, A., Hubbard, W. B., Lunine, J. I., & Liebert, J. 2001, Rev. Mod. Physics, in press (astro-ph/0103383)
- Burrows et al. (2000) Burrows, A., Marley, M. S., & Sharp, C. M. 2000, ApJ, 531, 438
- Chabrier (2001) Chabrier, G. 2001, ApJ, in press (astro-ph/0110024)
- Cox (2000) Cox, A. N. 2000, Allen’s Astrophysical Quantities (4th ed.) (New York: Springer)
- Cuby et al. (1999) Cuby, J. G., Saracco, P., Moorwood, A. F. M., D’Odorico, S., Lidman, C., Comerón, F., & Spyromilio, J. 1999, A&A, 349, L41
- Els et al. (2001) Els, S. G., Sterzik, M. F., Marchis, F., Pantin, E., Endl, M., & Kurster, M. 2001, A&A, in press
- Epchtein et al. (1999) Epchtein, N. et al. 1999, A&A, 349, 236
- Fegley & Lodders (1996) Fegley, B. J. & Lodders, K. 1996, ApJ, 472, L37
- Fukugita et al. (1996) Fukugita, M., Ichikawa, T., Gunn, J. E., Doi, M., Shimasaku, K., & Schneider, D. P. 1996, AJ, 111, 1748
- Geballe et al. (2002) Geballe, T. et al. 2002, ApJ, 564, 466
- Gunn & Stryker (1983) Gunn, J. E. & Stryker, L. L. 1983, ApJS, 52, 121
- Kirkpatrick et al. (1999) Kirkpatrick, J. D., Reid, I. N., Liebert, J., Cutri, R. M., Nelson, B., Beichman, C. A., Dahn, C. C., Monet, D. G., Gizis, J. E., & Skrutskie, M. F. 1999, ApJ, 519, 802
- Kirkpatrick et al. (2000) Kirkpatrick, J. D., Reid, I. N., Liebert, J., Gizis, J. E., Burgasser, A. J., Monet, D. G., Dahn, C. C., Nelson, B., & Williams, R. J. 2000, AJ, 120, 447
- Landolt (1992) Landolt, A. U. 1992, AJ, 104, 340
- Leggett et al. (1999) Leggett, S. K., Toomey, D. W., Geballe, T. R., & Brown, R. H. 1999, ApJ, 517, L139
- Leggett et al. (2000) Leggett, S. K. et al. 2000, ApJ, 536, L35
- Leggett et al. (2002) —. 2002, ApJ, 564, 452
- Liebert et al. (2000) Liebert, J., Reid, I. N., Burrows, A., Burgasser, A. J., Kirkpatrick, J. D., & Gizis, J. E. 2000, ApJ, 533, L155
- Mannucci et al. (2001) Mannucci, F., Basile, F., Poggianti, B. M., Cimatti, A., Daddi, E., Pozzetti, L., & Vanzi, L. 2001, MNRAS, 326, 745
- McLean et al. (1998) McLean, I. S. et al. 1998, in Proc. SPIE Vol. 3354, p. 566-578, Infrared Astronomical Instrumentation, Albert M. Fowler; Ed., Vol. 3354, 566–578
- Miyazaki et al. (1998) Miyazaki, S., Sekiguchi, M., Imi, K., Okada, N., Nakata, F., & Komiyama, Y. 1998, in Proc. SPIE Vol. 3355, p. 363-374, Optical Astronomical Instrumentation, Sandro D’Odorico; Ed., Vol. 3355, 363–374
- Nakajima et al. (1995) Nakajima, T., Oppenheimer, B. R., Kulkarni, S. R., Golimowski, D. A., Matthews, K., & Durrance, S. T. 1995, Nature, 378, 463
- Oppenheimer et al. (1995) Oppenheimer, B. R., Kulkarni, S. R., Matthews, K., & Nakajima, T. 1995, Science, 270, 1478
- Persson et al. (1998) Persson, S. E., Murphy, D. C., Krzeminski, W., Roth, M., & Rieke, M. J. 1998, AJ, 116, 2475
- Rayner et al. (1998) Rayner, J. T., Toomey, D. W., Onaka, P. M., Denault, A. J., Stahlberger, W. E., Watanabe, D. Y., & Wang, S. 1998, in Proc. SPIE Vol. 3354, p. 468-479, Infrared Astronomical Instrumentation, Albert M. Fowler; Ed., Vol. 3354, 468–479
- Reid et al. (1999) Reid, I. N. et al. 1999, ApJ, 521, 613
- Simons & Tokunaga (2001) Simons, D. A. & Tokunaga, A. T. 2001, PASP, in press (astro-ph/0110594)
- Skrutskie et al. (1997) Skrutskie, M. F. et al. 1997, in ASSL Vol. 210: The Impact of Large Scale Near-IR Sky Surveys, 25
- Stoughton et al. (2002) Stoughton, C. et al. 2002, AJ, 123, 485
- Strauss et al. (1999) Strauss, M. A. et al. 1999, ApJ, 522, L61
- Tokunaga et al. (2001) Tokunaga, A. T., Simons, D. A., & Vacca, W. D. 2001, PASP, in press (astro-ph/0110593)
- Tsuji (2001) Tsuji, T. 2001, in Proceedings of IAU Symposium 202: Ultracool Dwarfs — Surveys, Properties and Spectral Classification, ed. H. R. A. Jones & I. Steele (Springer-Verlag), 9
- Tsvetanov et al. (2000) Tsvetanov, Z. I. et al. 2000, ApJ, 531, L61
- Wainscoat et al. (1992) Wainscoat, R. J., Cohen, M., Volk, K., Walker, H. J., & Schwartz, D. E. 1992, ApJS, 83, 111
- York et al. (2000) York, D. G. et al. 2000, AJ, 120, 1579

| Filter () | Mag (Vega) |
|---|---|
| (0.66 µm) | 25.5 |
| (0.81 µm) | 23.61 0.10 |
| (0.92 µm) | 20.91 0.15 |
| (1.24 µm) | 18.17 0.03 |
| (1.65 µm) | 17.83 0.04 |