Probing the stellar populations of early-type galaxies:
the SAURON survey
Abstract
The SAURON project will deliver two-dimensional spectroscopic data of a sample of nearby early-type galaxies with unprecedented quality. In this paper, we focus on the mapping of their stellar populations using the SAURON data, and present some preliminary results on a few prototypical cases.
1 Centre de Recherche Astronomique de Lyon, Saint Genis Laval, France
2 Physics Departement, University of Durham, Durham, UK
3 European Southern Observatory, Garching bei München, Germany
4 Department of Physics and Astronomy, University of Nottingham, Nottingham, UK
5 Sterrewacht Leiden, Leiden, The Netherlands
6 Department of Astronomy, Columbia University, New York, USA
7 Institut de Physique Nucléaire de Lyon, Villeurbanne, France
8 Gemini Observatory, La Serena, Chile
1. Introduction
In recent years very significant progress has been made in both the theoretical and observational study of the stellar populations of early-type galaxies. Stellar population synthesis models now rely on detailed stellar evolution tracks and much more complete stellar libraries at higher resolution (e.g. Vazdekis et al. 1996, Kodama & Arimoto 1997). Recent work on nearby samples of galaxies have often focused on the breaking of the age-metallicity degeneracy, following the widely used Lick/IDS indices to probe dynamically hot galaxies (Jørgensen 1999). Kuntschner (2000) emphasized the effect of non-solar abundance particularly when interpreting the observed line indices of early-type, metal rich, galaxies: Fornax ellipticals thus exhibit a relatively narrow spread in age, the distribution of galaxies in index/index diagrams being mostly attributed to differences in metallicity.
Although the conclusions reached by these studies do indeed converge towards a scenario consistent with the so-called hierarchical universe, the question originally posed by the Lick group two decades ago is still pertinent: when and how do early-type galaxies form? Most observational campaigns along these lines have considered line-strength gradients only, and where thus only able to probe a one-dimensional (long-slit) section of the galaxies. Two-dimensional spectroscopy has been mostly used for probing the kinematics of galaxies. Except in a handful of cases (e.g. Emsellem et al. 1996, Peletier et al. 1999, del Burgo et al. 2001), the available stellar absorption lines have only served a surprisingly restricted purpose.
One of the aims of the SAURON project is to provide the 2D spatial coverage which is missing. In this paper, we describe the approach the SAURON group is following, and present some preliminary results regarding the stellar populations for a few prototypical examples of galaxies in the SAURON sample.
2. From where, to where?
The essential ingredients of a good recipe for the formation and evolution of early-type galaxies should include a treatment of the star formation history, together with a scheme that links this to their dynamics and morphology. We first sum up briefly what we know about their chemical and dynamical properties.
2.1. What do we know?
Early-type galaxies are found preferentially in high local density regions. Their properties vary, from giant luminous ellipticals which are assumed to be triaxial, pressure supported objects with shallow nuclear brightness profiles, to low luminosity ellipticals, which exhibit disky isophotes, are consistent with isotropic rotators and include steep power law central cusps. In this context, the bulges of early-type spirals resemble low-luminosity ellipticals. Most if not all galaxies are thought to harbour central supermassive black holes, the masses of which correlate with the mean stellar dispersion of the spheroid (Ferrarese & Merritt 2000, Gebhardt et al. 2000).
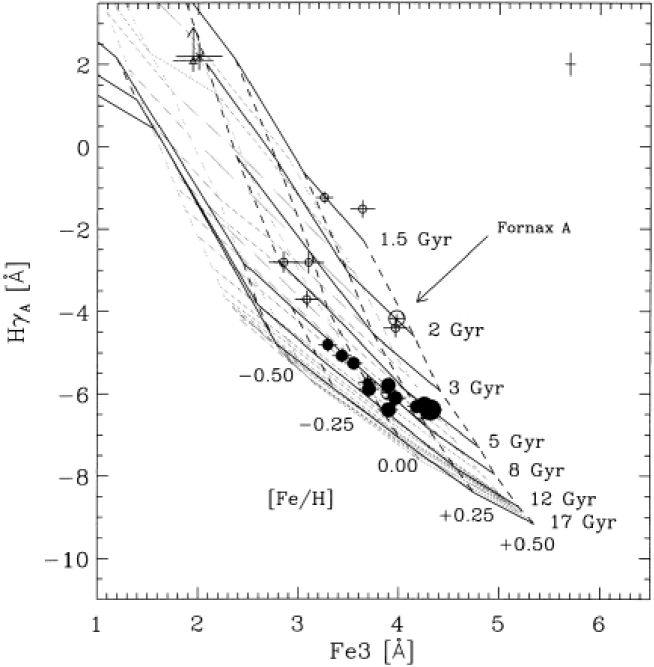
Colours of ellipticals become redder with higher luminosity, an effect usually attributed to a parallel increase in metal enrichment and alpha element abundance. The star formation timescale in ellipticals is thought to be short, and ellipticals in general are viewed as old, coeval systems in which, as already emphasized, metallicity increases with luminosity. S0s have a larger spread in (luminosity weighted) age than ellipticals (Kuntschner & Davies 1998, Kuntschner 2000; see Fig. 1).
As we look back in time, star formation rates increase and interactions and mergers become more common. Already by , the fraction of blue galaxies in rich clusters has increased dramatically compared to , a trend known as the Butcher Oemler effect (Butcher & Oemler 1984). Furthermore HST studies (Dressler et al. 1997) have shown that these blue galaxies are spirals that are 2 to 3 more common in intermediate redshift clusters with lenticular galaxies being correspondingly less common. The signatures of mergers are observed in todays lenticulars and ellipticals as e.g. shells, kiloparsec scale decoupled cores, or counter-rotating gas disks.
2.2. What would we like to know?
Any scenario for the formation and evolution of early-type galaxies should explain the basic changes in their properties in terms of luminosity, Hubble type and environment. What information can we hope to dig out? Galaxies (besides our own) are observed projected on the sky, leaving us two spatial dimensions, and only one (line-of-sight) velocity.
The first obstacle is therefore to solve the inverse problem of determining the intrinsic shapes of these galaxies. In dynamical terms, we can push things further by determining the dominant orbit families which constitute their skeleton. These certainly hold traces of the involved formation and evolution processes, including passive secular evolution. Then questions, more directly related to the hierarchical merging scenario, follow: how common are decoupled cores, how common and massive are black holes in galactic nuclei?
Other integrated quantities such as colours and line indices can then help us to examine the stellar population content of these galaxies. How common are the disks in ellipticals, and is their stellar population different (younger?) from the rest of the galaxy. Can we constrain the stellar populations of the decoupled cores, and more generally of individual orbit families? To determine the origin of the different morphological/dynamical components we therefore need to reconcile the kinematics and stellar populations.
2.3. SAURON: the goals
The SAURON project was motivated by the questions summarized above. The minimal requirements included the two-dimensional mapping of the kinematics and line strengths (including at least one age and one metallicity indicator) of a reasonable sample of early-type galaxies up to at least one half . We first designed a dedicated integral field spectrograph, to cover a field of view of 3341 arcsec2, and to work in the spectral domain around the Mg triplet at 5170 Å that includes Mg and Fe and H features as well as the [OIII] emission lines (see Bacon et al. 2001 for a description of the instrument). We then defined a representative sample of 72 galaxies, 24 for each E, S0 and Sa classes, evenly distributed in cluster and field type environments (de Zeeuw et al. 2002).
The SAURON observational campaign, representing more than 50 nights at the William Herschel Telescope (La Palma), is producing data with unprecedented uniformity and quality, and represents a unique database to unravel the stellar population - kinematics connection.
3. Age and composition of a galaxy
In practice, how do we determine the stellar population content of a galaxy, when it cannot be resolved into individual stars? The first step, adopted for stellar synthesis modeling, is to simulate the spectrum of a cluster whose stars share a single age and metallicity. Such a single burst spectrum can be built assuming an initial mass function (IMF), and following the stars along their evolution in the HR diagram. Each stellar spectrum is then matched using corresponding observed spectra. The final composite spectrum is the sum of the individual spectra weighted according to their respective contributions. This can be repeated for a grid of different ages and metallicities, and even different IMFs, to provide a set of template synthesized spectra. The observed galaxy spectrum can then be fitted, providing values for the luminosity-weighted mean age and metallicity.
Apart from the fact that a galaxy spectrum includes the contributions of stars with different ages and metallicities (integrated along the line of sight), the fitting of the full spectrum is sometimes not optimal as it may amplify errors in the flux calibration, does not necessarily focus on the relevant information, and requires very high signal-to-noise data. Since the age and metal enrichment are directly reflected in the depths of the absorption lines, these can be used as tracers of the stellar populations.
3.1. The Lick system
The Lick/IDS system of indices was thus designed with the purpose of focusing on important absorption features. These indices are easily measured, and can be compared with the values obtained from stellar synthesis models. Some indices are well known to be more age sensitive (e.g. hydrogen Balmer lines), or metalliticity sensitive (e.g. Fe lines).
However the Lick/IDS system was defined about 2 decades ago, and has a few limitations:
-
•
The spectral resolution used for the Lick system is Å, diluting the available spectral signatures.
-
•
The standard stellar spectra used to calibrate the Lick system were not flux calibrated.
-
•
As defined, the Lick indices are rather sensitive to the required correction for velocity broadening.
-
•
The measurements of the Lick stars are based on a non-linear detector.
These factors arise largely from the increase in efficiency and precision of modern instruments. Although we now see their limitations the Lick indices have played a pivotal role in the study of early-type galaxy populations for almost 30 years.
3.2. New models, indices and libraries
However, recent stellar synthesis models, such as those developed by Vazdekis and collaborators (Vazdekis 1999), do not just provide line indices, but also predict the spectrum over the SAURON range at a spectral resolution of 1.8 Å! This gives us the ability to define new, better adapted, indices, and to operate thorough spectral fitting of the galaxy data, even allowing for mixtures of different stellar populations.
In the context of the SAURON survey, we have therefore designed a new index, based on the original Fe5270 Lick one: it is less dependent on the broadening correction, and more sensitive to metallicity. New age-metallicity grids have been derived using the Vazdekis models which include up-to-date isochrones and stellar libraries. We have also observed a significant number of stars with SAURON, including high-metallicity ones, in order to compile a consistent library of stellar templates (Bacon et al. 2001).
4. Line strength maps with SAURON
4.1. Validation of the instrument
The first step before interpreting the SAURON line-strength maps is to validate the data itself by checking whether our line-strength measurements agree with previously published values. We have done this for a number of galaxies for which line-strengths are available in the literature, and Fig. 2 shows such a comparison in the case of NGC 5813. Overall, the agreement is excellent up to the edge of the SAURON field of view. There are some slight offsets between the different data sets, but these are within the quoted error bars.

4.2. Emission lines and how to get rid of them
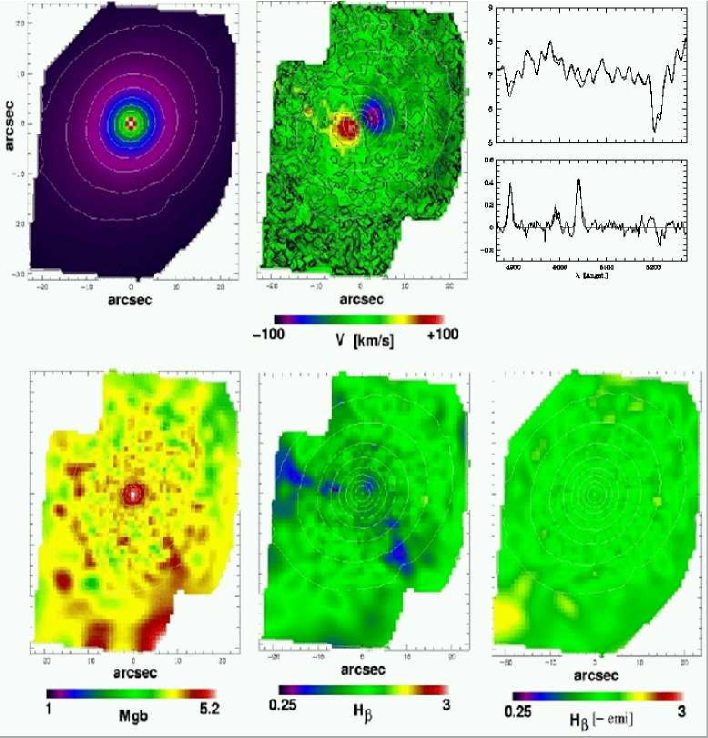
One important issue when deriving line-strengths is to make sure that emission lines are not contaminating the spectra, as this can sometimes be a major source of error particularly for the H and Mgb indices (Goudfrooij & Emsellem 1996). In order to correct for the contribution of emission lines, we have designed a simple three-step procedure. We first fit the spectra using a complete spectral library which includes both stars and galaxies without nebular emission. This fit is achieved by masking the spectral regions where emission lines may be present. The fit obviously requires the knowledge of the stellar kinematics (velocity and dispersion), also obtained by avoiding the contaminated regions. We then subtract the fits to obtain pure emission line spectra, which are themselves fitted using different components for each emission line (H, [OIII], [NI]). These emission-line fits are finally subtracted from the original spectra, (ideally) leading to emission-line free spectra. Line-strengths are measured from the emission-corrected spectra.
This procedure is illustrated in the case of NGC 5813, the central region of which exhibits the presence of emission line gas. Fig. 3 shows the H map before and after correction for the emission line contributions. In the former, there is a clear structure of lower H values which corresponds to a gaseous filament. As shown in the top right panel of Fig. 2, the H and [OIII]4959 emission lines are barely visible in the original spectra, but appear clearly in the residual pure emission-line spectra. After correction, the H map is flat over the full SAURON field of view, and shows no evidence for the presence of the decoupled core which is apparent only in the stellar velocity field.
5. SAURON results: two decoupled cores
In this Section, we present preliminary results of the SAURON observations of two decoupled cores, to illustrate the importance of two-dimensional spectroscopy in probing the stellar populations of early-type galaxies.
5.1. NGC 4365: the classical case
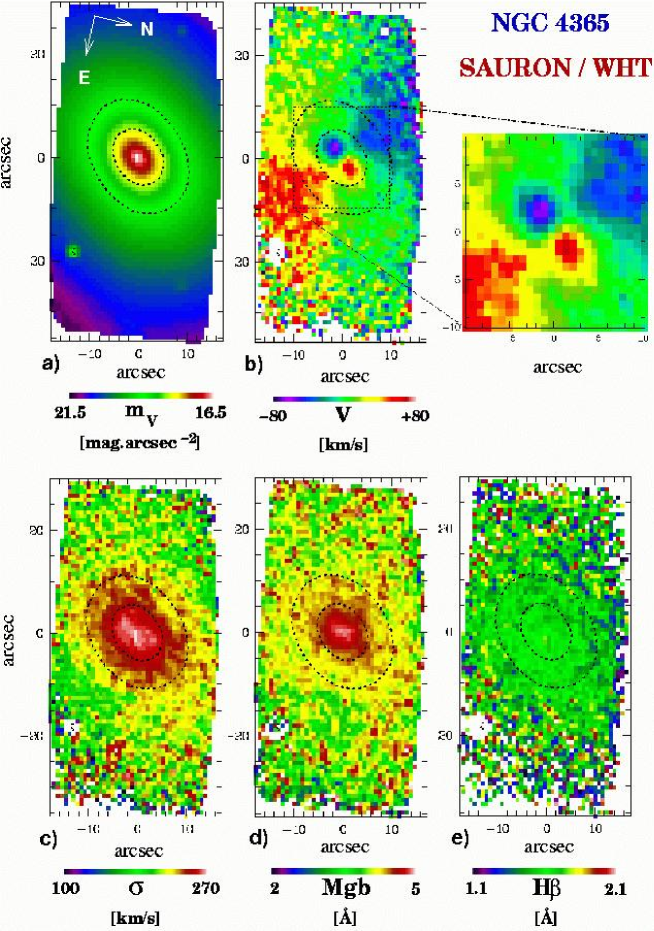
NGC 4365 is an elliptical known to harbour a kinematically decoupled core (Surma & Bender 1995). The kinematic major-axis of the core was assumed to lie at 90 degrees from that of the outer prolate-like body. However the SAURON kinematical maps revealed a more complex morphology with the zero velocity curve having a slowly varying position angle in the outer part (Davies et al. 2001). This strongly hints at a triaxial geometry the details of which can only be constrained by the full two-dimensional coverage provided by SAURON.
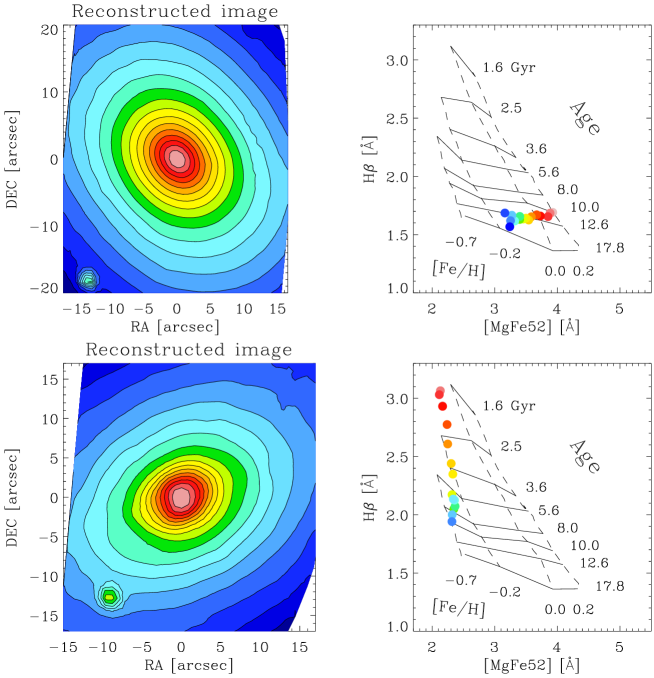
The line-strength maps lead to more surprising results. The Mgb increases towards the centre, with isocontours which closely resemble the galaxy isophotes. The H map is flat over the whole field, except perhaps for a slight unresolved peak at the very centre of the galaxy (Fig. 4). The stellar population of the core and the main body are found to be indistinguishable in age, metallicity and abundance ratios (Fig. 5). This strongly suggests that the decoupled core of NGC 4365 is the result of an early accretion, the core and the outer body of the galaxy being roughly coeval. It also tells us that the structure observed in NGC 4365 corresponds to a stable dynamical configuration.
5.2. NGC 4150: the post-starburst
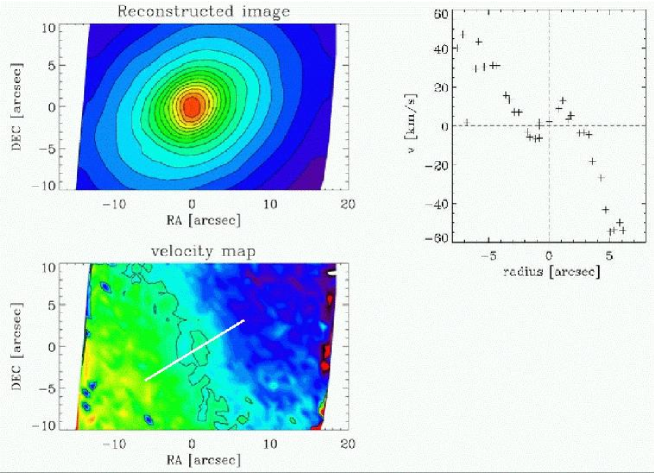
The case of NGC 4150, an S0 galaxy, is at first sight even more puzzling. The stellar velocity field shows the presence of a small counter-rotating core with a low velocity amplitude of about 20 km/s peak to peak. The Mgb map of NGC 4150 shows a central dip, and an enhanced H in the central few arcseconds! When projected on a H versus [MgFe5270] model grid, this corresponds to a slightly decreasing metallicity and strongly decreasing age towards the centre (Fig. 6). It thus seems that the central region of NGC 4150 was the scene of a recent gaseous accretion event followed by a burst of star formation.
6. Conclusions
In this paper, we presented the cases of NGC 4365 and NGC 4150 to illustrate the importance of two-dimensional spectroscopy for studying the stellar populations of galaxies. However, the complexity and richness in the structures of early-type galaxies will only be fully revealed when the complete set of SAURON datacubes has been analysed.
The SAURON campaign will end in April ’02. We will then have a unique data set to probe the stellar content of early-type galaxies. We are also gathering new stellar libraries and state-of-the-art stellar synthesis models. As emphasized in this paper, this is a critical step if we wish to fully exploit the SAURON datacubes. The efforts of the SAURON team are therefore not only directed to acquiring the observations for the representative sample of 72 early-type galaxies, but are also focused on the development of new analysis tools and models. These tools will allow us to link the chemical and dynamical history of ellipticals and early-type spirals, and to ultimately constrain the formation and evolution scenarios.
References
Bacon, R., Copin, Y., Monnet, G., et al. 2001, MNRAS, 326, 23
del Burgo, C., Peletier, R. F., Vazdekis, A., Arribas, S., Mediavilla, E. 2001, MNRAS, 321, 227
Butcher, H., Oemler, A. Jr., ApJ, 285, 426
Davies, R., Kuntschner, H., Emsellem, E., et al. 2001, ApJL, 548, 33
Dressler, A., Oemler, A. Jr., Couchm W. J., et al., 1997, ApJ, 490, 577
Emsellem, E., Bacon, R., Monnet, G., Poulain, P. 1996, A&A, 312, 777
Ferrarese, L., Merritt, D. 2000, ApJ 539, L9
Gebhardt, K., Bender, R., Bower, G., et al. 2000, ApJ, 539, L13
Goudfrooij, P., Emsellem, E. 1996, A&A, 306, 45
Kodama, T., & Arimoto, N. 1997, A&A, 320, 41
Kuntschner, H., Davies, R. 1998, MNRAS, 295, 29
Kuntschner, H., 2000, MNRAS, 315, 184
Jørgensen, I. 1999, MNRAS, 306, 607
Peletier, R. F., Vazdekis, A., Arribas, S., et al., 1999, MNRAS, 310, 863
Surma, P., Bender, R. 1995, A&A, 298, 405
Vazdekis, A., Casuso, E., Peletier, R. F., Beckman, J. E. 1996, ApJS, 106, 307
de Zeeuw, T., P., Bureau, M., Emsellem, E., 2002, MNRAS 329, 513