Discovery of narrow X-ray absorption features from the dipping low-mass X-ray binary X 1624490 with XMM-Newton
We report the discovery of narrow X-ray absorption features from the dipping low-mass X-ray binary X 1624490 during an XMM-Newton observation in 2001 February. The features are identified with the K absorption lines of Fe xxv and Fe xxvi and have energies of keV and keV and equivalent widths (EWs) of eV and eV, respectively. The EWs show no obvious dependence on orbital phase, except during a dip, and correspond to a column of Fe atom cm-2. In addition, faint absorption features tentatively identified with Ni xxvii K and Fe xxvi K may be present. A broad emission feature at keV with an EW of eV is also evident. This is probably the 6.4 keV feature reported by earlier missions since fitting a single Gaussian to the entire Fe-K region gives an energy of keV. A deep absorption feature is present during the dip with an energy consistent with Fe xxv K. This is the second dipping LMXRB source from which narrow Fe absorption features have been observed. Until recently the only X-ray binaries known to exhibit narrow X-ray absorption lines were two superluminal jet sources and it had been suggested that these features are related to the jet formation mechanism. It now appears likely that ionized absorption features may be common characteristics of accreting systems with accretion disks.
Key Words.:
Accretion, accretion disks – Stars: individual: X 1624490 – Stars: neutron – X-rays: general1 Introduction
The low-mass X-ray binary (LMXRB) source X 1624490 exhibits irregular dips in X-ray intensity that repeat every orbital cycle of 21 hr (Jones & Watson j:85 (1985)). This long orbital period means that as well as being the most luminous dip source, X 1624490 also has the largest stellar separation and is often referred to as the “Big Dipper”. It is generally accepted that these dips are due to obscuration in the thickened outer regions of an accretion disk (White & Swank ws:82 (1982)). The depth, duration and spectral properties of the dips vary from source to source and from cycle to cycle (see Parmar & White p:88 (1988) and White et al. w:95 (1995) for reviews). The X 1624490 X-ray lightcurve exhibits prominent flares, but no X-ray bursts have been observed (e.g., Bałucińska-Church et al. bc:01 (2001), Smale et al. s:01 (2001)). The X-ray continuum of X 1624490 may be modeled using blackbody and Comptonized components which are absorbed by a column of atom cm-2 (Bałucińska-Church et al. bc:00 (2000)). There is evidence for the presence of a dust scattering halo (Angelini et al. a:96 (1996)). During dips the point-like blackbody is rapidly obscured and the extended Comptonized component, presumably an accretion disk corona, is progressively covered by an extended absorber (Bałucińska-Church et al. bc:00 (2000)).
XMM-Newton is proving to be very successful in improving our understanding of the nature of emitting and absorbing regions in LMXRB. Reflection Grating Spectrometer (RGS) observations of the eclipsing and dipping system EXO 0748-676, revealed the presence of a rich variety of emission lines identified with O viii Ly, O vii He-like complex, Ne x Ly, Ne ix He-like complex and N vii Ly (Cottam et al. c:01 (2001)). In addition, photo-electric absorption edges of both O viii and O vii were detected as well as narrow radiative recombination continua of O viii and O vii near their respective absorption edges. The line features are significantly broadened with velocity widths of 1000–3000 km s-1, depending on the line, and no obvious velocity shift (300 km s-1). There is no obvious dependence of the line properties on orbital phase (even during X-ray eclipse). European Photon Imaging Camera (EPIC) and RGS spectra of the eclipsing and dipping system MXB 1658298 have revealed the presence of narrow resonant absorption features identified with O viii K, K, and K, Ne x K, Fe xxv K, and Fe xxvi K, together with a broad Fe emission feature at keV (Sidoli et al. st:01 (2001)). Again, the properties of these features show no obvious dependence on orbital phase, even during dipping intervals.
Until recently, the only X-ray binaries known to exhibit such narrow X-ray absorption lines were two superluminal jet sources and it had been suggested that these features are related to the jet formation mechanism. This now appears unlikely, and instead their presence may be related to the viewing angle of the system, or they may be a common feature of LMXRB systems as suggested by the recent detection of a narrow ( eV) absorption feature with an energy of keV from GX 13+1 (Ueda et al. u:01 (2001)). Here we report the discovery of narrow X-ray absorption features from highly ionized Fe in the XMM-Newton spectrum of X 1624490.

2 Observations
The XMM-Newton Observatory (Jansen et al. j:01 (2001)) includes three 1500 cm2 X-ray telescopes each with an EPIC at the focus. Two of the EPIC imaging spectrometers use MOS CCDs (Turner et al. t:01 (2001)) and one uses a PN CCD (Strüder et al. st:01 (2001)). The region of sky containing X 1624490 was observed by XMM-Newton on 2001 February 11 23:23 UT to February 12 23:06 UT as part of the Performance Verification Programme. In order to minimize the effects of pile-up the PN and one MOS were operated in their Small Window modes. The other MOS CCD was operated in its normal Full Frame mode and the data are strongly affected by pile-up and not discussed further. Due to the large amount of absorption there are too few counts in the 0.35–2.5 keV RGS to perform a useful analysis. The OM was not operated during the observation. Since useful data on X 1624490 was only obtained with one MOS, we concentrate on the analysis of PN data, and use the lower count rate MOS data to check for consistency.
Raw data products were extracted from the public XMM-Newton archive and then reprocessed using version 5.2 of the Science Analysis Software (SAS), before being further filtered using XMMSELECT. For the MOS only X-ray events corresponding to patterns 0–12 were selected. Known hot, or flickering, pixels and electronic noise were rejected using the SAS. Source events were extracted from circular regions of 60′′ radius centered on X 1624490. Background spectra were obtained from a total of 60 ks observations of several fields in the normal Full Frame modes. Background subtraction, however, is not critical for such a bright source. All quoted count rates and fluxes are corrected for instrumental deadtime.


3 Results
3.1 X-ray lightcurve
The 2–10 keV X 1624490 lightcurve obtained from the PN during the 2001 February observation is shown in Fig. 1 with a binning of 64 s. The upper panel shows the PN hardness ratio (counts in the energy range 4–10 keV divided by those between 2–4 keV) with a binning of 256 s. A dip started after 2001 February 12 05:47 UT and had a duration of 3 hours. During the dip the source exhibited rapid, irregular changes in count rate and hardness ratio. Such behavior is typical of X 1624490 (see e.g., Bałucińska-Church et al. bc:00 (2000); Smale et al. s:01 (2001)). During the persistent emission some flaring, as investigated in detail by Smale et al. (s:01 (2001)) and Bałucińska-Church et al. (bc:01 (2001)) who show that it is primarily a high-energy effect, not visible in RXTE Proportional Counter Array 2–6 keV data, but becoming dominant at energies 10 keV.
3.2 Persistent emission spectrum
The persistent emission spectrum of X 1624490 was first investigated by excluding source events between 2001 February 12 05:47 and 09:06 UT during the dip. This selection results in a 2.0–10 keV PN count rate of 89 s-1 and an exposure of 52 ks. This count rate is close to the 100 s-1 level, above which pile-up effects become important (Strüder et al. st:01 (2001)). At high count rates the energies of multiple events are added and assigned to a single event. This results in harder spectral continua than in the unaffected case, but should not produce additional line features. In the PN Small Window mode only a 63 x 63 pixel region of the central CCD is read out with a time resolution of 5.7 ms. In order to investigate the effects of pile-up a second spectrum was accumulated with the region contained within the central 11′ radius of the point spread function (PSF) excluded. This results in the loss of 45% of the counts. Both spectra were rebinned to oversample the full width half-maximum of the energy resolution by a factor 3 and to have additionally a minimum of 20 counts per bin to allow use of the statistic. In order to account for systematic effects a 2% uncertainty was added quadratically to each spectral bin. The photo-electric absorption cross sections of Morrison & McCammon (mc:83 (1983)) are used throughout. All spectral uncertainties are given at 90% confidence, unless indicated otherwise.
The overall continuum was modeled using absorbed blackbody and power-law components. A power-law was chosen rather that a cutoff power-law or Comptonization model since the cutoff energy of 12 keV (Bałucińska-Church et al., bc:00 (2000)) is too high to be important in the EPIC energy range. This combination models the overall shape of the continuum moderately well and gives s of 517.5 and 483.6 for 173 degrees of freedom (dof) for the total and PSF excluded spectra, respectively. A comparison of the best-fit parameters shows that, as expected, the total spectrum is significantly harder than the PSF excluded one. We therefore use the PSF excluded spectrum to determine the continuum parameters.
Two broad spectral features remain in both spectra centered on 2.5 and 3.5 keV. The first feature is almost certainly due to an incorrect modeling of the Au mirror edges, while the second feature, with a peak-to-peak amplitude of 5% is likely also due to remaining PN calibration uncertainties and is not visible in the MOS spectrum. Examination of the remaining fit residuals in both spectra shows that broad positive residuals are present near 6.6 keV, as well as two narrow negative residuals at slightly higher energies. The properties of these features are consistent between the two spectral fits. Since pile-up is not expected to significantly affect narrow spectral features, we use the results obtained from the fit to the total spectrum to investigate the properties of any discrete spectral features. The addition of a keV broad emission line at keV with an equivalent width (EW) of eV reduced the to 299.7 for 170 dof. When modeled in this way, this feature is consistent with that seen by previous missions such as ASCA which measured an energy of keV and an EW of eV (Asai et al. a:00 (2000)). The F-statistic value of 41.2 indicates that the probability of such a decrease occurring by chance is . The narrow features were modeled as Gaussian absorption lines. Including the first feature at keV with an EW of eV reduced the to 249.0 for 167 dof. This decrease in corresponds to an F-statistic of 11.3. The probability of such a decrease occurring by chance is . Including a second narrow feature at keV with an EW of eV reduced the to 218.9 for 164 dof. This decrease in corresponds to an F-statistic of 7.5. The probability of such a decrease occurring by chance is . When the two absorption lines are included in the fit, the properties of the emission feature change to a best-fit energy of keV, a width () of eV and an EW of eV. Fig. 2 shows the best-fit spectral fit model for the X 1624490 total spectrum. The best-fit parameters derived from the fit to the PSF core excluded spectrum consist of a keV blackbody with a radius of km (for a distance of 15 kpc), together with a power-law with a photon index, , of . Both components are modified by absorption equivalent to atom cm-2. The best-fit continuum and line model parameters are given in Table LABEL:tab:spectrum and the residuals in the region around the Fe features are shown in Fig. 3.
Fig. 3 also shows evidence for the presence of two additional narrow absorption features at and keV with EWs of and eV, respectively (at 68% confidence). The measured energies are consistent with those of Ni xxvii K at 7.806 keV and Fe xxvi K at 8.26 keV, both features seen in the ASCA spectrum of GRS 1915+106 by Kotani et al. (k:00 (2000)). The reductions in when these features are added to the best-fit spectral model are however not significant. We caution also that this is a spectral region where the EPIC calibration is still relatively uncertain, and so we regard the presence, and proposed identifications, of the features as tentative. We have searched for absorption edges in the PN spectrum due to neutral Fe, Fe xxv, and Fe xxvi expected at 7.12, 8.83 and 9.28 keV. The 95% confidence upper-limit to the optical depth of an edge at 7.12 keV is 0.009 and there is some evidence for the presence of edges at 8.83 and 9.28 keV with optical depths of and .
| Component | Parameter | Value |
| ( atom cm-2) | ||
| (erg s-1) | ||
| /dof | 195.6/164 | |
| Blackbody | (keV) | |
| Radius (km) | ||
| Power-law | ||
| Normalization at 1 keV | ||
| Fe emission | (keV) | |
| feature | (eV) | |
| ( ph cm-2 s-1) | ||
| EW (eV) | ||
| Fe xxv abs | (keV) | |
| feature | (eV) | 50 |
| ( ph cm-2 s-1) | ||
| EW (eV) | ||
| Fe xxvi abs | (keV) | |
| feature | (eV) | 56 |
| ( ph cm-2 s-1) | ||
| EW (eV) |

3.3 Orbital dependence of the spectral features
In order to investigate whether the properties of the absorption features depend on orbital phase, the persistent emission interval was divided into three approximately equal duration parts, one before the dip, and two after (see Fig. 1). The approximate phases covered are 0.57–0.88, 0.03–0.37 and 0.37–0.70 using the ephemeris of Smale et al. (s:01 (2001)), which has an uncertainty of 0.03 at the time of the XMM-Newton observation (phase 0.0 corresponds to the dip centers). The same continuum model as used in Sect. 3.2 was fit to the 3 PN spectra and the EWs of the two Fe absorption features determined. For the deeper 7.00 keV feature, EWs of , , and eV were obtained. Thus, there does not appear to be any obvious dependence of the EW of the Fe xxvi feature on orbital phase, at least outside of dipping intervals. A similar analysis, when applied to the shallower Fe xxv feature is not so constraining, but gives a similar result.
The properties of the absorption features during the dip were next investigating by accumulating PN spectra during intervals of deep and shallow dipping activity. Events were selected by making a lightcurve with 16 s resolution of the dipping interval. Time intervals corresponding to PN count rates above and below 37 s-1 were then derived. Deep and shallow dip spectra were accumulated using these time intervals. The 2–10 keV count rates are 23 and 61 s-1 for exposures of 1047 and 480 s. In order to characterize the continua, the same blackbody and power-law model as in Sect. 3.2 with all spectral parameters allowed to vary was used to give values of 198.3 and 172.2 for 167 and 164 dof, for the shallow and deep dip spectra, respectively. It is well known that detailed modeling of the spectral changes during dips requires multiple components which undergo different amounts of absorption and covering (e.g., Church & Bałucińska-Church c:95 (1995)). However, the simple approach adopted here allows us to investigate the properties of any narrow absorption features present.
Fig. 4 shows the residual in the energy range 5.5–8.5 KeV obtained in this way for the shallow and deep dipping intervals. There is a great deal of spectral structure remaining. The shallow dip spectrum shows evidence for two deep features which may be modeled as absorption lines with energies of and keV (Table LABEL:tab:dips). The lower energy feature may be Fe xxv K resonant absorption, while the energy of the second feature does not correspond to that of any likely line or edge feature. The same two features are also present in the deep dip spectrum, together with an emission feature at keV. This may be the same Fe emission feature as seen in the persistent emission spectrum. The deep Fe xxvi K feature at 7.00 keV seen in the persistent emission spectrum may also be present in both dip spectra (see Fig. 4), but is much shallower than the feature identified with Fe xxv K. This suggests that during dipping the additional absorbing material is less strongly ionized than that responsible for the absorption features seen in the persistent emission. A detailed study of such features may allow the ionization state, velocity and temperatures of the material responsible for the dips to be probed.
| Shallow dipping | |||
|---|---|---|---|
| (keV) | … | ||
| EW (eV) | … | ||
| (eV) | … | ||
| Deep dipping | |||
| (keV) | |||
| EW (eV) | |||
| (eV) | |||
4 Discussion
Narrow X-ray absorption lines were first detected from the superluminal jet sources GRO J165540 (Ueda et al. u:98 (1998); Yamaoka et al. y:01 (2001)) and GRS 1915+105 (Kotani et al. k:00 (2000); Lee et al. l:02 (2002)). ASCA observations of GRO J165540 revealed the presence of absorption features due to Fe xxv and Fe xxvi which did not show any obvious dependence of their EWs on orbital phase. GRO J165540 has been observed to undergo deep absorption dips (Kuulkers et al. k:98 (1998)) consistent with observing the source at a high inclination angle of – (e.g., Frank et al. f:87 (1987)). ASCA observations of GRS 1915+105 revealed, in addition, absorption features due to Ca xx, Ni xxvii and Ni xxviii. A recent Chandra HETGS observation of this source revealed absorption edges of Fe, Si, Mg, and S as well as resonant absorption features from Fe xxv and Fe xxvi and possibly Ca xx (Lee et al. l:02 (2002)). Until recently, it was possible that these absorption features were peculiar to superluminal jet sources and related in some way to the jet formation mechanism. With the discovery of narrow absorption features from the LMXRBs GX 13+1 (Ueda et al. u:01 (2001)), MXB 1658298 (Sidoli et al. si:01 (2001)) and now X 1624490, this appears not to be the case, and as proposed by Kotani et al. (k:00 (2000)) ionized absorption features may be common characteristics of systems accreting via a disk.
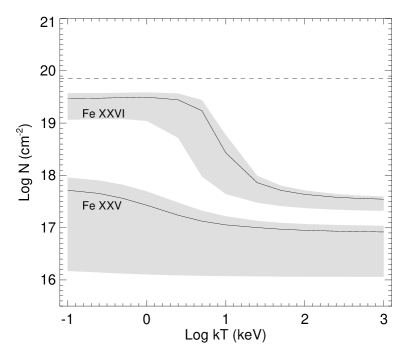
In order to estimate the column densities of Fe that produced the absorption lines observed in the persistent emission we performed a curve of growth analysis following that of Kotani et al. (k:00 (2000)). This allows the EWs of the lines to be converted into column densities depending on the kinematic temperature of the absorbing material. The kinematic temperature includes contributions from thermal motions as well as any bulk motions. An Fe abundance of was assumed (Anders & Grevesse a:89 (1989)). Fig. 5 shows the calculated columns for the Fe xxv and Fe xxvi features for a range of assumed temperatures. As expected, a lower kinematic temperature requires a higher ion column density, and hence a higher hydrogen column density. With the range of assumed temperatures, the derived Fe column densities are always less than the NH corresponding to one Thomson optical depth ( atom cm-2). Such a high column (shown as a horizontal line on Fig. 5) would result in the absorption lines being strongly diminished. Examination of Fig. 5 shows that the total Fe column density must be cm-2 for the range of assumed temperatures.
The total line EW observed from X 1624490 is a factor 3 lower than that observed from the eclipsing, dipping source MXB 1658298 by Sidoli et al. (s:01 (2001)) also using XMM-Newton. In addition, the ratio of H-like to He-like line EWs of 2.2 in X 1624490 is higher than in MXB 1658298 where a ratio of 1.3 was determined. This suggests that there is relatively more Fe xxvi than Fe xxv present in the absorber in X 1624490, compared to MXB 165829. There could be a number of reasons for these differences. (1) The overall metal abundance could be higher in MXB 1658298 than in X 1624490, resulting in deeper absorption features. (2) The geometries of the absorbing regions could be different, resulting in different fractions of scattered photons entering the line of sight. (3) As implied by the larger ratio of Fe xxvi to Fe xxv EW in X 1624490 compared to MXB 1658298 the ionization parameter of the absorbing system may be higher in this system and much of the Fe in the absorber may be fully ionized. (4) Since MXB 1658298 shows dips and eclipses, while X 1624490 only shows dips, it is possible that MXB 1658298 is viewed closer to the orbital plane than X 1624490. This could mean that the line of sight may pass through more material. It will be very interesting to obtain column densities of absorption features in other LMXRB (dip-)sources to investigate which of the above possibilities is true.
Asai et al. (a:00 (2000)) report on a spectral survey of Fe-K emission lines from 20 LMXRB with ASCA. Significant lines are detected from about half the sources. The mean line energy is keV with a full width half-maximum of 0.5 keV. Neither the line energy, EW nor width appear to depend on source luminosity or type. When the X 1624490 persistent emission PN spectrum is fit with a single Gaussian emission feature, the best-fit energy of keV is significantly below this mean value. However, when the two absorption features are included, then the best-fit energy of keV is fully consistent with the mean energy found by ASCA for the LMXRB sample. This difference well illustrates the dependence of derived spectral results on the chosen model. It also suggests that other LMXRB with Fe-line energies well below the average in the ASCA sample may exhibit absorption features. Examination of Table 5 of Asai et al. (a:00 (2000)) shows that the line observed from XB 1916053 has the lowest energy in the sample of keV. Interestingly, XB 1916053 is another dip source (White & Swank ws:82 (1982)), supporting the idea that the presence of absorption features may depend on viewing angle.
Acknowledgements.
Based on observations obtained with XMM-Newton, an ESA science mission with instruments and contributions directly funded by ESA member states and the USA (NASA). L. Boirin acknowledges an ESA Fellowship. We thank T. Kotani for making his curve of growth software available.References
- (1) Anders, E., & Grevesse, N. 1989, Geochimica et Cosmochimica Acta, 53, 197
- (2) Angelini, L., Parmar, A. N., & White, N. E. 1996, Proc. IAU Colloquim 163, ASP Conf. series, 121, 685
- (3) Asai, K., Dotani, T., Nagase, F., & Mitsuda, K. 2000, ApJS, 131, 571
- (4) Bałucińska-Church, M., Barnard, R., Church, M. J., & Smale, A. P. 2001, A&A, 378, 847
- (5) Bałucińska-Church, M., Humphrey, P. J., Church, M. J., & Parmar, A. N. 2000, A&A, 360, 583
- (6) Church, M. J., Bałucińska-Church, M. 1995, A&A, 300, 441
- (7) Christian, D. J., & Swank, J. H. 1997, ApJS, 109, 177
- (8) Cottam, J., Kahn, S. M., Brinkman, A. C., den Herder, J. W., & Erd, C. 2000, A&A, 365, L277
- (9) Frank, J., King, A. R., & Lasota, J.-P. 1987, A&A, 178, 137
- (10) Jansen, F., Lumb, D., Altieri, B., et al. 2001, A&A, 365, L1
- (11) Jones, M. H., & Watson, M. G. 1989, Proc. 23rd ESLAB Symposium on Two Topics in X-Ray Astronomy, eds. J. Hunt & N. Battrick, Bologna, ESA SP-296
- (12) Kotani, T., Ebisawa, K., Dotani, T., et al. ApJ, 2000, 539, 413
- (13) Kuulkers, E., Wijnards, R., Belloni, T., et al. 1998, ApJ, 494, 753
- (14) Lee, J. C., Reynolds, C. S., Remillard, R., et al. 2002, ApJ in press (astro-ph/0111132)
- (15) Morrison, D., & McCammon, D. 1983, ApJ, 270, 119
- (16) Parmar, A. N., & White, N. E. 1988, In: Pallavacini, R., & White, N. E. (eds.) X-ray Astronomy with EXOSAT. J. Italian Astr. Soc. 59, p. 147
- (17) Sidoli, L., Oosterbroek, T., Parmar, A. N., et al. 2001, A&A, 379, 540
- (18) Smale, A. P., Church, M. J., & Bałucińska-Church, M. 2001, ApJ, 550, 962
- (19) Strüder, L., Briel, U., Dennerl, K., et al. 2001, A&A, 365, L18
- (20) Turner, M. J. L., Abbey, A., Arnaud, M., et al. 2001, A&A, 365, L27
- (21) Ueda, Y., Inoue, H., Tanaka, Y., et al. 1998, ApJ, 492, 782
- (22) Ueda, Y., Asai, K., Yamaoka, K., Dotani, T., & Inoue, H. 2001, ApJ, 556, L87
- (23) White, N. E., & Swank, J. H., 1982, ApJ, 253, L61
- (24) White, N. E., Nagase, F., & Parmar, A. N., 1995, In: Lewin, W. H. G., van den Heuvel, E. P. J., van Paradijs, J. (eds.) X-ray Binaries. Cambridge Astrophysics Series, 26, p. 1
- (25) Yamaoka, K., Ueda, Y., Inoue, H., et al. 2001, PASJ, 53, 179