The Visibility of Galactic Bars and Spiral Structure At High Redshifts
Abstract
We investigate the visibility of galactic bars and spiral structure in the distant Universe by artificially redshifting 101 -band CCD images of local spiral galaxies from the Ohio State University Bright Spiral Galaxy Survey. These local galaxy images represent a much fairer statistical baseline than the galaxy atlas images from Frei et al. (1995), the most commonly used calibration sample for morphological work at high redshifts. Our artificially redshifted images correspond to Hubble Space Telescope -band observations of the local galaxy sample seen at , with integration times matching those of both the very deep Northern Hubble Deep Field data, and the much shallower Flanking Field observations. The expected visibility of galactic bars is probed in two ways: (1) using traditional visual classification, and (2) by charting the changing shape of the galaxy distribution in “Hubble space”, a quantitative two-parameter description of galactic structure that maps closely on to Hubble’s original tuning fork. Both analyses suggest that over 2/3 of strongly barred luminous local spirals (i.e. objects classified as SB in the Third Reference Catalog) would still be classified as strongly barred at in the Hubble Deep Field data. Under the same conditions, most weakly barred spirals (classified SAB in the Third Reference Catalog) would be classified as regular spirals. The corresponding visibility of spiral structure is assessed visually, by comparing luminosity classifications for the artificially redshifted sample with the corresponding luminosity classifications from the Revised Shapley Ames Catalog. We find that for exposures times similar to that of the Hubble Deep Field spiral structure should be detectable in most luminous () low-inclination spiral galaxies at in which it is present. However, obvious spiral structure is only detectable in % of comparable galaxies in the HDF Flanking Field data using WF/PC2. Our study of artificially redshifted local galaxy images suggests that, when viewed at similar resolution, noise level and redshift-corrected wavelength, barred spirals are less common at z than they are at z = 0.0, although more data are needed to definitively rule out the possibility that cosmic variance is responsible for much of this effect.
Draft version
1 INTRODUCTION
The Hubble Space Telescope has, for the first time, allowed the direct study of galaxies as they appeared when the Universe was much younger than it is at the present time. Inspection of the images of such distant galaxies shows that the Hubble tuning fork diagram does not provide an adequate framework for the classification of distant galaxies (van den Bergh et al. 1996) and that the fraction of peculiar and merging galaxies increases with redshift (Abraham et al. 1996). Around of luminous galaxies lie off Hubble’s tuning fork at (Brinchmann et al. 1998). A number of studies have also claimed that the percentage of barred spirals seems to decrease towards larger look-back times (van den Bergh et al. 1996; Abraham et al. 1999). This trend has been based on the results from objective, but rather coarse-grained, automated morphological classifications. More fine-grained “precision morphology” (which can subdivide spiral galaxies into various classes, for example) still requires a trained human eye. On this basis van den Bergh et al. (2000) and van den Bergh, Cohen & Crabbe (2001) note that the fraction of “grand design” spirals appears to decrease rapidly with increasing redshift. It is important to emphasize that these studies focus mainly on galaxies at redshifts , so that systematic changes in galaxy appearance due to shifting of the filter bandpass in the rest frame of the galaxy are easily understood. For example, at , HST imaging using the F814W filter corresponds quite closely to -band imaging in the rest frame of the galaxy.
However, an alternative interpretation of the absence of barred and grand design spirals at high redshifts is that the features that define these categories of objects locally are undetectable outside of the nearby Universe. The visibility of these features at high redshifts has been poorly understood because of the absence of a suitable CCD imaging sample of representative local galaxies. Such samples can be used to test the visibility of fine structures in galaxies by “artificial redshifting”, in which images are binned and noise added in order to mimic the appearance of high-redshift counterparts. In the present paper we will adopt this strategy using a new sample of local galaxy images taken from the Ohio State University Bright Spiral Galaxy Survey (Frogel, Quillen & Pogge 1996). This sample provides a more statistically fair representation of the local morphological mix than other samples used to calibrate high-redshift morphology by artificial redshifting.
In the present paper we quantify the systematic effects of decreasing resolution (and of increasing noise) on the visibility of galactic bars and grand design spiral structure using a mixture of techniques. Where possible, we will back up traditional visual classifications using quantitative measures. A useful tool in this regard is what Abraham & Merrifield (2000) have dubbed “Hubble space”, a quantitative two-parameter description of galactic structure that maps closely on to Hubble’s original tuning fork. When no suitable quantitative measure exists, as for describing the existence of grand design spiral structure, we unapologetically adopt a purely visual approach.
A plan for this paper follows. In §2 we describe our sample, and highlight its advantages (and deficiencies) when it is used to calibrate morphology at intermediate redshifts of around . In §3 we revisit the visual classifications for the galaxies in the sample, and compare the classifications used in the present paper with those from existing catalogs. In §4 we introduce the Hubble space diagram for our sample. In §5 we describe our artificially redshifted sample, and analyze the robustness of various features in the galaxy images using both visual classifications and quantitative measures. The visibility of grand design spiral structure is analyzed in §6. Our results are discussed in §7, and our conclusions summarized in §8. Finally, we note that throughout the present paper we adopt a cosmology where , , and .
2 THE OSU BRIGHT SPIRAL GALAXY SURVEY
Our data set consists of 101 -band images of galaxies taken from the Ohio State University Bright Spiral Galaxy Survey (BSGS; Frogel, Quillen, & Pogge 1996; Eskridge et al., in preparation). The BSGS is a survey consisting of images for 205 objects selected from the Third Reference Catalog of Bright Galaxies (RC3; de Vaucouleurs et al. 1991). Our sub-sample of these data consists of all -band images that were available at the time of writing. The BSGS is constructed from the RC3 on the basis of three simple criteria: (1) no E or S0 galaxies are included; (2) mag; (3) galaxy diameter 6.5′. The reader is referred to Frogel, Quillen & Pogge (1996) for details. The diameter limit imposed on the sample was intended to ensure that all galaxies fit on the various detectors used, and is relatively unimportant as 95% of the mag spiral galaxies in the RC3 are imaged in the BSGS.
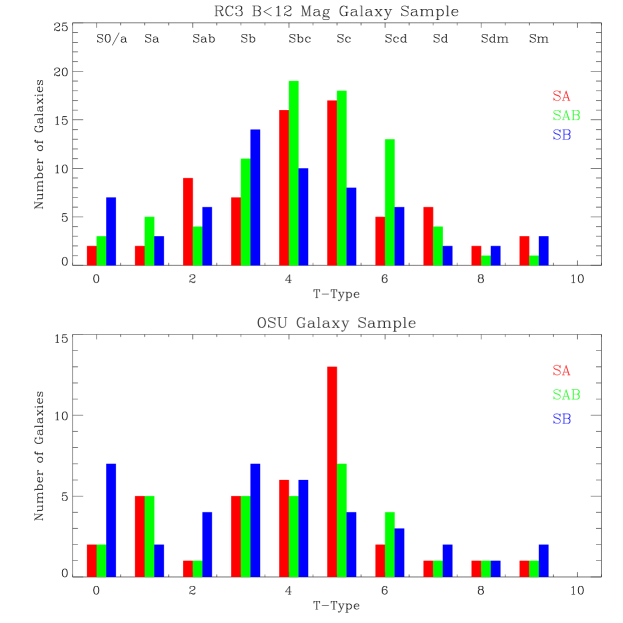
It is important to consider whether any important biases are introduced by restricting our consideration to a subset of the full BSGS in this manner (we re-emphasize that since the BSGS survey as a whole is 95% complete, the full survey has no important biases with respect to the RC3 selection criteria). In Figure 1 we present histograms showing the frequency of the barred and regular spirals in our sample of 101 galaxies from the BSGS as a function of Hubble stage, and compare these with the corresponding histograms for the full RC3 cut at the same limiting magnitude as the BSGS. Note that in this figure (and throughout the remainder of this paper), we will adopt the terminology of the RC3 which denotes strongly barred spirals as class SB (shown in blue), weakly/tentatively barred systems as class SAB (shown in green), and unbarred spirals as class SA (shown in red)111Note that in the standard encoding from the RC3 given column 2 of Table 1, SAB spirals are encoded as type SX.. A Kolmogorov-Smirnov test confirms the visual impression from this figure that the morphological mix of galaxies in our BSGS sub-sample is statistically similar to that of the full RC3 cut at mag. (The Kolmogorov-Smirnov test returns a formal 33% probability that the AB or B distributions differ, and a 60% probability that the A galaxy distributions differ).
It is interesting to compare Figure 1 with the corresponding histograms for the sample of Frei et al. (1996), which has been used by many authors (including several of the co-authors of this paper) to calibrate the expected appearance of high-redshift galaxies. These are shown in Figure 1 of Abraham & Merrifield (2000). The Frei et al. (1996) sample is quite strongly biased against both Sa spirals and very late-type spirals (Sd and beyond); near the endpoints of the tuning fork, some early and late type spirals are included in the Frei et al. (1996) sample, but with some bar classes missing. For example, strongly barred SBab galaxies are absent from the sample, while all Scd galaxies in the sample are weakly barred SABcd systems. In contrast, the present BSGS sample is a much less biased representation of the local morphological mix for luminous galaxies.
While we consider the present local galaxy CCD imaging sample a major step forward, it is important to note that in some ways this sample is still far from ideal for use in calibrating galaxy morphology at , as indeed are all magnitude-limited samples of bright galaxies. This is clear from Figure 2 which shows the -band absolute magnitude distribution for galaxies in the BSGS, along with a Schechter function empirically normalized to the bright shoulder of the distribution. As expected from a magnitude-limited sample, the absolute magnitude distribution for galaxies in BSGS is peaked at and drops off sharply at both the bright and faint ends. At the filter on HST is roughly synchronized to rest-frame -band, so the effects of “morphological K-corrections” are small, and -band local images are well-matched to -band HST data. Therefore, on figure 2 we also show dashed lines which indicate the absolute magnitude limits corresponding to mag, the magnitude limit adopted for morphological classification in the Medium Deep Survey (Griffiths et al. 1994; Glazebrook et al. 1995; Abraham et al. 1996), and mag, the magnitude limit corresponding to the bar visibility study of Abraham et al. (1999). On the basis of this figure, it is clear that: (i) the BSGS is reasonably well-matched to shallow (several orbit) HST imaging observations, such as those of the Medium Deep Survey (MDS), the Hawaii Deep Survey (HDS), and the CFRS/LDSS imaging surveys, but (ii) deep HST observations, such as those in the Hubble Deep Fields, will probe much further down the luminosity function than the galaxies represented in the BSGS. This is true even in the no-evolution case, but ultimately how far down the LF we look depends critically on the amount of luminosity evolution. With strong evolution we can of course probe distant galaxies that would have been quite faint in the absence of luminosity evolution. The implications of this will be considered in Section 7.
3 VISUAL CLASSIFICATIONS
In order to allow a consistent comparison between the artificially redshifted morphologies of the galaxies in our sample and their local morphologies, one of us (vdB) visually reclassified the local galaxy sample using the DDO system of van den Bergh (1960abc). Results from this procedure are shown in Table 1 (along with the classifications obtained from repeating this exercise with artificially redshifted and noise-degraded galaxy images, the results from which will be described in §5). Hubble types are available for 91 of the galaxies in our sample from the Carnegie Atlas of Galaxies (Sandage & Bedke 1994). A comparison between our classifications and those in the Carnegie Atlas shows excellent agreement. The standard deviation of the differences between the Hubble types in these two data sets is (after uncertain classifications, marked in Table 1 by a colon, have been excluded) 0.41 Hubble class. The mean difference between Hubble classification types for these two sets of data is found to be 0.00 +/- 0.04 Hubble class. The overall fraction of barred galaxies in both samples are also in good agreement, as shown in Table 2222Note that Sandage does not use de Vaucouleurs’ notation SAB for weak bars, but uses the designation S/SB for objects of intermediate type. In Table 2 the amalgamation of vdB types S(B) and SB should be compared with Sandage’s numbers for type SB. We note that the fraction of barred galaxies in the RC3 is in good agreement with the corresponding value determined independently for the BSGS by Eskridge et al. (2000).
Gratifyingly good agreement is also found between the present luminosity classifications of galaxies and those by Sandage & Tammann (1981). These are also listed in Table 1. (Note that the quoted Carnegie classifications are simplified: outer rings are not marked, ring (r) and spiral (s) subclasses are omitted, and luminosity classes are simplified, i.e. Sandage & Tammann’s class I.7 is quoted as I-II). After excluding objects with uncertain classifications, 43 pairs of luminosity classifications were available. The standard deviation of the difference between these classifications was found to be luminosity classes. The mean difference, in the sense van den Bergh minus Carnegie, is luminosity classes, indicating that the Sandage & Tammann (1981) luminosity classes are very close to the DDO system of van den Bergh (1960abc).
4 CORRELATIONS IN LOCAL HUBBLE SPACE
Using the sample of Frei et al. (1996), Abraham & Merrifield (2000) defined a quantitative two-dimensional morphological parameterization (“Hubble space”) whose -coordinate measures central concentration of light, and whose -coordinate measures the degree to which a galaxy is barred in a quantitative way. A remarkably large amount of information concerning the properties of local galaxies can be inferred from a close inspection of Hubble space (Whyte et al., in preparation), but for our present purposes its most important characteristic is that it provides a convenient benchmark allowing us to understand how the systematics of galaxy morphology vary as a function of resolution and signal-to-noise ratio. In this section we will describe the basic features of the local galaxy distribution in Hubble space, before moving on to describe how these properties change when our galaxy sample is artificially redshifted to z=0.7.
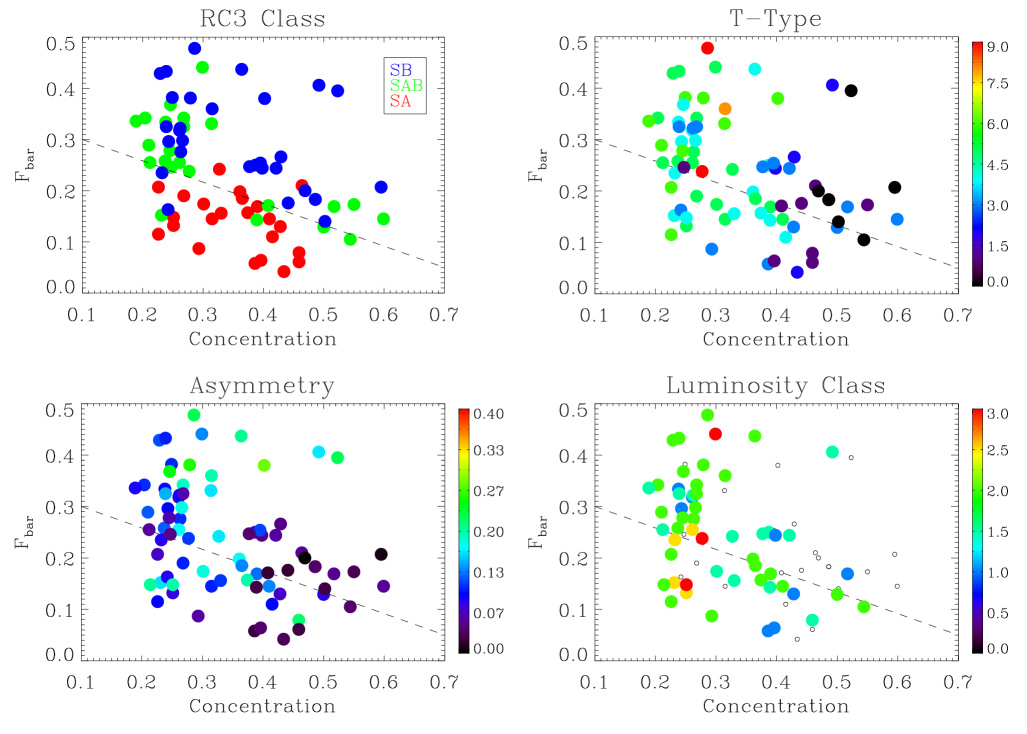
The distribution of the present BSGS sample in Hubble space is shown in Figure 3. In the top-left panel of this figure, colored symbols keyed to the scheme used in Figure 1 are used to subdivide the galaxy population into bar types, based on classifications from the RC3. The dashed line shown in the figure subdivides barred from unbarred galaxies extremely cleanly. As was found for the Frei et al. (1996) sample analyzed in Abraham & Merrifield (2000), there is essentially no intermixing of unbarred galaxies and strongly barred galaxies in Hubble space, and weakly barred spirals are seen to be predominantly late-type (ie. low central concentration). However, unlike the corresponding figure for the Frei et al. (1996) sample no obvious “tuning fork” shape (or even bimodality) emerges from this diagram.
In the top right panel of Figure 3 we show the same galaxies distribution in Hubble space, except with the symbols keyed to Hubble stage. This panel shows the obvious gradient in Hubble stage as a function of central concentration rather strikingly. This illustrates why Hubble space is a successful representation of the local galaxy data — measures of central concentration are clearly rather closely linked to Hubble stage. However, this panel provides a warning against basing morphological classifications of distant galaxy images solely on perceived central concentration or bulge-to-disk ratio (Abraham 1999). The mixed criteria (bulge-to-disk ratio, tightness of spiral structure, and degree of resolution in the arms) used to define visual classifications on the classical tuning fork make distinguishing between various types later than T=5 impossible on the basis of central concentration of light. This is in accord with the general “rule of thumb” that central concentration is only used as a classification criterion for objects of early and intermediate-type. Late types are generally seen with open enough arms that an adequate classification can be made without invoking any visual bulge-to-disk ratio criterion.
The distribution of galaxies in Hubble space keyed to rotational asymmetry (determined using the method given in Abraham et al. 1996) is shown in the lower left panel of Figure 3. It is interesting that SB galaxies appear to be made up of two populations: a tight sequence of symmetric objects and an outlier population of highly asymmetric galaxies. Furthermore, a hint of bimodality (whose reality will be interesting to test once the full BSGS data becomes available) appears in the plot when consideration is restricted to galaxies with a high degree of symmetry. Our tentative explanation for the tuning fork shape seen in the Hubble space distributions of Abraham & Merrifield (2000) is that the galaxies in the Frei et al. (1996) sample were chosen to be visually “pretty”, and it seems this may be correlated with low asymmetry. In this connection it is interesting to compare measurements of rotational asymmetry with more traditional visual methods for characterizing textural aspects of galaxy structure. In the lower right hand panel of Figure 3 we show BSGS Hubble space distribution keyed to luminosity classification. For convenience, luminosity classes have been mapped onto a numerical sequence (eg. type I = 1.0, II-III = 2.5, etc.). Galaxies with no luminosity classifications are shown as small black circles.
Most spirals in our sample are of luminosity class II. Because rotational asymmetry is measured by summing pixel-by-pixel differences, “ragged” spiral structure might be expected to slightly increase measured rotational asymmetry, although the effect is probably very small. In this connection it is interesting to compare measures of asymmetry and luminosity classification. A comparison between the lower two panels shows that luminosity and asymmetry are only very loosely correlated. Note however that luminosity classifications can only be applied to a subset of all systems in our sample. This is mainly because luminosity classifications are not defined for early-type spirals, because the spiral features in these objects are too short. Another factor is more subtle. For luminosity classes I-III most of the weight in the classification comes from the strength and structure of the spiral arms. However, in classes III-V most of the weight comes from surface brightness, with the dwarfs having the lowest surface brightness. On Palomar Sky Survey plates all images have similar exposure times so that the apparent surface brightness is related to the intrinsic surface brightness, and consistent luminosity classifications may be assigned to bulk samples of galaxies. However, this is not the case for the present images. As a result it is, on the basis of our present images, very difficult to assign luminosity classes to spirals of classes III-V. In practice this is not be much of a problem because most spirals in the our sample are intrinsically luminous.
5 ARTIFICIALLY REDSHIFTED IMAGES
Simulated z=0.7 -band HST images (corresponding to rest-frame -band) for the 101 galaxies in our sample were constructed using the techniques described in Abraham et al. (1996). Two sets of synthetic images were constructed, mimicking the exposure time and sampling of the -band image of the Northern Hubble Deep Field (123600s exposure with 0.04″/pixel), and of a typical flanking field image (4000s exposure, 0.1″/pixel). Parameters defining Hubble space were re-measured from these degraded frames, which were also visually classified onto the DDO system by vdB. The images were given a final visual inspection by one of us (RGA), who assigned a simple numerical index to each image denoting the visibility of spiral structure, as described in §6. For the synthetic Hubble Deep Field images, visual inspections were limited to mag, corresponding to the magnitude limit typically used by investigators working on galaxy morphology in the HDF. Similarly, visual inspection of the synthetic flanking field data was limited to mag. A summary of our results for the simulated HDF and FF data is included in Table 1. Classifications in the simulated Flanking Field images have been limited to mag (corresponding to the typical magnitude limit from the Medium Deep Survey data).
5.1 Robustness of Visual Classifications
Results from the visual classification of the present sample are tabulated in Table 2, which shows a comparison between our local bar strength classifications and those at for both the HDF signal-to-noise ratio and for the FF signal-to-noise. The table shows the following: (1) The fraction of SB + S(B) galaxies is 28% for both the Sandage & Tammann (1981) classifications in the Carnegie Atlas and in van den Bergh’s classifications of the BSGS galaxies at . If the resolution of images is degraded to that of Hubble Deep Field galaxies at then the fraction of SB + S(B) galaxies that can still be recognized as such drops from 28% to 19%. (3) At first sight it might be unexpected that the fraction of SB + S(B) galaxies that can still be recognized as such remains constant at 19% when the signal-to-noise ratio is decreased to that in the Flanking Fields, The reason for this is probably that the FF galaxies ,which all have are brighter than the HDF galaxies, for which . In summary the main result obtained from Table 2 is that roughly 2/3 of strongly barred galaxies will still be recognizable as such at z = 0.7. For weakly barred galaxies the fraction of recognizable bars drops from 17% at to % at for HDF S/N and % for FF S/N.
Among the 101 local spiral galaxies with images degraded to z = 0.7 that are listed in Table 1, 81 are of type S, 12 of type S(B) S(B:) or S(B?) and are 8 of type SB. For comparison van den Bergh, et al. (2000) found only S galaxies and no objects of types S(B) or SB among 18 comparable HDF spirals with . Taken at face value this result appears to confirm the conclusion by van den Bergh et al. (1996) that barred spirals are deficient at large redshifts. Among the local spirals listed in Table 2, a total of 63 have and may therefore be compared to those in the Flanking Fields for which van den Bergh et al. (2000) have given classifications. Of the galaxies in Table 2 that have , 51 are found to be of type S, 7 of type S(B) and 5 of type SB. For comparison the numbers of comparable spirals in the Flanking Fields with are found to be 42 of type S, 2 of type S(B) and 0 of type SB. It is concluded that at comparable resolution and noise the fraction of barred spirals in the Flanking Fields (2/44 = 5%) appears to be lower than it is among nearby galaxies (12/63 = 19%).
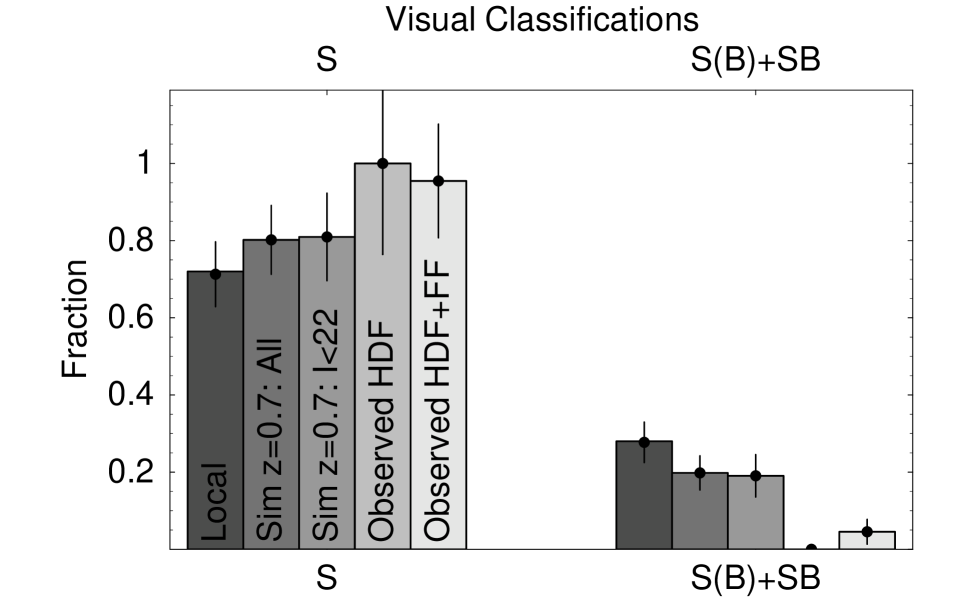
A graphical summary of the results presented in this section is shown in Figure 4. This figure also sheds some light on the statistical significance of claims for an absence of bars in the Hubble Deep Field observations. The relative bar fractions determined from the artificially redshifted and observed samples suggests that the absence of high-redshift bars is formally at least a 2 effect. However, as described in the §7, it is wise to remain cautious given the small volume of the Hubble Deep Fields, and the possibility of environmental effects that might skew the relative abundance of barred spirals as a function of environment.
Before leaving visual classifications (which we will return to in §6) to consider their automated counterparts in the next section, it is worth emphasising a final point: when spiral structure is not visible in a high-redshift galaxy, the system is not usually classified as a peculiar galaxy on this basis by experienced morphologists (although a local disk galaxy without spiral arms would probably be classed as peculiar, or at least anemic). This is because spiral structure washes away at low signal-to-noise levels while the nuclear bulge and disk do not. Therefore such systems are still classified as a spiral galaxies (in spite of the absence of spiral structure) whose Hubble stage is determined solely on the basis of apparent bulge-to-disk ratio. The ramifications of this for both visual and automated classification are described in Abraham (1999). It is also worth emphasizing that in classification of galaxies on deep HST data, such as the the Hubble Deep Field, van den Bergh denotes objects as “peculiar” only when they are not recognizable as disk or spheroid systems at all (e.g. when they have multiple nuclei and gross distortions). In most cases a recognizable disk exhibiting peculiarity does so at a level where the distortion is best viewed as a perturbation superposed on a well-known galaxy form. Such systems are sub-classed as peculiar, not super-classed as peculiar. For example, an early-type disk galaxy with a warp might be classed “Sa (pec)”, but not as “pec”. The distinction between an object sub-classed as peculiar, and an object so peculiar that no association with a disk or spheroid is possible, is somewhat subjective at present. It would be worthwhile for this distinction to be placed on a more rigorous footing using objective/quantitative classifications in future.
5.2 Robustness of Hubble Space
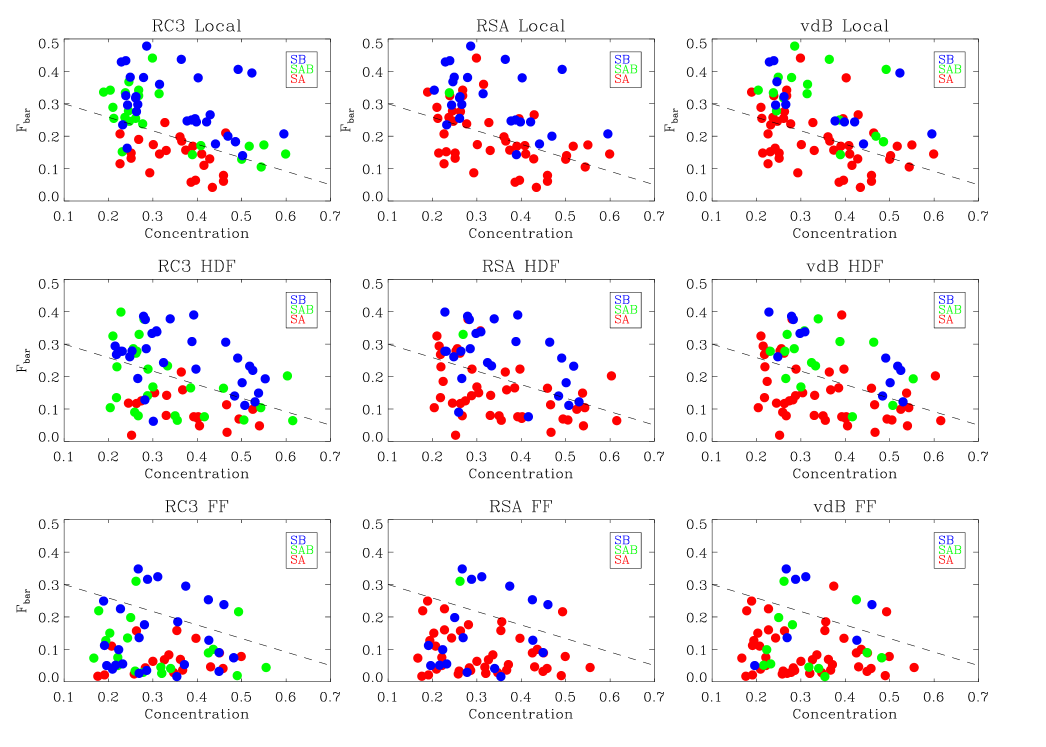
The sensitivity of the Hubble space distribution to increasing noise and decreasing resolution is shown in Figure 5. The top row of this figure illustrates local Hubble space with plot symbols keyed to the bar classifications from the RC3 (left panel), the Revised Shapley Ames Catalog (middle panel), and visual inspection by van den Bergh (right panel). A comparison of the local bar classifications reveals a number of interesting trends. Firstly, as noted earlier, a simple cut in this parameter space isolates barred from unbarred spirals as classified in the RC3. A comparison between the RC3 and RSA panels shows a generally excellent agreement between the catalogs in the numbers of strongly barred spirals. An independent visual inspection by Eskridge et al. (2000) also results in close agreement with the numbers in the RC3. Note however the lack of systems classed as weakly barred in the RSA — weakly barred systems in the RC3 are generally classed as unbarred in the RSA, although virtually all such objects lie above the dashed line in the diagram (our proposed quantitative discriminator between barred and unbarred galaxies). This is a rather pleasing graphical demonstration of the fairly well-known fact (Binney & Merrifield 1998) that the proportion of barred spirals in local catalogs varies between % and %, and highlights the subjective nature of assigning concrete classifications to systems in which a continuum of properties exists. Even more striking evidence of this is the rightmost panel, which shows that van den Bergh’s criteria for classification as an SB galaxy are much stricter than those of the RSA. As described in the previous section, and is shown in Table 2, many systems classified as SB in the RC3 and RSA are classified as weakly barred S(B) galaxies by van den Bergh.
The middle row of Figure 5 shows the Hubble space distribution for galaxies degraded to the conditions in the Northern Hubble Deep Field, with plot symbols color-coded according to their original classifications in the local images (ie. to the classifications shown in the top set of panels). Over 90% of galaxies originally classified as SB remain above the dashed line, and these galaxies would thus also be classified as strongly barred in the Hubble Deep Field using the methodology of Abraham et al. (1999). While almost none of the spirals classified as S(B) by van den Bergh would be misclassified as regular spirals in the HDF, around half of the weakly barred (SAB) systems from the RC3 have migrated to the unbarred portion of the Hubble space diagram. These weakly barred objects would have been classified as unbarred by the Abraham et al. (1999) HDF study. We conclude that, on the whole, the bars in strongly barred spirals (i.e. those systems classified SB in the RSA and RC3, and as SB or S(B) by van den Bergh in the present study), would remain visible in galaxies at observed under the conditions of the central Hubble Deep Field.
The situation for shallower observations is less sanguine. The bottom row of Figure 5 shows the Hubble space distribution for mag galaxies degraded to the signal-to-noise and resolution of the HDF Flanking Field observations. It is clear that in data of this quality (ie. two-orbit exposures) only around 40% of strongly barred local spirals (at mag) would be classified as strongly barred at z=0.7, in good agreement with the results obtained by visual inspection summarized in Table 2.
6 LUMINOSITY CLASSIFICATION AND GRAND DESIGN SPIRALS
Luminosity classification of spiral galaxies (van den Bergh 1960abc) is intrinsically more challenging than is the assignment of Hubble types. Because the fine details of spiral structure are both smaller and of lower surface brightness than bars, assignment of luminosity classes is also more difficult than bar-strength classification. One would expect that only the strongest and most extended spiral features will remain visible in degraded images, i.e. only “grand design” spirals are expected to be recognizable on noisy degraded images. Inspection of Table 1 shows that 27 local spirals have both luminosity classifications by Sandage and luminosity classifications by van den Bergh in images degraded to HDF quality. It is encouraging to see that these two sets of luminosity classifications exhibit no statistically significant systematic difference: the standard deviation of the differences between the Sandage and van den Bergh classifications is found to be only 0.6 luminosity classes. Not unexpectedly the fraction (9/26 = 35%) of spirals to which uncertain (marked as :) luminosity classifications were assigned is greater for the high-noise images in Table 2 than it is the fraction of uncertain luminosity classifications (3/27 = 11%) for the lower noise images listed in Table 1. Since only three HDF spirals are known to have 0. [see Table 2 of van den Bergh et al. 2000) it is not yet possible to establish if the fraction of grand design spirals is lower in situ at than it is for the present sample of local spirals with images degraded to the appearance that they would have at z = 0.70.
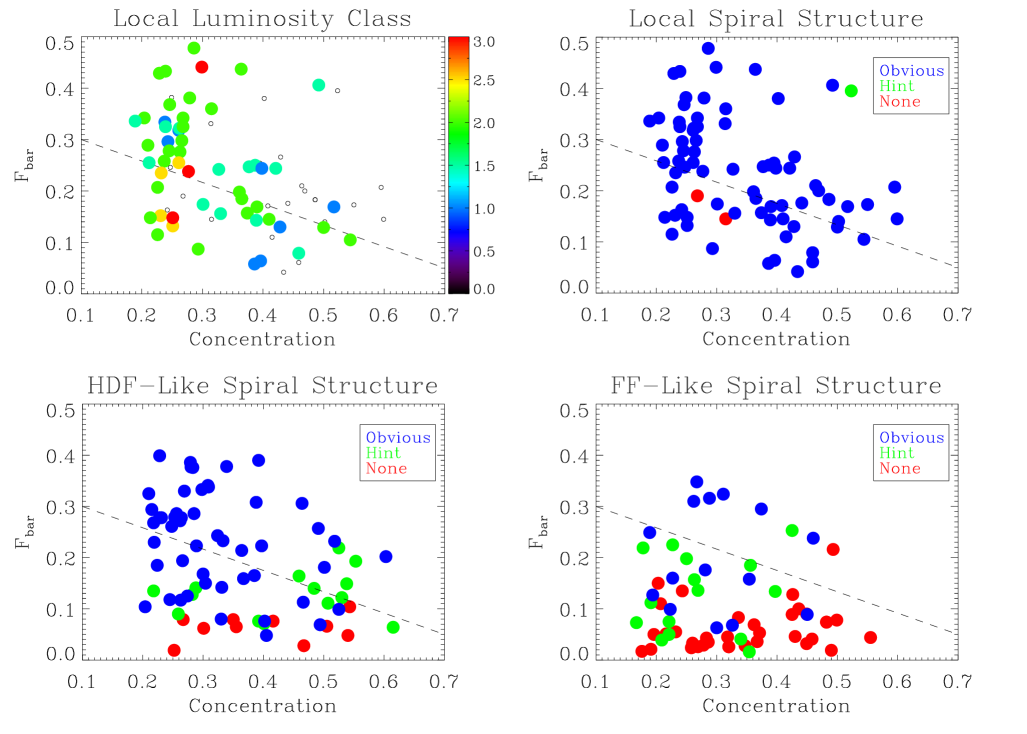
Since, as described earlier, luminosity classes cannot be assigned to all spiral galaxies in which spiral structure is visible (e.g. early-type spirals), and since arms may still be visible in galaxies with insufficient signal to allow a reliable luminosity classification, it is interesting to consider what fraction of galaxies at would show spiral features of any sort. In an attempt to determine this, one of us (RGA) visually inspected the complete set of local and degraded images and assigned each galaxy a numerical index (0=spiral structure is invisible, 1=hint of weak structure, 2=obvious spirals structure) corresponding to qualitative visibility of spiral features. These numbers are included in Table 1, and Hubble space plots summarizing the change in the visibility of spiral structure with redshift and noise are shown in Figure 6. In our local sample 97% of galaxies showed “obvious” spiral structure. Under the conditions of the central HDF observations obvious spiral structure is still seen in most (61%) galaxies at , with 82% showing at least a hint of structure. However, in the conditions corresponding to the HDF flanking field observations only a minority (33%) of spiral galaxies now show obvious spiral structure, with 55% showing at least a hint of structure. Once again, we conclude that the deep central HDF observations allow quite robust conclusions to be drawn regarding galaxy morphology at , but that detailed morphological classifications (i.e. those more detailed than crude Hubble types) in the Flanking Fields should be treated with caution.
7 DISCUSSION
It is now commonly accepted that a large fraction of the galaxy population seen at large redshifts does not appear to fit comfortably with the tuning fork classification scheme that provides a satisfactory framework for the classification of low-redshift galaxies in the -band. While it seems likely that many of these peculiar galaxies are not isolated disk systems, the present paper does shed some light on the subset of high-redshift spirals classified as peculiar. (Since the BSGS sample is selected from galaxies with Hubble stages in the range , it does not include systems classed as irregular or unclassifiable, and therefore the BSGS is not suitable for quantifying the proportion of non-spiral peculiars in deep images). Among the 101 BSGC galaxies, which are located at , 12 (12%) are classified as being peculiar on images degraded to with HDF resolution and signal-to- noise ratio. For comparison, the data by van den Bergh et al. (2000) for HDF + FF spiral/disk galaxies at show that 17 out of 37 (46%) are classified as peculiar. In other words approximately half of all spiral galaxies at look-back times of Gyr do not fit well into the Hubble classification system. Furthermore, van den Bergh et al. (2000) shows that early-type galaxies are less likely to be peculiar than is the case for objects of later type. Only 1/22 (5%) of E-Sa-Sab galaxies are classified as peculiar, whereas 11/16 (69%) of Sb-Sbc galaxies are so classified. The majority of “Sc” galaxies at are so peculiar that many of them have probably been called proto-Sc, Pec or “?”. In other words it looks like most compact early-type galaxies started to approach their “normal” present-day morphology faster than was the case for more extended objects of later morphological types. A caveat is, however, that it might be more difficult to recognize peculiarities in compact images of early-type galaxies than it would be to see such anomalies in the more open structure of late-type galaxies.
Our numerical experiments have given us some insight into the proportion of normal spirals which might be misclassified as peculiar due to noise and sampling. However, on the basis of Figure 2, we are more cautious about using these simulations to say very much about the relative space densities of different classes of spirals seen in deep images. It might be argued that a luminosity function peaked at is a generic consequence of sampling a Shecheter function affected by Malmquist bias, so the overall shape of the luminosity distribution for the local galaxies in Figure 2 is also generically similar to what one also expects from a deep HST imaging campaign (in the absence of strong field galaxy evolution). However, the shape of this distribution is largely due to the absence of intrinsically faint galaxies at high redshifts, and the distribution of absolute magnitudes within a narrow redshift shell may look quite different from the absolute magnitude distribution for the sample as a whole. Since morphology is a strong function of rest wavelength, it is likely that any morphology-based campaign would isolate galaxies in redshift shells in order to construct fair samples to compare with local calibration data (eg. van den Bergh 2000). Clearly then, for the specific purpose of calibrating the mix of different types of spirals fixed to a narrow redshift shell, an ideal local comparison sample should be drawn from an enormous parent population using a Schechter function-shaped distribution. We hope the sheer number of galaxies imaged by the Sloan Digital Sky Survey will soon make this possible, and at that point an extensive comparison between low-z and high-z Hubble space distributions will become straightforward.
In the meantime, we emphasize that our goals in the present paper are much more limited. Our main goal is to determine the extent to which a typical local spiral galaxy is likely to be misclassified at high redshift (or, equivalently, how far a galaxy situated at a particular position in local Hubble space is likely to shift by ). For this purpose, Figure 2 is less important than Figure 1, and the incompleteness of our BSGS sample at the faint end relative to the numbers expected from sampling a Schechter function-shaped distribution is not important so long as there are enough low-luminosity galaxies with a mix of morphological types in our sample to allow us to gauge how much a typical low-luminosity spiral is likely to move in a Hubble space diagram as a function of resolution and signal-to-noise. For example, since there are 28 galaxies fainter than in the subset of the BSGS analyzed in this paper, and since of the SB subset of these would be classified SB at in the HDF, we think it very unlikely that either low signal-to-noise or resolution effects can explain the apparent absence of barred spirals in the HDF data.
Even after the numerical experiments described in this paper we do remain concerned that cosmic variance might be the true explanation of the perceived absence of barred spirals at high redshifts. There is no known environmental dependence of bar strength on local galaxy density, though this possible dependence has not yet been definitively explored, and this is clearly a topic worthy of future study. It is conceivable that spirals in clusters might exhibit quite different distributions bar strengths due to numerous factors which might heat disks and supress bar instabilities, such as tidal harrassment (Moore et al. 1996) or gas stripping (Abraham et al. 1996). Furthremore, the volume encompassed to in HDF-like observation is tiny. Assuming the non-evolving local luminosity function given by Gardner et al. (1997), only around 30 galaxies (of all morphological types, and with a range of inclinations) are expected to be visible (and, in fact, about this number is seen) in the redshift range in an HDF image. About 10 of these should be in the redshift range . (In fact, only 3 spirals in this redshift range are seen in the Northern HDF). Even after adding together both Hubble Deep Fields, the numbers remain appallingly low for addressing a topic as important as the possible disappearance of bars; clearly more data are needed in order to conclusively rule out the possibility that cosmic variance could explain the absence of barred spirals in the Hubble Deep Fields .
8 CONCLUSIONS
.
In this paper we have studied the effects of image degradation on galaxy classification by (1) lowering resolution and by (2) increasing noise. Images were studied at both the noise level of the deep Hubble Deep Field images and at that of the shallower Flanking Field images. From comparison of the images of an unbiased sample of local (z = 0.0) galaxies, with those of the same galaxies degraded to the appearance that they would have at z = 0.7, it is found that about of all SB galaxies are still classified as SB or S(B) at the resolution and noise level of the Hubble Deep Field, dropping to around 50% in the flanking fields. Image degradation can account for some, but not all, of the observed (van den Bergh et al. 1996, Abraham et al. 1999) decrease in the fraction of SB galaxies with increasing redshift. Since luminosity classification is more challenging than determination of Hubble type it is not surprising that only a fraction of the degraded images could be assigned DDO luminosity classifications. It is, however, of interest to note that the luminosity classifications that could be made on degraded images agree well with those made on the original full- resolution noise-free images. We conclude that the fraction of grand design spirals appears to decrease with increasing redshift, although the number of galaxies observed at suitable signal-to-noise levels remains small and more observations are needed to better establish the demise of grand design spirals with redshift.
On the basis of our simulations, it is clear that when local spiral galaxies are viewed at comparable resolution and noise levels to the HDF data, these systems are not systematically misclassified as peculiar. This lends credence to the notion that the fraction of peculiar disk galaxies is dramatically higher at than it is at . In the study by van den Bergh et al. (2000) for HDF + FF galaxies at , 17 out of 37 (46%) spirals are classified as peculiar. In other words approximately half of all disk galaxies at look-back times of Gyr do not fit well into the Hubble classification system. This can be compared to the only 12% of artificially redshifted Sb+Sbc+Sc galaxies classified as peculiar in the present sample viewed at the same resolution and noise level. Among early-type spirals, the fraction of peculiars increases more slowly with redshift. These results suggest that (1) the fraction of intrinsically peculiar disk galaxies grows dramatically with increasing look- back time, and (2) the fraction of peculiar galaxies at is much larger among late-type galaxies than it is among early-type spirals. It seems that late-type spirals approach their “normal” morphology more slowly than do galaxies of early type.
References
- (1) Abraham, R. G., Valdes, F., Yee, H. K. C. & van den Bergh, S. 1994, ApJ, 432, 75
- (2) Abraham, R. G., Tanvir, N. R., Santiago, B. X., Ellis, R. S., Glazebrook, K., van den Bergh, S. 1996a, MNRAS, 279, L47
- (3) Abraham, R. G., van den Bergh, S., Ellis, R. S., Glazebrook, K., Santiago, B. X., Griffiths, R. E., Surma, P. 1996b, ApJS, 107, 1
- (4) Abraham, R. G., Merrifield, M. R., Ellis, R. S., Tanvir, N. R., & Brinchmann, J. 1999. MNRAS, 308, 569.
- (5) Abraham,R.G. 1999, Ap. Space Sci., 269-270,323
- (6) Ashman, K., Bird, C., & Zepf, S. 1994. AJ, 108, 2348.
- (7) Bershady, M. A., Jangren, A. & Conselice, C. J. 2000, AJ, 119, 2645
- (8) Binney, J. & Tremaine, S., 1987, Galactic Dynamics (Princeton: Princeton University Press)
- (9) Brinchmann, J., Abraham, R. G., Schade, D., Tresse, L., Ellis, R. S., Lilly, S. J., Le Fevre, O., Glazebrook, K., Hammer, F., Colless, M., Crampton, D., & Broadhurst, T. 1998, ApJ, 500, 75.
- (10) Casertano, S. & van Albada, T.S., 1990, in Bayonic Dark Matter, eds D. Lynden-Bell & G. Gilmore (Dordrecht: Kluwer), 159
- (11) Combes, F. & Sanders, R.H., 1981, A&A, 96, 164
- (12) Corbin, M. R., Vacca, W. D., O’Neil, E., Thompson, R. I., Rieke, M. J. & Schneider, G. 2000. AJ, 119, 1062
- (13) de Vaucouleurs, G., de Vaucouleurs, A., Corwin, H.G., Buta, R.J., Paturel, G. & Fouqu/’e, P., 1991, Third Reference Catalogue of Bright Galaxies (New York: Springer-Verlag)
- (14) Doi, M., Fukugita, M., & Okamura, S. 1993, MNRAS, 264, 832.
- (15) Driver, S. P., Windhorst, R. A., Griffiths, R. E. 1995a, ApJ, 453, 48
- (16) Driver, S. P., Fernandez-Soto, A., Couch, W. J., Odewahn, S. C., Windhorst, R. A., Lanzetta, K., & Yahil, K. 1998, ApJ(Lett), 496, 93
- (17) Eskridge, P. B. Frogel, J. A. and and 10 other authors 2000, AJ, 119, 536
- (18) Frei, Z., Guhathakurta, P., Gunn, J.E., Tyson, J.A., 1996, AJ, 111, 174
- (19) Frogel, J. A., Quillen, A. C. and Pogge, R. W., 1996. In New Extragalactic Perspectives in the New South Africa, eds. D. Block and J. M. Greenberg, (Dordrecht: Kluwer), p. 65.
- (20) Glazebrook, K., Ellis, R., Santiago, B., Griffiths, R. 1995, MNRAS, 275, L19
- (21) Gould, S. J., 1998. “The Clam Stripped Bare by Her Naturalists, Even”, in Leonardo’s Mountain of Clams and the Diet of Worms, (Three Rivers Press: NY), p. 96.
- (22) Griffiths, R. E., Casertano, S., Ratnatunga, K. U.m Neuschaefer, L. W., Ellis, R. S., Gilmore, G. F., Glazebrook, K., Santiago, B., Huchra, J. P., Windhorst, R. A., Pascarelle, S. M., Green, R. F., Illingworth, G. D., Koo, D. C. & Tyson, A. J. 1994, ApJ(Lett), 435, L19
- (23) Hasan, H. & Norman, C., 1990, ApJ, 361, 69
- (24) Hubble, E. 1926. ApJ, 64, 321
- (25) Kormendy, J. 1992, in Proc.IAU Symp.153, “Galactic Bulges”, p.209, Kluwer, Dordrecht, eds. Dejonghe, H., Habing, H.
- (26) Marleau, F. R. & Simard, L. 1998, ApJ, 507, 585
- (27) Naim, A. Lahav, O., Buta, R.J., Corwin, H.G., de Vaucouleurs, G., Dressler, A., Huchra, J.P., van den Bergh, S., Raychaudhury, S., Sodre, L., Storrie-Lombardi, M.C., 1995, MNRAS, 274, 1107
- (28) Nilson, P. 1973. Uppsala General Catalogue of Galaxies, Acta Upsaliensis Ser V: A Vol I
- (29) Odewahn, S. C., Windhorst, R. A., Driver, S. P., Keel, W. C. 1996, ApJL, 472, L13
- (30) Pfenniger, D., 1991, in Dynamics of Disk Galaxies, ed. B. Sundelius (Göteborg: Göteborgs University), 191
- (31) Phillips, A. C., Guzman, R., Gallego, J., Koo, D. C., Lowenthal, J. D., Vogt, N. P., Faber, S. M. & Illingworth, G. D. 1997. ApJ, 489, 543.
- (32) Raha, N., Sellwood, J.A., James, R.A., Kahn, F.D., 1991, Nature, 352, 411
- (33) Sandage, A. & Tammann, G.A., 1987, A Revised Shapley-Ames Catalog of Bright Galaxies (Carnegie Institute of Washington)
- (34) Sandage,A. & Bedke,J. 1994 The Carnegie Atlas of Galaxies (Washington: Carnegie Institition)
- (35) Schade, D., Lilly, S. J., Crampton, D., Hammer, F., Le Févre, O. &Tresse, L., ApJ(Lett), 451, 1
- (36) Sellwood, J.A. & Moore, E.M, 1998, ApJ, in press (astro-ph/9807010)
- (37) van den Bergh, S. 1960a ApJ 131,215
- (38) van den Bergh, S. 1960b ApJ 131,558
- (39) van den Bergh, S. 1960c Pub. David Dunlap Obs. Vol.2, No.6
- (40) van den Bergh, S., Abraham, R. G., Ellis, R. S., Tanvir, N. R., Santiago, B. X. 1996, AJ, 112, 359.
- (41) van den Bergh, S., Cohen, J. G., Hogg, D. W. & Blandford, R. 2000, AJ, in press (astro-ph/0008051)
- (42) van den Bergh,S., Cohen,J.G., & Crabbe, C. 2001, AJ, 122 (astro-ph/0104459)
- (43) Volonteri, M., Saracco, P. & Chincarini, G. 2000. A&A(Supp), 145, 111.
- (44) Williams et al. 1996, AJ, 112, 1335
| ID | RC3(1)(1)Classification code from Third Reference Catalog. The standardized coding scheme from the RC3 is shown; note that weakly barred spirals of type SAB are encoded as type SX. | RSA(2)(2)Classification from Revised Shapley-Ames Catalog. | z=0.0(3)(3)Visual classification by vdB. Objects with mag in the flanking fields are excluded. The number in square brackets following each classification indicates the qualitiative visibility of spiral structure as assessed by RGA (0=invisible, 1=hint of structure, 2=obvious spiral structure). | z=0.7 HDF(3)(3)Visual classification by vdB. Objects with mag in the flanking fields are excluded. The number in square brackets following each classification indicates the qualitiative visibility of spiral structure as assessed by RGA (0=invisible, 1=hint of structure, 2=obvious spiral structure). | z=0.7 FF(3)(3)Visual classification by vdB. Objects with mag in the flanking fields are excluded. The number in square brackets following each classification indicates the qualitiative visibility of spiral structure as assessed by RGA (0=invisible, 1=hint of structure, 2=obvious spiral structure). | (4)(4)Apparent F814W-band 2 isophotal magnitude of simulated HDF image. | (5)(5)1-axial ratio of simulated z=0.7 HDF image. | Comment |
|---|---|---|---|---|---|---|---|---|
| NGC0150 | .SBT3*. | Sbc p II | Sbc II [2] | Sc [2] | 22.29 | 0.47 | ||
| NGC0157 | .SXT4.. | Sc II-III | Sc I-II [2] | Sc II [2] | Sc I [2] | 20.85 | 0.25 | |
| NGC0210 | .SXS3.. | Sb I | Sb I [2] | S(B?)b II [2] | Sb [0] | 21.58 | 0.12 | Lens |
| NGC0278 | .SXT3.. | Sbc II | Sbc: [2] | Sa: [0] | 23.53 | 0.06 | ||
| NGC0289 | .SBT4.. | SBbc I-II | S(B)b I [2] | S(B?)b II [2] | Sb [0] | 21.72 | 0.44 | |
| NGC0428 | .SXS9.. | Sc III | Sbc III: [2] | Sb: p [2] | 22.89 | 0.09 | ||
| NGC0488 | .SAR3.. | Sab I | Sa I [2] | Sa: [2] | Sab [0] | 20.51 | 0.26 | |
| NGC0578 | .SXT5.. | Sc II | Sbc I-II [2] | Sbc II [2] | Sbc [1] | 21.53 | 0.47 | |
| NGC0613 | .SBT4.. | SBb II | S(B)b I [2] | S(B)b I [2] | SBb II: [1] | 20.90 | 0.44 | |
| NGC0625 | .SBS9$/ | S p | Amorph. [0] | Sab: [0] | 24.89 | 0.47 | Dusty | |
| NGC0685 | .SXR5.. | SBb II | S(B)c III: [2] | S(B)c: [2] | Sc: II: [1] | 21.92 | 0.19 | |
| NGC0779 | .SXR3.. | Sb I-II | Sab II: [2] | Sb [0] | 22.22 | 0.66 | ||
| NGC0908 | .SAS5.. | Sc I-II | Sc I-II [2] | Sc II [2] | Sc II [2] | 20.70 | 0.57 | |
| NGC1042 | .SXT6.. | Sc I-II | Sc II [2] | Sc II [2] | Sc [1] | 21.90 | 0.19 | |
| NGC1058 | .SAT5.. | Sc II-III | Sc [2] | Sa [0] | 24.60 | 0.03 | ||
| NGC1073 | .SBT5.. | SBc II | SBbc II [2] | SBb I [2] | 22.19 | 0.07 | ||
| NGC1084 | .SAS5.. | Sc II | Sc II: [2] | Sbc [2] | Sb [0] | 21.57 | 0.42 | |
| NGC1087 | .SXT5.. | Sc III-IV | Sc p? [2] | Sbc: p [2] | Sbc [0] | 21.62 | 0.40 | |
| NGC1187 | .SBR5.. | Sbc II | Sc I-II [2] | S(B?)c: II [2] | Sc II [1] | 21.47 | 0.27 | |
| NGC1300 | .SBT4.. | SBb I | SBb I [2] | SBb I [2] | SBb I [2] | 21.14 | 0.40 | |
| NGC1302 | RSBR0.. | Sa | Sa I: [2] | S p [1] | Sb: [0] | 21.55 | 0.07 | Outer shells? |
| NGC1309 | .SAS4*. | Sc II | Sc III: [2] | Sc: [2] | Sc II: [1] | 21.29 | 0.04 | |
| NGC1317 | .SXR1.. | Sa | Sa [2] | Sab: [0] | Sb: [0] | 21.71 | 0.02 | |
| NGC1350 | PSBR2.. | Sa | Sb I: [2] | S(B:)b [2] | Sb II: [2] | 20.88 | 0.58 | |
| NGC1371 | .SXT1.. | Sa | Sab I [2] | Sb: [1] | Sb [0] | 21.84 | 0.28 | |
| NGC1385 | .SBS6.. | SBc | Sc [2] | Sc: p [2] | Sc p [2] | 21.00 | 0.34 | Bar-like knots |
| NGC1493 | .SBR6.. | SBc | S(B)bc II-III [2] | S(B)b: [2] | 22.80 | 0.09 | ||
| NGC1511 | .SA.1P* | Sc p | S [2] | Sb: p [1] | 23.39 | 0.60 | Dusty, edge-on | |
| NGC1559 | .SBS6.. | SBc II | S(B:)c [2] | Sc [2] | Sc [2] | 21.53 | 0.47 | |
| NGC1617 | .SBS1.. | Sa | Sab II: [2] | Sab [0] | 22.44 | 0.51 | ||
| NGC1637 | .SXT5.. | SBc II-III | Sbc II [2] | S [1] | 23.27 | 0.21 | Asymmetric | |
| NGC1703 | .SBR3.. | … | Sc I-II [2] | Sbc: [1] | 22.11 | 0.13 | ||
| NGC1792 | .SAT4.. | Sc II | Sc [2] | Sc [2] | Sc [0] | 21.49 | 0.52 | |
| NGC1808 | RSXS1.. | Sbc p | S p [2] | Sc: [2] | Sc: [0] | 21.82 | 0.59 | Dusty |
| NGC1832 | .SBR4.. | SBb I | S(B)b: II [2] | Sc I: [2] | Sc II [1] | 21.75 | 0.31 | |
| NGC2090 | .SAT5.. | Sc II | Sbc II [2] | Sab [0] | 23.34 | 0.57 | ||
| NGC2139 | .SXT6.. | SBc | S(B:)c (t?) [2] | Sc: t: [2] | S(B?)c [1] | 21.72 | 0.07 | |
| NGC2196 | PSAS1.. | Sab I | Sb II [2] | Sb I [2] | Sb II [2] | 21.04 | 0.17 | |
| NGC2442 | .SXS4P. | SBbc II | SBbc I-II [2] | SBb p [2] | S(B?)bc II [2] | 21.62 | 0.33 | |
| NGC2775 | .SAR2.. | Sa | Sa [2] | Sab: [0] | Sab [0] | 21.45 | 0.18 | |
| NGC3166 | .SXT0.. | Sa | Sab [2] | Sab: [0] | Sa: [0] | 21.77 | 0.55 | |
| NGC3169 | .SAS1P. | Sb t I-II | Sb p (t?) [2] | Sb p? [2] | Sb p [0] | 21.66 | 0.40 | Dusty |
| NGC3223 | .SAS3.. | Sb II | Sbc I-II [2] | Sbc [2] | Sbc II [2] | 20.57 | 0.31 | |
| NGC3275 | .SBR2.. | SBab I | SBb II [2] | Sb t? [2] | Sbc I: [2] | 20.35 | 0.09 | |
| NGC3338 | .SAS5.. | Sbc I-I | Sbc I [2] | Sbc II: [2] | 22.27 | 0.59 | Asymmetric | |
| NGC3423 | .SAS6.. | Sc II | Sc III [2] | Sbc [2] | 23.03 | 0.19 | ||
| NGC3511 | .SAS5.. | Sc III | Sc p [2] | Sc: [2] | 22.31 | 0.66 | Dusty | |
| NGC3513 | .SBT5.. | SBc II | SBbc III: [2] | S(B)c [2] | 22.62 | 0.21 | ||
| NGC3583 | .SBS3.. | Sbc | Sbc II [2] | Sbc p [2] | Sbc p [1] | 21.57 | 0.39 | |
| NGC3593 | .SAS0*. | Sa p | Sb III: [0] | Sa [0] | 24.12 | 0.51 | Edge-on | |
| NGC3646 | .RING.. | Sbc p II | Sc p I [2] | Sc I: [2] | Sc p I [2] | 20.00 | 0.30 | |
| NGC3675 | .SAS3.. | Sb II | Sab II: [2] | Sab [1] | 22.76 | 0.51 | ||
| NGC3681 | .SXR4.. | SBb I-II | S(B)ab II: [2] | Sab [0] | 22.37 | 0.06 | ||
| NGC3726 | .SXR5.. | Sbc II | Sc II: [2] | Sc [1] | 22.08 | 0.38 | ||
| NGC3810 | .SAT5.. | Sc II | Sc I-II [2] | Sbc II [1] | 22.42 | 0.30 | ||
| NGC3877 | .SAS5*. | Sc II | Sb III: [2] | Sb: [0] | 23.24 | 0.78 | Edge-on | |
| NGC3885 | .SAS0.. | Sa | Sb: [2] | Sb [1] | S(B?)b: [0] | 21.55 | 0.65 | Lens? |
| NGC3887 | .SBR4.. | SBbc II-III | Sbc III [2] | Sc [2] | 22.05 | 0.31 | ||
| NGC3893 | .SXT5*. | Sc I | Sbc II: [2] | Sb: [2] | 22.54 | 0.43 | Asymmetric | |
| NGC4027 | .SBS8.. | Sc II | S(B)bc? p [2] | S p [2] | Sbc: p [2] | 21.69 | 0.27 | Tidal arm? |
| NGC4030 | .SAS4.. | … | Sbc I-II [2] | Sbc [2] | Sb [0] | 21.68 | 0.23 | |
| NGC4136 | .SXR5.. | Sc I-II | Sbc II-III: [2] | Sa [0] | 24.70 | 0.09 | ||
| NGC4254 | .SAS5.. | Sc I-II | Sc I-II [2] | Sc I [2] | Sc I [2] | 19.48 | 0.26 | |
| NGC4314 | .SBT1.. | SBa p | SB0/SBa p [2] | S(B?)b? [1] | 22.78 | 0.47 | Edge-on | |
| NGC4414 | .SAT5$. | Sc II | Sbc II-III: [2] | Sb: [1] | 22.77 | 0.45 | ||
| NGC4457 | RSXS0.. | Sb II | Sab [2] | Sab: [0] | 23.49 | 0.30 | ||
| NGC4487 | .SXT6.. | Sc II | S(B?)c III [2] | Sc [2] | 22.51 | 0.36 | ||
| NGC4504 | .SAS6.. | Sc II | Sc III [2] | Sbc: [2] | 23.04 | 0.35 | ||
| NGC4580 | .SXT1P. | Sc | Sb II: [2] | Sbc [1] | 22.40 | 0.24 | ||
| NGC4593 | RSBT3.. | SBb I-II | SBb I-II [2] | SBb II [2] | SBb [2] | 20.70 | 0.42 | |
| NGC4618 | .SBT9.. | SBbc II | S(B)bc III-IV [2] | S p [2] | 23.57 | 0.28 | Asymmetric | |
| NGC4643 | .SBT0.. | SB0/SBa | SBa [2] | Sb: [1] | 22.01 | 0.22 | Edge-on? | |
| NGC4665 | .SBS0.. | … | S(B)a [2] | Sb: [1] | 22.08 | 0.11 | ||
| NGC4689 | .SAT4.. | Sc II-III | Sbc II? [2] | Sc: [2] | Sbc p [1] | 0.00 | Asymmetric | |
| NGC4691 | RSBS0P. | Amorph. | SB p [1] | Sab: [1] | 22.54 | 0.33 | ||
| NGC4699 | .SXT3.. | Sab/Sa | Sa [2] | Sab [1] | Sab [0] | 20.57 | 0.29 | |
| NGC4772 | .SAS1.. | … | Sab [2] | Sa [0] | 23.10 | 0.50 | ||
| NGC4781 | .SBT7.. | Sc III | Sc III? [2] | Sb: [1] | 23.06 | 0.54 | ||
| NGC4856 | .SBS0.. | S0/Sa | SBa/S0 [1] | S(B?)b [0] | 22.07 | 0.63 | ||
| NGC4902 | .SBR3.. | SBb I-II | SBb I [2] | SBbc I [2] | SBbc I [2] | 20.46 | 0.08 | |
| NGC4941 | RSXR2*. | Sab II | Sb [2] | Sb [0] | 23.34 | 0.47 | ||
| NGC4995 | .SXT3.. | Sbc II | Sbc II: [2] | Sbc [2] | 22.26 | 0.35 | ||
| NGC5005 | .SXT4.. | Sb II | Sb III [2] | Sb [0] | S(B?)b [0] | 21.73 | 0.54 | |
| NGC5121 | PSAS1.. | Sa | Sa [2] | Sb: [0] | Sbc: [0] | 21.68 | 0.17 | |
| NGC5161 | .SAS5*. | Sc I | Sbc(t?) I-II [2] | Sbc II [2] | Sc: p? [2] | 21.24 | 0.61 | |
| NGC5371 | .SXT4.. | Sb/SBb I | S(B?)bc I [2] | Sc I [2] | Sbc p I [2] | 20.35 | 0.42 | |
| NGC5448 | RSXR1.. | Sa | Sb II: [2] | Sbc: [2] | Sb: [2] | 21.84 | 0.72 | |
| NGC5676 | .SAT4.. | Sc II | Sbc p II [2] | S p [2] | Sc [1] | 21.27 | 0.57 | Asymmetric |
| NGC5701 | RSBT0.. | SBa | S(B)ab I: [2] | S(B?)b: [1] | 22.02 | 0.21 | ||
| NGC5850 | .SBR3.. | SBb I-II | SBb II [2] | SBb II [2] | SBb II [2] | 20.68 | 0.39 | |
| NGC6753 | RSAR3.. | Sb I | Sb II [2] | Sb II [2] | Sb II: [1] | 20.53 | 0.13 | |
| NGC6907 | .SBS4.. | SBbc II | SBbc I-II [2] | SBbc II [2] | S(B)bc I [2] | 20.51 | 0.15 | |
| NGC7083 | .SAS4.. | Sb I-II | Sbc I-II [2] | Sbc II [2] | Sbc II [2] | 20.49 | 0.46 | |
| NGC7184 | .SBR5.. | Sb II | Sb III: [2] | Sb [2] | Sbc [2] | 20.56 | 0.73 | |
| NGC7205 | .SAS4.. | Sb III | Sbc [2] | Sb p [2] | Sc p [1] | 21.72 | 0.50 | Asymmetric |
| NGC7412 | .SBS3.. | Sc I-II | Sc I [2] | Sbc II [2] | Sc I [2] | 21.81 | 0.23 | |
| NGC7418 | .SXT6.. | Sc II | Sc II [2] | Sc II [2] | Sc [1] | 21.90 | 0.26 | |
| NGC7552 | PSBS2.. | SBb I-II | S(B)bc II [2] | S(B?)b [2] | S(B)b [1] | 21.22 | 0.44 | |
| NGC7582 | PSBS2.. | SBab | S(B?)b II [2] | Sb: [2] | Sb p [0] | 21.52 | 0.58 | Lens |
| NGC7606 | .SAS3.. | Sb I | Sb I [2] | Sbc II [2] | Sbc II [0] | 20.93 | 0.58 | |
| NGC7713 | .SBR7*. | Sc II-III | Sc III-IV [2] | Sb: [1] | 23.28 | 0.51 |
| Type | Carnegie | z=0 | z=0.7 HDF | z=0.7 FF |
|---|---|---|---|---|
| S | 69 (71%) | 71 (70%) | 82 (81%) | 47 (81%) |
| S(B) | 1 (1%)11Sandage & Tammann (1991) do not use de Vaucouleurs type type S(B). | 17 (17%) | 12 (12%) | 6 (10%) |
| SB | 26 (26%) | 11.5 (11%) | 7 (7%) | 5 (9%) |
| S(B)+SB | 26 (26%) | 28.5 (28%) | 19 (19%) | 11 (19%) |