The sources of the X–ray background
Abstract
Deep X–ray surveys have shown that the cosmic X–ray background (XRB) is largely due to the accretion onto supermassive black holes, integrated over cosmic time. The ROSAT, Chandra and XMM–Newton satellites have resolved more than 80% of the 0.1–10 keV X–ray background into discrete sources. Optical spectroscopic identifications are about 90% and 60% complete, for the deepest ROSAT and Chandra/XMM–Newton surveys, respectively, and show that the sources producing the bulk of the X–ray background are a mixture of obscured (type–2) and unobscured (type–1) AGNs, as predicted by the XRB population synthesis models, following the unified AGN scenarios. The characteristic hard spectrum of the XRB can be explained if most of the AGN are heavily absorbed, and in particular a class of highly luminous type–2 AGN, so called QSO–2s exist. The deep Chandra and XMM–Newton surveys have recently detected several examples of QSO–2s. The space density of the X–ray selected AGN, as determined from ROSAT surveys does not seem to decline as rapidly as that of optically selected QSO, however, the statistics of the high–redshift samples is still rather poor. The new Chandra and XMM–Newton surveys at significantly fainter fluxes are starting to provide additional constraints here, but the preliminary observed redshift distribution peaks at much lower redshifts (z=0.5–0.7) than the predictions based on the ROSAT luminosity function.
keywords:
Missions: XMM–Newton, Chandra – Subjects: Cosmology, Backgrounds, AGN1 Introduction
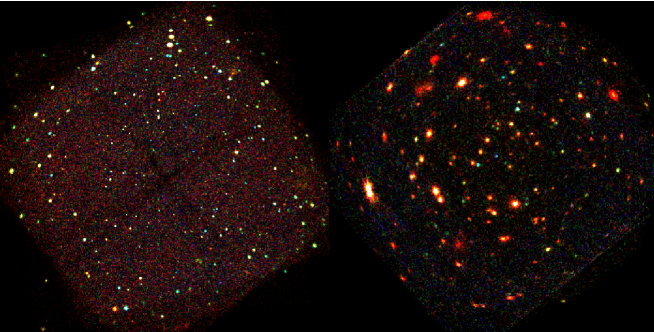
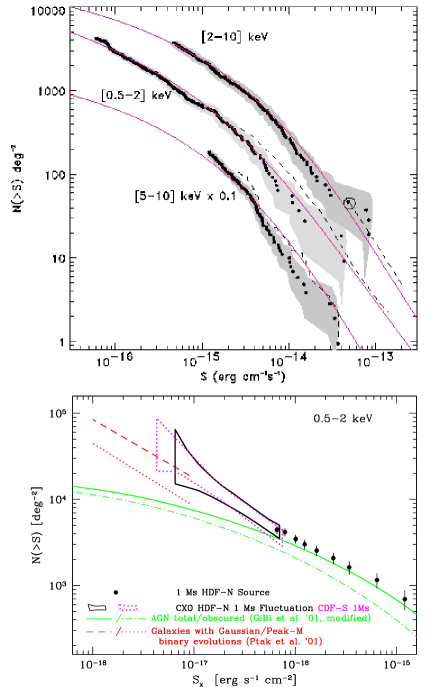
Deep X–ray surveys indicate that the cosmic X–ray background (XRB) is largely due to accretion onto supermassive black holes, integrated over cosmic time. In the soft (0.5–2 keV) band more than 90% of the XRB flux has been resolved using a 1.4 Msec observation with ROSAT ([\astronciteHasinger et al.1998]) and recently two 1 Msec Chandra observations ([\astronciteRosati et al.2002, \astronciteBrandt et al.2001b]) and a 100 ksec observation with XMM–Newton ([\astronciteHasinger et al.2001a]) (see Figure 1). In the harder (2–10 keV) band a similar fraction of the background has been resolved with the above Chandra and XMM–Newton surveys, reaching source densities of about 4000 deg-2. Surveys in the very hard (5–10 keV) band have been pioneered using BeppoSAX, which resolved about 30% of the XRB ([\astronciteFiore et al.1999]). XMM–Newton and Chandra have now also resolved the majority (60–70%) of the very hard X–ray background. The Log N–Log S distribution shows a significant cosmological flattening in the softer bands (see Figure 2), while in the very hard band it is still relatively steep, indicating that those surveys have not yet sampled the redshifts where the strong cosmological evolution of the sources saturates.
Optical followup programs with 8–10m telescopes have been completed for the ROSAT deep surveys and find predominantly Active Galactic Nuclei (AGN) as counterparts of the faint X–ray source population ([\astronciteSchmidt et al.1998, \astronciteZamorani et al.1999, \astronciteLehmann et al.2001]) mainly X–ray and optically unobscured AGN (type–1 Seyferts and QSOs) and a smaller fraction of obscured AGN (type–2 Seyferts). Optical identifications for the deepest Chandra and XMM–Newton fields are still far from complete, however a mixture of obscured and unobscured AGN with an increasing fraction of obscuration seems to be the dominant population in these samples, too ([\astronciteFiore et al.2000, \astronciteBarger et al.2001a, \astronciteTozzi et al.2001, \astronciteRosati et al.2002]; see below). Interestingly, first examples of the long–sought class of high–redshift, high–luminosity, heavily obscured active galactic nuclei (type–2 QSO) have been detected in deep Chandra fields ([\astronciteNorman et al.2002, \astronciteStern et al.2002]) and in the XMM–Newton Deep survey in the Lockman Hole field ([\astronciteHasinger et al.2001b]).
After having understood the basic contributions to the X–ray background, the general interest is now focussing on understanding the physical nature of these sources, the cosmological evolution of their properties, and their role in models of galaxy evolution. We know that basically every galaxy with a spheroidal component in the local universe has a supermassive black hole in its center ([\astronciteGebhardt et al.2000]). The luminosity function of X–ray selected AGN shows strong cosmological density evolution at redshifts up to 2, which goes hand in hand with the cosmic star formation history ([\astronciteMiyaji et al.2000, \astronciteMiyaji et al.2001]). At the redshift peak of optically selected QSOs around z=2.5 the AGN space density is several hundred times higher than locally, which is in line with the assumption that most galaxies have been active in the past and that the feeding of their black holes is reflected in the X–ray background. While the comoving space density of optically and radio–selected QSO declines significantly beyond a redshift of 3 ([\astronciteSchmidt et al.1995, \astronciteFan et al.2001, \astronciteShaver et al.1996]), a similar decline has not yet been observed in the X–ray selected AGN population ([\astronciteMiyaji et al.2000]), although the statistical quality of the high–redshift AGN samples needs to be improved. The new Chandra and XMM–Newton surveys are bound to give additional constraints here.
The X–ray observations have so far been about consistent with population synthesis models based on unified AGN schemes ([\astronciteComastri et al.1995, \astronciteGilli et al.2001]), which explain the hard spectrum of the X–ray background by a mixture of absorbed and unabsorbed AGN, folded with the corresponding luminosity function and its cosmological evolution. According to these models, most AGN spectra are heavily absorbed and about 80% of the light produced by accretion will be absorbed by gas and dust ([\astronciteFabian et al.1998]). However, these models are far from unique and contain a number of hidden assumptions, so that their predictive power remains limited until complete samples of spectroscopically classified hard X–ray sources are available. In particular they require a substantial contribution of high–luminosity obscured X–ray sources (type–2 QSOs), which so far have only scarcely been detected. The cosmic history of obscuration and its potential dependence on intrinsic source luminosity remain completely unknown. [*]ghasinger-F1:Gil01 e.g. assumed strong evolution of the obscuration fraction (ratio of type–2/type–1 AGN) from 4:1 in the local universe to much larger covering fractions (10:1) at high redshifts (see also [\astronciteFabian et al.1998]). The gas to dust ratio in high–redshift, high–luminosity AGN could be completely different from the usually assumed galactic value due to sputtering of the dust particles in the strong radiation field ([\astronciteGranato et al.1997]). This might provide objects which are heavily absorbed at X–rays and unobscured at optical wavelengths.
In this paper I shortly discuss the current status of the optical identification work in the ROSAT/XMM–Newton/ Chandra deep survey in the Lockman Hole, which is largely based on optical work with the Keck telescope led by Maarten Schmidt (see [\astronciteSchmidt et al.1998] and [\astronciteHasinger et al.2001b] for more detail). I also present preliminary results of optical identifications in the Chandra Deep Field South, obtained with the ESO VLT, which will be formally published in [\astronciteSzokoly et al.2002] (see also [\astronciteTozzi et al.2001, \astronciteRosati et al.2002]). I then discuss the results and try to come to some tentative conclusions about the evolution of X–ray sources at high redshifts.
2 Optical identifications of deep X–ray surveys
2.1 The Lockman Hole field
The Lockman Hole field has been observed with the XMM–Newton observatory during the performance verification phase (see Figure 1a). About 100 ksec good data, centered on the same sky position as the ROSAT HRI pointing, have been accumulated with the European Photon Imaging Camera (EPIC) reaching minimum fluxes of 0.31, 1.4 and 2.4 10-15 erg cm-2 s-1 in the 0.5–2, 2–10 and 5–10 keV energy bands. Within an off–axis angle of 10 arcmin 148, 112 and 61 sources, respectively, have been detected. In the 5–10 keV energy band a somewhat lower sensitivity compared to the 1Msec Chandra Deep Field South observation has been reached (see [\astronciteRosati et al.2002]), resolving 60 % of the very hard X–ray background ([\astronciteHasinger et al.2001a]). This is about a factor of 20 more sensitive than the previous BeppoSAX observations. A total of 300 ksec observations of the Lockman Hole has been accumulated with the Chandra HRC in the 0.5–7.0 keV band, reaching a similar flux limit compared to the XMM–Newton pointing ([\astronciteMurray et al.2002]). The Chandra HRC data provide very accurate source positions, whereas XMM–Newton allows spectrophotometry of very faint intrinsically absorbed X–ray sources due to its unprecedented sensitivity in the hard band.
The optical counterparts for 60 X–ray sources are already known from the spectroscopic identification of the ROSAT Ultradeep Survey sample ([\astronciteLehmann et al.2001]). Among them are one of the most distant X–ray selected quasars at ([\astronciteSchneider et al.1998]) and one of the highest redshift, probably merging cluster of galaxies at ([\astronciteHasinger et al.1999, \astronciteThompson et al.2001, \astronciteHashimoto et al.2002]). We have identified 25 new XMM–Newton sources using low–resolution multi–slit mask spectra taken with the LRIS instrument at the Keck II telescope in March 2001 (PI: M. Schmidt; [\astronciteLehmann et al.2002]). Among the new XMM sources we have found only a few new broad emission line AGNs (type–1), while the optical spectra of most new sources show narrow emission lines and/or only galaxy–like continuum emission at redshifts . In several cases high ionisation emission lines like Ne V are absent and thus we see no sign for AGN activity in the optical spectrum, however, their high X–ray luminosity (L erg s-1) and/or the strong intrinsic absorption (log N) reveal a type–2 AGN in these sources. Three new sources showing typical galaxy spectra, have been detected only in the 0.5–2.0 keV band. Due to their relatively low X–ray luminosities (log L) and their soft X–ray spectra (no indication for intrinsic absorption) we classify them as normal galaxies. Several sources with X–ray luminosities in the range of log L, which show galaxy–like optical spectra, are hard to classify due to the small number of photons in their X–ray spectra. We preliminarily classify them as type–2 AGN/galaxy. The completeness of the identification ranges from 61% in the soft sample to 79% in the ultra hard sample (5–10 keV energy band) ([\astronciteLehmann et al.2002]). The majority of the so far spectroscopically identified sources are type–1 and type–2 AGNs. Although we have no complete identification so far we find a strong indication for a larger fraction of type–2 AGNs, especially in the ultra hard sample, compared to that (20%) of the UDS. Nearly all spectroscopically identified type–2 AGNs are at moderate redshift (). One type–2 QSO candidate (X174A) at has been identified in the Lockman Hole region so far ([\astronciteHasinger et al.2001b]).
Most of the unidentified faint XMM–Newton sources have very faint optical counterparts () and at least half of them are extremely red objects (EROs, , see also [\astronciteBergeron et al.2002]). The new XMM–Newton sources with EROs as optical counterparts are similar to those objects in the UDS with photometric redshifts suggesting obscured AGNs at redshifts . The photometric redshift technique is probably the only tool to identify such faint optical objects. The XMM–Newton source population at faint fluxes is therefore likely dominated by obscured AGNs (type–2), as predicted by the AGN population synthesis models for the X–ray background.

2.2 The Chandra Deep Field South (CDFS)
The Chandra X–ray Observatory has performed deep X–ray surveys in a number of fields with ever increasing exposure times ([\astronciteMushotzky et al.2000, \astronciteHornschemeier et al.2000, \astronciteGiacconi et al.2001, \astronciteTozzi et al.2001, \astronciteBrandt et al.2001a]) and has recently completed two 1 Megasec Chandra exposures, in the Chandra Deep Field South (CDFS, [\astronciteGiacconi et al.2002, \astronciteRosati et al.2002]) and in the Hubble Deep Field North (HDF–N, [\astronciteBrandt et al.2001b]), the latter exposure is currently being increased to 2 Megasec.
Here I discuss results from the 940 ksec CDFS observation. The source counts (see Figure 2) have been extended to in the soft 0.5–2 keV band and in the hard 2–10 keV band, reaching a space density of almost , resolving of the background in both bands. A total of 346 sources has been detected ([\astronciteTozzi et al.2001, \astronciteRosati et al.2002]).
Deep optical imaging and multiobject spectroscopy has been performed in 12 nights with the ESO Very Large Telescope (VLT) in the time frame April 2000 – December 2001, using the FORS instruments with individual exposure times ranging from 1–5 hours. Some preliminary results including the VLT optical spectroscopy have already been presented elsewhere ([\astronciteNorman et al.2002, \astronciteTozzi et al.2001, \astronciteRosati et al.2002]). A complete optical spectroscopy catalogue will be published by [*]ghasinger-F1:Szo02. Figure 3 shows examples of 4 VLT spectra. The upper two spectra show high–redshift QSOs with restframe–UV absorption features (BAL or mini–BAL QSOs), which both have some indication of intrinsic absorption in their X–ray spectra. The object in the lower left is the famous, highest redshift type–2 QSO detected in the CDFS with heavy X–ray absorption in the QSO rest frame ([\astronciteNorman et al.2002]). The spectrum in the lower right shows a Seyfert–2 galaxy with heavy X–ray absorption and an AGN–type luminosity. The latter spectrum is characteristic for the bulk of the detected galaxies, which show either no or very faint high excitation lines indicating the AGN nature of the object, so that we have to resort to a combination of optical and X–ray diagnostics to classify them as AGN (see below). Redshifts could be obtained so far for 169 of the 360 sources in the CDFS, of which 123 are very reliable (high quality spectra with 2 or more spectral features), while the remaining optical spectra contain only a single emission line, or are too noisy. For objects fainter than R=24 reliable redshifts can be obtained (see also Figure 5), if the spectra contain strong emission lines. For the remaining optically faint objects we have to resort to photometric redshift techniques. About 11% of the CDFS sources have no counterpart even in deep VLT optical images () or near–IR imaging (15% at ) ([\astronciteRosati et al.2002]). Nevertheless, for a subsection of the sample at off–axis angles smaller than 8 arcmin we obtain a spectroscopic completeness of about 60%.

2.3 Optical/X–ray classification
Type–1 AGN (Seyfert–1 and QSOs) can be often readily identified by the broad permitted emission lines in their optical spectra. Luminous Seyfert–2 galaxies show strong forbidden emission lines and high–excitation lines indicating photoionization by a hard continuum source. However, already in the spectroscopic identifications of the ROSAT Deep Surveys it became apparent, that an increasing fraction of faint X–ray selected AGN shows a significant, sometimes dominant contribution of stellar light from the host galaxy in their optical spectra, depending on the ratio of optical luminosity between nuclear and galaxy light ([\astronciteLehmann et al.2000, \astronciteLehmann et al.2001]). If an AGN is outshined by its host galaxy it is not possible to detect it optically. Many of the counterparts of the faint X–ray sources detected by Chandra and XMM–Newton show optical spectra which are dominated by their host galaxy and only a minority has clear indications of an AGN nature (see also [\astronciteBarger et al.2001a, \astronciteBarger et al.2001b]). In these cases, the X–ray emission could still be dominated by the active galactic nucleus, while a contribution from stellar and thermal processes (hot gas from supernova remnants, starbursts and thermal halos, or a population of X–ray binaries) can be important as well.
In these cases X–ray diagnostics in addition to the optical spectroscopy can be crucial to classify the source of the X–ray emission. AGN have typically (but not always!) X–ray luminosities above and power law spectra, often with significant intrinsic absorption. Local, well–studied starburst galaxies have integrated X–ray luminosities typically below and very soft X–ray spectra. Thermal haloes of galaxies and the intergalactic gas in groups can have higher X–ray luminosities, but has soft spectra as well. The redshift effect in addition helps the X–ray diagnostic, because soft X–ray spectra appear even softer already at moderate redshift, while the typical AGN power law spectra appear harder over a very wide range of redshifts.
In Figure 4 the X–ray hardness ratio is shown as a function of the X–ray luminosity (in the 0.5–2 keV, 2–10 keV, or 0.5–10 keV band, depending on in which band the object was detected) for 170 sources for which we have optical spectra and reliable redshifts in the CDFS ([\astronciteSzokoly et al.2002]; see also [\astronciteRosati et al.2002]) and the Lockman Hole ([\astronciteLehmann et al.2001, \astronciteLehmann et al.2002]) for X–ray sources detected by Chandra and XMM–Newton, respectively. The hardness ratio is defined as where and are the net count rates in the hard (2–7 keV for Chandra and 2–4.5 keV for XMM–Newton) and the soft band (0.5–2 keV), respectively. The X–ray luminosities are not corrected for internal absorption and are computed assuming km s-1 Mpc-1 and .
Although this diagram is for illustration purposes only and a a correct treatment would have to properly take into account the different instrument characteristics and detection bands, it clearly shows a segregation of the different X–ray emitters (indicated by the dashed elliptical outlines. Type–1 AGNs have luminosities above and hardness ratios scattered around , corresponding to a power law photon index around , typical for the intrinsic continuum of AGN. Type–2 AGN have observed luminosities above (intrinsically higher), but are scattered to much larger hardness ratios (). Direct spectral fits of the XMM–Newton and (some) Chandra spectra clearly indicate, that these harder spectra are due to neutral gas absorption and not due to a flatter intrinsic slope ([\astronciteNorman et al.2002, \astronciteHasinger et al.2001b, \astronciteBergeron et al.2002, \astronciteMainieri et al.2002]). It is interesting to note that no high–luminosity, very hard sources exist in this diagram. This is due to a selection effect of the pencil beam surveys: due to the small solid angle, the rare high luminosity sources are only sampled at high redshifts, where the absorption cutoff of type–2 AGN is redshifted to softer X–ray energies. Indeed, the type–2 QSOs in this sample ([\astronciteNorman et al.2002, \astronciteLehmann et al.2002]) are the objects at and .
About 10% of the sources have optical spectra of normal galaxies, X–ray luminosities below and very soft spectra (), typical for starburst galaxies or hot gas halos. The deep Chandra and XMM–Newton surveys therefore for the first time detect the population of normal starburst galaxies out to intermediate redshifts ([\astronciteMushotzky et al.2000, \astronciteGiacconi et al.2001, \astronciteLehmann et al.2002]), for which a significant contribution to the XRB had been claimed for a long time (e.g. [\astronciteMcHardy et al.1998]). Those galaxies, however, appear at much lower fluxes and therefore produce an almost negligible contribution to the background. They might become an important means to study the star formation history in the universe completely independently from optical/UV, sub–mm or radio observations. However, in the X–ray luminosity range around , where the emission from star forming processes and the central AGN may be comparable, there will always remain ambiguities.
The joint optical/X–ray diagnostics scheme can also be applied to the spectroscopically identified X–ray sources in other deep Chandra fields in order to obtain an as complete sample of faint X–ray source classification as possible. Table 1 gives a summary of optical identifications and X–ray source types in the two deep fields discussed here, as well as in the Hawaii 13hr field, the Abell 370 cluster field and the Hubble Deep Field North which all have spectroscopically identified samples in the literature ([\astronciteBarger et al.2001a, \astronciteBarger et al.2001b]).
| Field | AGN1 | AGN2 | Gal. | Reference |
|---|---|---|---|---|
| LHole | 41 | 26 | 7 | [\astronciteLehmann et al.2002] |
| CDFS | 47 | 73 | 49 | [\astronciteSzokoly et al.2002] |
| Abell370 | 9 | 5 | 6 | [\astronciteBarger et al.2001b] |
| 13hra | 5 | 7 | 1 | [\astronciteBarger et al.2001a] |
| HDF–Na | 10 | 10 | 0 | [\astronciteBarger et al.2001b] |
a only 2–7 keV band detections considered


3 The new redshift distribution
All the above samples have a spectroscopic completeness of about 60%, which is mainly caused by the fact that about 40% of the counterparts are optically too faint to obtain reliable spectra. This incompleteness is probably also reflecting some redshift bias, most likely higher redshift objects are missing, as well as faint emission line objects, where the strongest emission lines ([OII], Lyα) fall outside the optical bands. On the other hand, the optically faintest identified sources (R=24–25) are distributed throughout the whole redshift range z=0–4 (see Figure 5), therefore there is reason to believe that a substantial fraction of the so far unidentified sources follows the same redshift distribution as the identified sources. The completeness of 60% therefore allows to compare the redshift distribution with predictions from X–ray background population synthesis models ([\astronciteGilli et al.2001]), based on the AGN X–ray luminosity function and its evolution as determined from the ROSAT surveys ([\astronciteMiyaji et al.2000]), which predict a maximum at redshifts around z=1.5. Figure 6 shows two predictions of the redshift distribution from the [*]ghasinger-F1:Gil01 model for a flux limit of in the 0.5–2 keV band with different assumptions for the high–redshift evolution of the QSO space density. The two models from [*]ghasinger-F1:Gil01 have been normalized at the peak of the distribution.
The actually observed redshift distribution does not vary significantly within the flux limit range covered by the samples in table 1, therefore the total observed redshift distribution is shown in Figure 6 for the total number of sources in all samples. The observed redshift distribution, arbitrarily normalized to roughly fit the population synthesis models in the redshift range 1.5 – 3 keV is radically different from the prediction, with a peak at a redshift in the range 0.5–0.7. This is still the case, if the objects belonging to the large scale structures around z=0.7 in the CDFS are removed. The total number of objects at redshift less than 1 is significantly higher than the model predictions, even ignoring the 40% spectroscopic incompleteness. The peak at redshifts below 1 is also significant, if the normal star forming galaxies in the sample are removed. This clearly demonstrates that the population synthesis models will have to be modified to incorporate different luminosity functions and evolutionary scenarios for intermediate–redshift, low–luminosity AGN.

4 The AGN evolution at high redshift
The comparison between the observed and predicted N(z) distributions at high redshifts is complicated by the possible existence of large–scale structure in the pencil beam survey (there is e.g. a possibly significant excess of objects around z=2.5 in the CDFS), but also by redshift–dependent selection effects and in general by the still relatively small volume sampled and therefore poor counting statistics in the number of objects. In addition, the overall normalization of the curves is uncertain because of the significant mismatch of the distribution at low z. Nevertheless, the observed distribution is roughly consistent with both predictions in the redshift range z=1.6–3.8. There is, however, a significant discrepancy between the observed distribution and the constant space density model (dotted line) at redshifts above 4, where only one object was detected, while about 8 objects would be predicted. From Figure 5 it becomes apparent, that the dearth of X–ray selected AGN is probably not due to optical spectroscopic selection effects. The one object detected at z=4.45 already in the ROSAT data of the Lockman Hole ([\astronciteSchneider et al.1998]) has an optical magnitude of R=23 and is therefore not at the spectroscopic limit of the samples. Also the and CIV lines for QSOs in the redshift range 4–5 fall well into the optical range. The observed redshift distribution therefore gives a strong indication for a decline of the QSO space density beyond a redshift of 3.8.
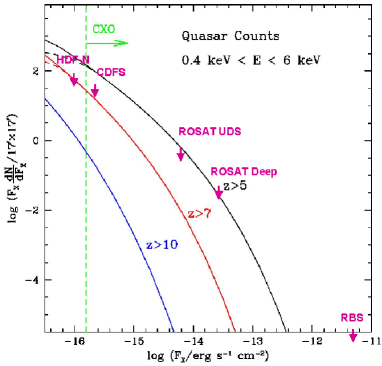
A similar conclusion about a decline of the X–ray selected AGN space density at high redshifts can be obtained from the absence of QSOs with in all X–ray survey samples so far. (There was a recent announcement of a QSO at z=5.2 in the Chandra observation of the HDF–N, but this does not change the conclusions discussed below). Figure 7 shows a prediction of number counts for high–redshift QSO from [*]ghasinger-F1:Hai99, according to which a large number of AGN should be detected in any deep survey with Chandra. This theoretical model assumes the X–ray luminosity function at z=3.5 determined from the ROSAT surveys and extrapolates it backwards in time assuming a simple hierarchical CDM model and a constant black hole mass fraction throughout. The figure also shows limits for the number counts of AGN from X–ray surveys at varying flux limits. The most distant QSO among objects in the ROSAT Bright Survey (RBS, [\astronciteSchwope et al.2000]) has a redshift of 2.8, the lack of higher redshift objects is, however, not constraining given the high flux limit of this survey. The lack of AGN in the ROSAT Deep and Ultradeep Surveys ([\astronciteSchmidt et al.1998, \astronciteLehmann et al.2000, \astronciteLehmann et al.2001]) is still just consistent with the Haiman & Loeb predictions, the highest–redshift object in the UDS is RX J105225.9+571905 at z=4.45 ([\astronciteSchneider et al.1998]). The Chandra Deep survey, while only about 60% spectroscopically identified, still provides an upper limit for the number counts of AGN significantly lower than the prediction, using the conservative assumption that less than half of the unidentified objects are at redshifts larger than 5. Finally, the 400 ksec Chandra observation in the Hubble Deep Field proper, providing 100% identifications for 12 sources in the field and their highest redshift object at z=4.42 just outside the HDF–N also gives an upper limit about a factor of three lower than the Haiman & Loeb prediction.
The information about the space density of X–ray selected AGN is still limited by the small number statistics in the deep X–ray surveys which cover too small a solid angle. More and wider fields have been surveyed by both Chandra and XMM–Newton. As soon as the tedious and time consuming optical follow–up work in these fields is completed, we will be able to learn more about the decline of the X–ray AGN and therefore their formation at early redshifts. The possible discrepancy between a declining space density of optical and radio–selected QSOs above a redshift of 2.7 and an apparently constant space density of X–ray selected AGN with a decline beyond a redshift of could still be understood in terms of the different luminosity and therefore different black hole mass of the objects involved. The optical and radio surveys cover a large solid angle to a modest flux limit and therefore pick up only the most luminous and therefore most massive objects at high redshift. The deep pencil beam surveys, on the other hand, sample a much smaller volume to much fainter flux limits and therefore select high–redshift AGN which are intrinsically a factor of more than 10 less luminous and therefore probably less massive than the objects selected in wide–angle surveys. In the hierarchical large scale structure formation the smaller cold dark matter halos collapse earlier than the larger ones. Given the correlation between black hole mass and galaxy mass (and presumably dark matter mass), it is expected that the lower mass black holes are formed earlier than the most massive objects and thus that lower luminosity AGN appear earlier than the most luminous QSOs (see [\astronciteKauffmann & Haehnelt2000]). This concept can be tested with more optical identifications of Chandra and XMM–Newton surveys and with future, even more sensitive X–ray telescopes, like the ESA/ISAS XEUS mission.
Acknowledgements.
I thank the organisers of the conference ”New Visions of the X–ray Universe” for the invitation for this review. I thank my co–workers in the Chandra Deep Field South and Lockman Hole identification teams for the fruitful collaboration and the permission to show data in advance of publication. This work was supported by DLR grant 55 OR 9908.References
- [\astronciteBarger et al.2001a] Barger, A. J., Cowie, L. L., Mushotzky, R. F., Richards, E. A., 2001, AJ 121, 662
- [\astronciteBarger et al.2001b] Barger, A.J., Cowie, L.L., Bautz M.W., et al., 2001, AJ 122, 2177
- [\astronciteBergeron et al.2002] Bergeron, J.., et al., this issue
- [\astronciteBrandt et al.2001a] Brandt, W.N., Hornschemeier A.E., Alexander D.M., et al., 2001, AJ 122, 1
- [\astronciteBrandt et al.2001b] Brandt, W.N., Alexander D.M., Hornschemeier A.E., et al., 2001, AJ 122, 2810
- [\astronciteCagnoni et al.1998] Cagnoni I., Della Ceca R., Maccacaro T., 1998, ApJ 493, 54
- [\astronciteComastri et al.1995] Comastri A., et al., 1995, A&A 296, 1
- [\astronciteFabian et al.1998] Fabian A.C., Barcons X., Almaini O., Iwasawa K., 1998, MNRAS 297, L11
- [\astronciteFan et al.2001] Fan X., et al., 2001, AJ 121 54
- [\astronciteFiore et al.1999] Fiore F., LaFranca F., Giommi P., et al., 1999, MNRAS 306, 55
- [\astronciteFiore et al.2000] Fiore F., LaFranca F., Vignali C., et al., 2000, NewA 5, 143
- [\astronciteGebhardt et al.2000] Gebhardt K., Bender R., Bower G., et al., 2000, ApJ 539, 13
- [\astronciteGiacconi et al.2001] Giacconi, R., Rosati P., Tozzi P., et al., 2001, ApJ 551, 624
- [\astronciteGiacconi et al.2002] Giacconi, R., Zirm A., Wang P., et al., 2002, ApJS (in press), astro-ph/0112184
- [\astronciteGilli et al.2001] Gilli, R., Salvati, M., Hasinger, G., 2001, A&A 366, 407
- [\astronciteGranato et al.1997] Granato G.L., Danese L., Francheschini A., 1997, ApJ 486, 147
- [\astronciteHaiman & Loeb1999] Haiman, Z. & Loeb A., 1999, ApJ 519, 479
- [\astronciteHashimoto et al.2002] Hashimoto, Y., Hasinger, G., Arnaud, M., et al., 2002, A&A 381, 841
- [\astronciteHasinger et al.1993] Hasinger, G., Burg, R., Giacconi, R., et al., 1993, A&A 275, 1
- [\astronciteHasinger et al.1998] Hasinger, G., Burg, R., Giacconi, R., et al., 1998, A&A 329, 482
- [\astronciteHasinger et al.1999] Hasinger, G., Giacconi, R., Gunn, J.E., et al., 1999, A&A 340, 27
- [\astronciteHasinger et al.2001a] Hasinger, G., Altieri, B., Arnaud, M., et al., 2001, A&A 365, 45
- [\astronciteHasinger et al.2001b] Hasinger, G. & Lehmann, I. 2001, Proceedings for ”Where’s the Matter?”, Marseille, France, 25-29 June 2001, eds. L. Tresse & M. Treyer, in press.
- [\astronciteHornschemeier et al.2000] Hornschemeier, A.E., Brandt, W.N., Garmire, G.P., et al., 2000, ApJ 541, 49
- [\astronciteKauffmann & Haehnelt2000] Kauffmann G. & Haehnelt M., 2000, MNRAS 311, 576
- [\astronciteLehmann et al.2000] Lehmann, I., Hasinger, G., Schmidt, M., et al., 2000, A&A 354, 35
- [\astronciteLehmann et al.2001] Lehmann, I., Hasinger, G., Schmidt, M., et al., 2001, A&A 371, 833
- [\astronciteLehmann et al.2002] Lehmann, I., Hasinger, G., Murray, S.S., Schmidt, M., 2002, High Energy Universe at Sharp Focus: Chandra Science, proceedings, ASP Conference Series, eds. S. Vrtilek, E.M. Schlegel, L. Kuhi (astro-ph/0109172)
- [\astronciteMainieri et al.2002] Mainieri V., et al., 2002, A&A in prep.
- [\astronciteMcHardy et al.1998] McHardy I., Jones L.R., Merrifield M.R., et al., 1998, MNRAS 295, 641
- [\astronciteMiyaji et al.2000] Miyaji, T., Hasinger, G., Schmidt, M., 2000, A&A 353, 25
- [\astronciteMiyaji et al.2001] Miyaji, T., Hasinger, G., Schmidt, M., 2001, A&A 369, 49
- [\astronciteMiyaji et al.2002] Miyaji, T., Griffiths R.E., 2002, this issue (astro-ph/0202048)
- [\astronciteMurray et al.2002] Murray, S.S., et al., 2002, in preparation
- [\astronciteMushotzky et al.2000] Mushotzky, R.F., Cowie L.L., Barger, A.J., Arnaud, K.A., 2000, Nature 404, 459
- [\astronciteNorman et al.2002] Norman C., Hasinger G., Giacconi R., et al. 2002, ApJ in press (astro-ph/0103198)
- [\astronciteRosati et al.2002] Rosati P., Tozzi P., Giacconi R., et al., 2002, ApJ, in press (astro-ph/0110452)
- [\astronciteSchmidt et al.1995] Schmidt, M., Schneider, D.P. & Gunn J.E., 1995, AJ 114, 36
- [\astronciteSchmidt et al.1998] Schmidt, M., Hasinger, G., Gunn, J.E., et al., 1998, A&A 329, 495
- [\astronciteSchneider et al.1998] Schneider, D.P., Schmidt, M., Hasinger, G., et al., 1998, AJ 115, 1230
- [\astronciteSchwope et al.2000] Schwope A., Hasinger G., Lehmann I., et al., 2000, AN 321, 1
- [\astronciteShaver et al.1996] Shaver P.A. et al., 1996, Nature 384, 439
- [\astronciteStern et al.2002] Stern D., et al., 2002, ApJ (in press), astro-ph/0111513
- [\astronciteSzokoly et al.2002] Szokoly, G., Hasinger G., Rosati, P. et al. 2002 (in prep.)
- [\astronciteThompson et al.2001] Thompson D., Pozzetti, L., Hasinger, G., et al., 2001, A&A 377, 778
- [\astronciteTozzi et al.2001] Tozzi, P., Rosati, P., Nonino, M., et al., 2001, ApJ, in press (astro-ph/0103014)
- [\astronciteZamorani et al.1999] Zamorani G., Mignoli M., Hasinger G., et al., 1999, A&A 346,731