A full orbit XMM-Newton observation of PKS 2155-304
Abstract
XMM observed the BL Lac PKS 2155-304 for a full orbit (150 ksec) on 2000 November 19-21. Preliminary results on the temporal and spectral analysis of data from the EPIC PN camera and Optical Monitor are presented. The variability amplitude depends systematically on energy, however the slopes of the structure functions of the light-curves in different bands do not appear to be significantly different. No evidence of time lags is found by cross correlating the light-curves in different bands.
keywords:
BL Lacertae objects: general - BL Lacertae objects: individual (PKS 2155-304) - galaxies: active - X-rays galaxies1 Introduction
Emission from Blazars is dominated by the non-thermal continuum produced in a relativistic jet pointing close to the line of sight (e.g. Urry & Padovani 1995). Thanks to the effects of relativistic beaming the jet flux can be enhanced by several orders of magnitude and its variability can therefore be studied observationally down to short timscales. Blazars hold crucial information on the physical processes taking place in relativistic jets. The “double humped” shape of the Spectral Energy Distribution (SED) is generally interpreted as due to synchrotron and Inverse Compton emission from a population of relativistic electrons in the jet. In fact from modelling the shape of the SED and the correlated variability of the two components it is possible to constrain the basic physical quantities of the jet (e.g. Sikora & Madejski 2001; Tavecchio et al. 1998). In particular, variability allows one to explore the acceleration and cooling processes acting on electrons. On this regard, especially valuable are observations in X-rays, which are produced by high-energy, fast-evolving particles.
Thanks to the ASCA and Beppo-SAX satellites, time lags between variability at different X-ray energies were discovered in PKS 2155-304 and Mkn 421. In the case of PKS 2155-304 lags were always of the same sign, soft X-rays lagging the harder ones, while both signs were found in Mkn 421. The simplest interpretation of these findings is that the emission from different X-ray energy bands is due to the same population of electrons. Within this picture the observed lags correspond to the time needed by the electrons to cool (soft lag) or accelerate (hard lag) and emit radiation in another energy band.
The main limitation to the ASCA and Beppo-SAX studies is related to the low orbit of such satellites: the periodic earth blockage prevents a continuous sampling of flux behaviuours, making temporal analysis more complicated and less reliable. The advent of the new generation satellites, such as XMM-Newton and Chandra, thanks to their high altitude and elliptical orbits, opens a new era in variability studies. In fact they offer continuous target visibility for up to about 40 hours compared with only minutes from the low orbit satellites. In particular the big improvement offered by XMM-Newton is due to the combination of such a long continuous coverage of the target coupled with an unprecedently large effective area. Another striking feature of XMM-Newton is the possibility offered by the Optical Monitor to explore simultaneously the optical-UV bands.
With the goal of characterizing in a better way the variability we obtained a ks XMM-Newton observation of one of the X-ray and UV brightest Blazars: PKS 2155-304.
PKS 2155-304 () is a well known BL Lac object (a subclass class
of blazars with an almost featureless optical spectrum), intensively
monitored in the past years. Limiting quotations to results based on ASCA, BeppoSAX, CHANDRA or XMM-Newton, a minimal list
of references is the following: Urry et al. 1997 (reporting simultaneous
ASCA, EUVE and IUE lightcurves); Tanihata et al. 2001
(continuous 10-days ASCA observation); Kataoka et al. 2001 (summary
of ASCA and Rossi-XTE lightcurves); Zhang et al. 2002
(summary of BeppoSAX lightcurves); Nicastro et al. 2002 (the first
spectrum of PKS 2155-304 obtained with the Chandra
gratings). Edelson et al. (2001) report on a 100 ks-long XMM-Newton
observation secured on May 30 2000 during the Performance
Verification/Guaranteed Time Observation phase.
We present the results of a preliminary analysis of a long XMM-Newton pointing of PKS 2155-304 on Nov 19-21 2000. Due to problems in the satellite data analysis pipeline, the preprocessed data became available to us only recently. We present in this paper a preliminary analysis of the data of the EPIC PN camera and of the Optical Monitor (OM) only. EPIC MOS1 and MOS2 and RGS data will be discussed elsewhere (however see Brinkmann et al. in these proceedings).
2 Results
2.1 Data Analysis
PKS 2155-304 was observed during two uninterrupted pointings
from Nov 19 (18:47:00 UT) to Nov 20 (10:47:49 UT) and from Nov 20
(13:01:39 UT) to Nov 21 (05:17:28 UT), respectively. The gap between the
two parts is 2 hrs.
In order to avoid pile-up effects due to the large flux of the source,
the PN camera was operated in the Small Window mode and the two MOS
cameras in Timing Mode (MOS1) and Small Window Mode (MOS2).
The data, processed with the
standard pipeline, were analyzed with the XMM-Newton Science
Analysis System (version 5.2.0).
A well known problem in EPIC data analysis is the background stability (e.g. Katayama et al. 2002). The background spectrum is dominated by particle events above 5 keV (e.g. Katayama et al. 2002). PKS 2155-304 emits most of its photons in the soft X-ray band so we were able to assess the stability of the background using a 1000 s binned light curve from events between 10 and 12 keV in a circular region () far from the source position (Figure 1 top). The first part of the observation has a stable background (with a mean of 10 counts per bin), while the second part shows changes times larger than the quiescent level of counts per bin. We conservatively excluded all the time intervals of the second part of the observation with background (10-12 keV) counts per bin larger than 13 (red line in Figure 1).
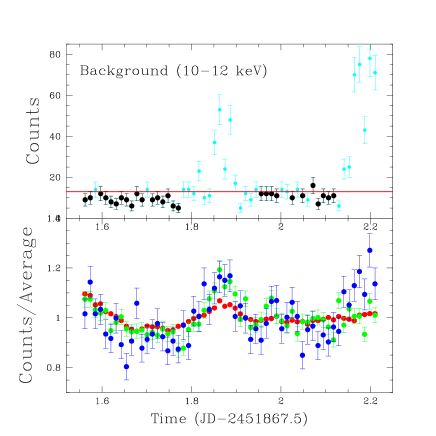
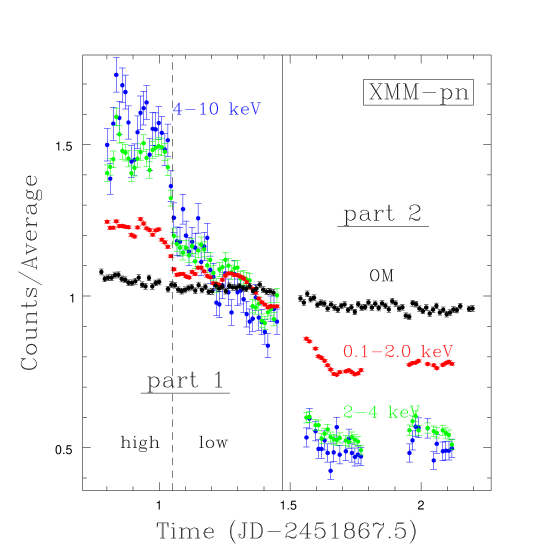
We extracted light curves in 3 energy bands, 0.1–2 keV, 2–4 keV and 4–10 keV with a bin size of 1000 s in a circular region with centered on the source position. Due to a visible trend of increasing source flux after the end of a consistent ( counts per bin) background flare (e.g. at time and in Figure 1), we conservatively excluded 3 more data points (i.e. 3000 s) after the end of such flares. The cleaned PN lightcurves normalized to their mean are presented in Figure 2 (colored points).
PKS2155-304 has been also observed with the OM using the UVW2 filter ( Å). The OM was operated in the standard imaging mode, with exposure time frames of 800 s, giving an almost continuous coverage of the target. The source counts were extracted in a circular region with and the background in a concentric annular region from to . The OM lightcurve normalized to the mean is shown in Figure 2 (black points).
Some simultaneous ground based photometry and polarimetry is available for the second part of the observation and will be presented elsewhere.
2.2 Temporal Analysis
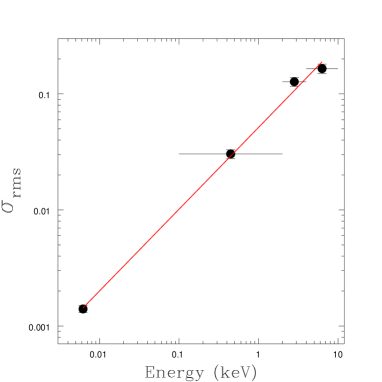
To compare the amplitude of variability in the various energy bands we calculated the normalized excess variance, (Zhang et al. 2002). This is given in Figure 3, which clearly shows that the trend of increased variability with energy found by e.g. Zhang et al. (2002), Edelson et al. (2001) in the X-ray regime extends to the UV. This trend is well modeled with a power law with and .
2.2.1 Cross-correlation
To construct the cross-correlation function (CCF) we first normalized the light curves to zero mean and unit variance by subtracting the mean count rate and dividing by the rms (root mean squared) of the light curves (e.g., Edelson et al. 2001). The CCF is measured using the Discrete Correlation Function (DCF, Edelson & Krolik 1988). The bin size of the DCF is chosen to be 1200 s. We first calculated the DCFs of the first part of the observation which is the most variable during this campaign (see Figure 2). The DCF of the 0.1–2 keV versus the 4–10 keV energy bands shows that variability in these two bands is highly correlated, and, more important, there is no detectable time lag between the two bands. This behaviour is confirmed by the DCF analysis between other X-ray bands (i.e., 0.1–2 vs 2–4 keV, and 2–4 vs 4–10 keV). The DCF of the OM versus any of the PN energy bands for the first part of the observation shows an asymmetric structure at negative lags of still unclear nature, which disappears considering the whole observation.
2.2.2 Structure Function
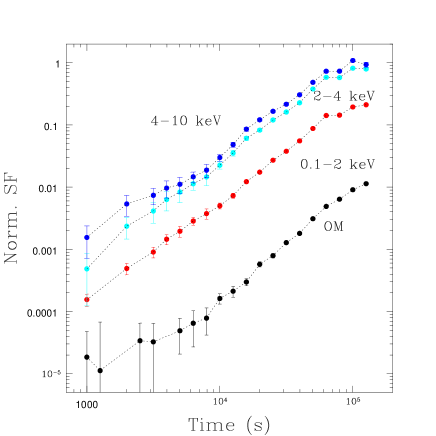
We compute the Structure Function () of each 1000 s binned lightcurve normalized to the square of the lightcurve mean, as in Zhang et al. (2002), so that the s can be directly compared. We subtract from each the contribution of the Poisson noise. The normalized s for the OM and for the 3 PN energy bands are shown in Figure 4. As expected from the trend clearly visible in Figure 2 and Figure 3, the amplitude of the variability (i.e. the normalization of the curve) increases with the energy of the lightcurve.
We fit the normalized structure functions at times s (to exclude the region dominated by the Poisson noise) with a power law model: . The best fit values for the normalization () and for the slope (), together with their errors are reported in Table 1. A fit with a broken power law model suggests a break very close to the longest sampled timescales and does not improve the fit significantly.
| Energy band | a | ||
|---|---|---|---|
| OM | 8.0 | ||
| 0.1–2 keV | 26.6 | ||
| 2–4 keV | 16.8 | ||
| 4–10 keV | 12.2 |
a In units of .
The large errorbars hide any possible dependence of the slope on the energy.
2.3 Spectral analysis
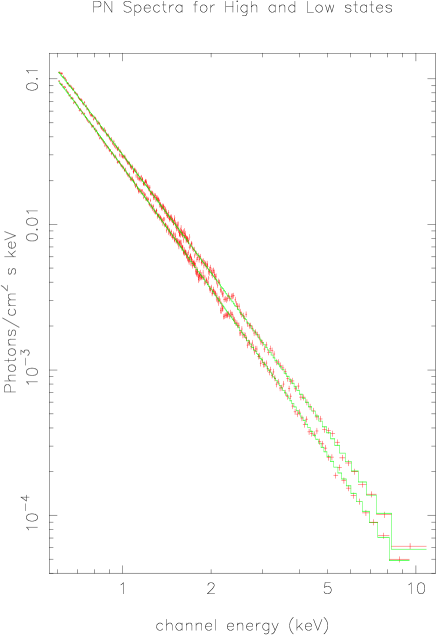
We divided the first part of the observation into two intervals: the “high” and “low” flux states (see Figure 2).
We present the first XMM-Newton EPIC spectrum of PKS2155-304. Due to unsolved problem of the calibration we restricted the analysis to the 0.6–10 keV energy range. We analyzed the spectral data using XSPEC (v.11) and the latest version of the response matrices (2001-12-11).
| High | 1.19 | |||
| Low | 1.46 |
A simple (Galactic) absorbed power-law model is clearly inadequate to reproduce the spectrum. We then used the broken power-law model, which provides a good fit, except for an evident deficit of photons close to keV. This feature is located near to the Au instrumental edge in the telescope effective area and indicates residual uncertainties in the calibration at this energy in the SW mode.
The spectral indices measured in the high state ( and ) indicate that the spectrum is steepening with energy. During the low state the data indicate a further significant steepening of the spectrum and , consistent with what is usually observed in BL Lacertae objects (Urry et al. 1997; Kataoka et al. 2000). The 2–10 keV fluxes for the two states are erg cm-2 s-1 and erg cm-2 s-1, respectively. PKS2155-304 is thus in a “low” state, similar to the 1996 Beppo-SAX observation (Giommi et al. 1998; Zhang et al. 2002).
The curved model of Fossati et al. (2000) does not improve the fit and t is not considered here.

3 Discussion
During the observation the source was monotonically dimming with some superposed flickering. The most remarkable aspect is the energy dependence of the dimming, which is a factor 3 in 4–10 keV range and 20% in the UV (Figure 2 and 3). Figure 3 shows that variability increases regularly with the energy. Moreover the structure functions indicate that the dependence with the energy holds at all the timescales. Both results are consistent with the results of Edelson et al. (2001) and Zhang et al. (2002), but here are rather apparent, and are shown to extend to the UV range.
It is noticeable that in the presence of such a clear variability/energy
dependence, the shape of the structure functions do not differ within the
errors, indicating that the same variability mechanism is operating at
all the investigated energies.
A further important point is the finding of no lags between different X-ray ranges. This is consistent with what reported by Edelson et al. (2001) in their XMM-Newton observation of PKS 2155-304, but it is an apparent disagreement with previous findings of time lags by the ASCA and BeppoSAX satellites (Kataoka et al. 2001; Tanihata et al. 2001; Zhang et al. 2002). It should be noted, however, that time lags have been found only in high-flux states, while both XMM-Newton observations found the source in a low state. Moreover, while during ASCA and BeppoSAX PKS 2155-304 was highly active and lightcurves included well defined flares, the XMM-Newton lightcurves are rather smooth, showing only slow variations. These differences could suggest that variability is driven by different mechanisms in the low and the high state. In order to assess this proposal, further observations in the X-ray/-ry domain are necessary.
Acknowledgements.
We thank Valentina Braito for valuable help in the analysis of XMM data. We acknowledge support from Italian MUIR (contract COFIN MM02C71842) and ASI (grant I-R-105-00).References
- [Edelson & Krolik(1988)] Edelson, R. A. & Krolik, J. H. 1988, ApJ, 333, 646
- [Edelson et al.(2001)] Edelson, R., Griffiths, G., Markowitz, A., Sembay, S., Turner, M. J. L., & Warwick, R. 2001, ApJ, 554, 274
- [Fossati et al.(2000)] Fossati, G. et al. 2000, ApJ, 541, 166
- [Giommi et al.(1998)] Giommi, P. et al. 1998, A&A, 333, L5
- [Kataoka et al.(2000)] Kataoka, J., Takahashi, T., Makino, F., Inoue, S., Madejski, G. M., Tashiro, M., Urry, C. M., & Kubo, H. 2000, ApJ, 528, 243
- [Kataoka et al.(2001)] Kataoka, J. et al. 2001, ApJ, 560, 659
- [Nicastro et al.(2002)] Nicastro, F. et al. 2002, ApJ, in press (astro-ph/0201058).
- [Sikora & Madejski(2001)] Sikora, M. & Madejski, G. 2001, High Energy Gamma-Ray Astronomy, 275
- [Tanihata et al.(2001)] Tanihata, C., Urry, C. M., Takahashi, T., Kataoka, J., Wagner, S. J., Madejski, G. M., Tashiro, M., & Kouda, M. 2001, ApJ, 563, 569
- [Tavecchio, Maraschi, & Ghisellini(1998)] Tavecchio, F., Maraschi, L., & Ghisellini, G. 1998, ApJ, 509, 608
- [Urry & Padovani(1995)] Urry, C. M. & Padovani, P. 1995, PASP, 107, 803
- [Urry et al.(1997)] Urry, C. M. et al. 1997, ApJ, 486, 799
- [Zhang et al. (2002)] Zhang, Y.H., et al. 2002, ApJ, in press