Optical spectroscopy of metal-rich H II regions and circumnuclear hot spots in M83 and NGC 3351
Abstract
We present optical spectroscopy of a sample of metal-rich extragalactic H II regions in the spiral galaxies M83 (NGC 5236), NGC 3351 and NGC 6384. The metal abundance, estimated from semi-empirical methods using strong emission lines, is found to be above solar for most of the objects. The sample includes a number of circumnuclear H II regions (hot spots), which are found in general to have spectral properties similar to the H II regions located in the disks. Different age estimators (equivalent width of the emission line , Balmer line absorption profiles, UV spectra) provide consistently young ages (4-6 Myr) for the hot spots.
We have detected the W-R bump feature at 4650 Å in five of the objects, and in fewer cases possibly the WC features in the red at 5696 Å and 5808 Å. Six additional objects showing W-R features are drawn from our previous work on extragalactic H II regions. From the measured luminosity of the stellar He II 4686 Å line we estimate a small number of WN stars (from 1-2 to about 30). We have compared the measured intensities and equivalent widths of the W-R bump to the predictions of recent evolutionary models for massive stellar populations. By assuming instantaneous bursts of star formation the ages derived from , between 3 and 6 Myr, are in agreement with the age span predicted by the models. The observed strength of the W-R bump is in agreement with the predictions for only half of the objects, the remainder showing lower I(4650)/I() and than the models of the appropriate metallicities. Our favored explanation is related to the finite number of stars formed in the clusters and to stochastic effects likely to be at work in star forming regions of the size considered here.
The He I 5876 recombination line is used as an indicator of the equivalent effective temperature of the ionizing clusters, . We have found that this temperature is not affected by the presence of W-R stars. From a comparison with published photoionization models based on synthetic cluster spectral energy distributions we find some evidence for an overestimation of the number of He ionizing photons in the model fluxes. In general, however, the massive star diagnostics considered in our work are in agreement with the predictions of recent evolutionary models calculated with a Salpeter initial mass function and a high upper mass limit. We find no compelling evidence for a depletion of massive stars ( 40-50 ) in the initial mass function of metal-rich clusters, contrary to our previous conclusions based on older evolutionary models.
1 Introduction
During the course of the last two decades the vast majority of Extragalactic H II Region (EHR) studies have been concentrated on high-excitation, low-metallicity objects ( 0.5 , where we adopt = 8.9). Aside from the scientific drivers of different authors mostly interested in metal-poor nebulae (high-redshift galaxies, primordial helium abundance, H II galaxies), this is in part also due to a selection effect (decreasing luminosities and emission-line equivalent widths with increasing metallicity), as well as to intrinsic difficulties in the investigation of such objects, which are related to their physical status. The auroral lines used as electron temperature () diagnostics (mostly [O III] , but also [N II] and [S III] ), and necessary for nebular abundance determinations, are routinely observed at low metallicity, but become fainter and eventually unobservable with increasing metallicity. The enhanced cooling of the gas from the metals, mainly through oxygen forbidden lines, is responsible for low equilibrium values and correspondingly weak optical [O III] lines. Therefore, ‘strong line’ semi-empirical methods for abundance measurement at high metallicity have been developed, the most widely used being that proposed by Pagel et al. (1979): = ([O II] + [O III] 4959,5007)/H. While at low metallicity these empirical abundance indicators can be directly calibrated with the available measurements (Skillman 1989, Pilyugin 2000), at high metallicity () their calibration must rely on nebular photoionization models, but different approaches may lead to abundances differing by factors of two in the supersolar regime (Edmunds & Pagel 1984, McCall, Rybski & Shields 1985, Dopita & Evans 1986, McGaugh 1991, Pilyugin 2001a). Given the fact that high-metallicity H II regions comprise the majority of star forming regions in early-type spiral galaxies and in the central regions of most late-type spirals (Vila-Costas & Edmunds 1992), this has important consequences for the study of abundance gradients and their interpretation in terms of models of galactic chemical evolution. A further complication arises from the fact that even when weak auroral lines are detected in metal-rich nebulae, their strength cannot be used directly to determine , due to the effect of temperature inhomogeneities within the nebulae, which would lead to underestimate the abundance by large factors using standard techniques (Garnett 1992, Stasińska 2001). Nevertheless, the detection of these faint lines at such metallicities provides additional constraints for photoionization models in which one attempts to reproduce the observed line intensity ratios as a function of the nebular parameters, and in particular of the element abundances.
In recent years the interest regarding metal-rich EHRs has been revived, mainly for two reasons. First, the detection of very weak auroral lines in a handful of objects has led to the determination of abundances for nebulae of solar-like metallicity, e.g. Searle 5 in M101 (, Kinkel & Rosa 1994), and CDT1 in NGC 1232 (, Castellanos, Díaz & Terlevich 2001). These studies suggest a revision of the empirical abundance calibrators currently employed, and in the case of making the derived abundances smaller by approximately a factor of two at (see also Díaz et al. 2000).
Secondly, the stellar content of high-metallicity EHRs might have different properties than those at low metallicity. This issue is related to the more general question of possible Initial Mass Function (IMF) variations in starbursts. Although there is mounting evidence that most high-excitation EHRs and H II galaxies are ionized by star clusters following a Salpeter slope IMF with a high upper mass cutoff (100 M⊙; Stasińska & Leitherer 1996, Massey & Hunter 1998, Massey 1998, Tremonti et al. 2001, González Delgado 2001), arguments for differing IMF slopes or mass cutoffs in starburst galaxies have been presented (Luhman et al. 1998, Achtermann & Lacy 1995). In the case of metal-rich EHRs, Bresolin, Kennicutt & Garnett (1999, hereafter BKG) have argued that the upper cutoff mass of the (Salpeter slope) IMF of the ionizing clusters might be as low as 30 . Using the He I 5876 line as a stellar thermometer, sensitive to the 30,00040,000 K range of the ionizing cluster effective temperature, they found that the empirical decrease in with increasing metallicity could not be accounted for simply by metallicity effects on stellar evolution models (Maeder 1990), and might be related to the absence of hot, massive stars at above-solar metallicities. Although upper mass cutoffs as low as 30 seem to be ruled out by more recent modeling of optical and mid-infrared spectroscopy of starbursts (Schaerer et al. 2000, Thornley et al. 2000), and massive stars are observed in the metal-rich Galactic center (Figer et al. 1998), there are additional indications of a decrease in the upper mass cutoffs in starbursts at high metallicity (e.g. Goldader et al. 1997, Coziol, Doyon & Demers 2001). Some discrepancies between the observed line strength ratios and the theoretical values also led BKG to suggest that the predictions of current stellar models, in particular those regarding the ionizing output during the Wolf-Rayet (W-R) phase, might need some revision (see also Crowther et al. 1999, Smith, Norris & Crowther 2002), which could make low upper cutoff masses in the IMF unnecessary to explain the observations.
To address the question of possible peculiarities of the EHR stellar content at high metallicity, we have obtained new spectrophotometry of circumnuclear H II regions, or ‘hot spots’ (Morgan 1958, Sersic & Pastoriza 1965, 1967) in the spiral galaxies M83 and NGC 3351, where the oxygen abundance is expected to be high, due to the small galactocentric distances. Additionally, EHRs located in the inner disk of these galaxies, as well as in NGC 6384, were also observed. These are also expected to be metal-rich, as indicated by studies of extragalactic abundance gradients (Dufour et al. 1980, Vila-Costas & Edmunds 1992, Oey & Kennicutt 1993, Dutil & Roy 1999). While most of the recent studies of circumnuclear H II regions have been carried out in the near-infrared, optical spectroscopy is still valuable to compare the properties derived for the hot spots with the vast amount of optical emission line studies of normal EHRs located in the disks of spirals (McCall, Rybski & Shields 1985, Vila-Costas & Edmunds 1992, Zaritsky, Kennicutt & Huchra 1994, BKG).
With its intense star forming activity, the nuclear region of M83 (NGC 5236; = 3.2 Mpc, assuming the same distance as the companion galaxy NGC 5253, Freedman et al. 2001) is one of the nearest examples of the circumnuclear starburst class of objects, which includes other recently studied nuclear hot spot galaxies, e.g. M100 (Ryder, Knapen & Takamiya 2001), NGC 2903 (Alonso-Herrero, Ryder & Knapen 2001), NGC 1512 and NGC 5248 (Maoz et al. 2001). The current understanding of star-forming nuclear rings is that they lie near the inner Lindblad resonance of a barred galaxy, where the bar-driven gas inflow causes the gas to accumulate, triggering an intense episode of star formation (Buta & Crocker 1993, Elmegreen 1994, Shlosman 1999). The overall structure of the nuclear ring in M83 emerging from spatially detailed studies at different wavelengths, mainly in the IR where the effects of dust extinction are reduced, is rather complex, with a string of hot spots distributed along an arc extending 7 arcsec (110 pc) SW of the nucleus (Gallais et al. 1991, Elmegreen, Chromey & Warren 1998, Thatte, Tecza & Genzel 2000). Within the central 300 pc, containing in molecular and atomic gas (Israel & Baas 2001), Harris et al. (2001) have identified almost 400 young star clusters from HST WFPC2 imaging. The ages that they estimate for a subsample of 45 clusters vary between 2 and 47 Myr, with a distribution supporting earlier findings of an age gradient within the star forming arc, and suggestive of a northward propagation of the star formation activity (Gallais et al. 1991, Puxley, Doyon & Ward 1997). The arc of hot spots is found to lie between two circumnuclear rings, identified from and imaging by Elmegreen, Chromey & Warren (1998) as the inner Lindblad resonances. Additional components of this complex region include the optical nucleus (the brightest source in the near IR), a possible highly-extinct second nucleus (Thatte, Tecza & Genzel 2000), a bar connecting the hot spot arc to the nucleus along the direction of the main stellar bar, and additional sites of star formation to the W of the nucleus, better observed at 10 m and at radio wavelengths (Telesco 1988) because of their high extinction.
In the nuclear region of NGC 3351 ( = 10.0 Mpc, Freedman et al. 2001) several regularly-spaced H II regions define an elongated ring arcsec ( pc) in size (Alloin & Nieto 1982). Eight main hot spots can be identified in the H images of Planesas, Colina & Pérez-Olea (1997), each with a luminosity L() erg s-1. A comparison of the ring morphology in , near-infrared (Elmegreen et al. 1997, Pérez-Ramírez et al. 2000) and UV (Colina et al. 1997) reveals slight differences. Moreover, the peaks of the CO emission (Kenney et al. 1992) show an offset from the and -band peaks. Various explanations exist for this effect, including patchy extinction from dust, stellar winds wiping out gas and dust, and aging of the stellar populations (Conselice et al. 2000, Kotilainen et al. 2000, Maoz et al. 2001).
Previous attempts to characterize the stellar populations of circumnuclear hot spots have suggested the presence of some peculiarities when compared with disk H II regions. Kennicutt, Keel & Blaha (1989) noted that the stronger stellar continua relative to the emission-line luminosity observed in hot spots could be a signature of an unusual IMF or, alternatively, could imply a continuous regime of star formation, rather than an instantaneous burst activity, as is commonly inferred for disk EHRs. Continuous star formation in individual hot spots seems to be ruled out by more recent studies. Kotilainen et al. (2000) favor instantaneous burst models with ages of 6 Myr to reproduce their Br equivalent width measurements (see also Ryder, Knapen & Takamiya 2001). For the galaxies examined in this work, hot spot ages of 10 Myr or younger are derived on the basis of near-infrared colors (Elmegreen et al. 1997; Elmegreen, Chromey & Warren 1998), Si iv/C iv equivalent width ratios (Colina et al. 1997), and near-infrared CO line equivalent widths (Thatte, Tecza & Genzel 2000). However, unusual stellar mass spectra have not been firmly ruled out.
In this paper we investigate the stellar content of hot spots and other metal-rich extragalactic H II regions. Our work is organized as follows: we describe the spectroscopic observations and the data reduction in Section 2, and discuss some of the H II region global properties (reddening, density and metallicity) in Section 3. The main nebular diagnostics are presented in Section 4, and the parameters derived for the hot spots, in particular their ages, are discussed in Section 5. In Section 6 we discuss the W-R features identified in five H II regions in M83. Finally, a comparison with evolutionary and photoionization models is carried out in Section 7. Section 8 summarizes the main results of this paper.
2 Observations and data reduction
The mappings of the nucleus of M83 by Elmegreen, Chromey & Warren (1998) and of NGC 3351 by Colina et al. (1997) and Planesas, Colina & Pérez-Olea (1997) were used to define the nuclear targets in the two galaxies. Inner disk H II regions were selected from de Vaucouleurs, Pence & Davoust (1983) and Hodge (1974), respectively. For the third galaxy in our sample, NGC 6384, H II region positions were taken from Feinstein (1997). Final target positions and slit orientations were decided on the basis of short-exposure narrow-band acquisition images taken shortly before the spectroscopic frames, by centering the slit on top of the emission peaks.
Long-slit spectra of the target H II regions were obtained with the EFOSC2 spectrograph mounted at the ESO 3.6m telescope on La Silla on May 15-16, 1999. The seeing varied between 1.5 and 2.0 arcsec during the first night, and remained constant around 1.0 arcsec on the second. The slit used was 2 arcsec wide, also in periods of unfavorable seeing conditions, as a tradeoff between light-losses and spectral resolution, and also in order to include most of the emission from the spatially extended H II regions. The spectra were obtained with three separate exposures through different grisms (no. 7, 9 and 10, all 600 gr/mm) to ensure a continuous coverage of the 3500-8000 Å wavelength range. The spectral resolution achieved is approximately 10 Å, as measured by the full width at half maximum of isolated emission lines in the reduced spectra. Exposure times varied between 600 s and 1800 s, with the longest exposures obtained in combination with grism no. 9, which covered the spectral range between 4700 and 6770 Å. Longer exposures times (up to one hour) were chosen for the three faint H II regions observed in NGC 6384. Four to five standard stars from the list of Hamuy et al. (1992) were observed each night for flux calibration.
During the observations the spectrograph was rotated to include at least two H II regions within the slit simultaneously, while at the same time keeping the position angle very close to the parallactic angle. The final sample includes 16 H II regions in M83 (of which five are hot spots), six in NGC 3351 (four hot spots) and three in NGC 6384. The position of the M83 regions is shown on top of aquisition images in Fig. 1 for the disk H II regions and in Fig. 2a for the nuclear hot spots. An HST archival (program 7577, PI: Heap) STIS visible image of the same field is shown in Fig. 3, to illustrate the distribution of the star clusters present in the region at high spatial resolution. The nuclear hot spots studied in NGC 3351 are identified in Fig. 2b. Positions relative to the galaxy center and cross identifications of all the objects are summarized in Table 1. For convenience, the H II regions in the disk are indicated by numerals, and hot spot by letters.
The reduction of the long-slit spectra was carried out using standard IRAF111IRAF is distributed by the National Optical Astronomical Observatories, which are operated by AURA, Inc., under contract to the NSF procedures, and included bias removal, flat fielding correction, and wavelength and flux calibration. For the extraction of the calibrated spectra a suitable region for sky subtraction was identified, and care was taken to add the flux from the same number of pixels along the spatial direction in all of the three sets of spectra taken with different grisms for each given object. The relative calibration of spectra of the same object taken with different grisms was made possible by the emission lines in common, i.e. (between grisms no. 7 and no. 9) and + [N II] (between grisms no. 9 and no. 10). For the emission line measurement we integrated the flux under the line profile, after identifying the continuum on both sides of the line. For the + [N II] 6548, 6583 and the [S II] 6716, 6731 blends we used the deblending option available with the IRAF splot program. The low excitation of the H II regions observed, reflecting their high metal content, is shown by the faintness of the high-excitation lines relative to , such as [Ar III] 7135 and [O III] 5007 (the latter has an average ), as illustrated in Fig. 4.
The He I recombination lines at 5876 Å and 6678 Å were measured with special care, given their importance as diagnostics in low excitation nebulae (Kennicutt et al., 2000). In most of the disk H II regions the measurement of He I 5876 presented no particular difficulty, but in a few nebulae with stronger continuum, particularly in most of the hot spots, the emission line is contaminated by stellar absorption features, most notably the Na I D line at 5890 Å (which can also have an important interstellar component). A comparison with stellar spectral atlases shows that the main responsible for these features are late-type giants, and their presence can make the measurement of He I 5876 in emission very uncertain. In such cases we preferred to measure only the 6678 line, when present, or to estimate an upper limit for it, on the basis of the random noise fluctuations in the continuum adjacent to the line. An equivalent width of 0.5 Å was assumed for the stellar absorption component of the He I lines.
For the computation of the extinction by dust by means of the Balmer decrement (Osterbrock 1989) the contamination of the emission line spectra by an underlying stellar absorption component must be taken into account. The presence of stellar absorption features is particularly evident in the case of the hot spots, where, with respect to what is normally found in EHRs, an additional stellar component is seen, because of the contribution to the total light coming from the bulge stellar population. This is illustrated in the lower plot of Fig. 5, which displays two representative spectra from our H II region sample, one being an M83 disk H II region with low continuum, the second a nuclear hot spot (M83 B) showing, in addition to the higher-order Balmer and He i lines in absorption, originating from young O, B and A stars, also a series of prominent metallic absorption features from the older stellar population in the galactic bulge. The most conspicuous are the K Ca ii 3933 Å, the G band at 4301 Å and the Mg i + MgH 5175 Å lines. Their equivalent widths are useful as metallicity and age indicators of galactic stellar populations (Bica & Alloin 1987, Bica 1988), and are often used, with the aid of appropriate nuclear galaxy spectral templates among those published by Bica (1988), to measure the contribution of different age and metallicity components to the integrated light of galaxies and clusters. Recent applications of stellar population synthesis using a base of star clusters can be found in Raimann et al. (2000) and Saraiva et al. (2001). We have compared our equivalent width values (See Table 2) with those reported by Bica (1988) for different spectral templates, and found that they are in most cases considerably lower than those of his class S7, which has the smallest equivalent widths for the metallic lines, indicating a considerable dilution by the continuum from the young stars. The integrated values measured in the central 10″ 20″ of M83 and NGC 3351 (thus including the circumnuclear ring of star formation) by Storchi-Bergmann, Kinney & Challis (1995) are also a factor 1.4 to 3.8 larger than those found here, as a result of the bulge contribution included in the larger aperture. Lacking an appropriate template for the comparison, we opted for the traditional method of deriving the contribution for the underlying stellar population (see McCall, Rybski & Shields 1985), for both the disk H II regions, as well as the hot spots. An iterative procedure was used to determine what values of the underlying equivalent width of the Balmer lines in absorption (), assumed to be equal for all Balmer lines, allowed us to recover simultaneously the case B / and / emission line ratios (Hummer & Storey 1987) for a given reddening , assuming and the Seaton (1979) Galactic extinction law. The values thus derived span a wide range, from 0 Å up to 4.4 Å, with the hot spots not showing particularly large values when compared to the disk EHRs. The absorption equivalent widths are summarized in Table 3 (Column 3), together with the reddening-corrected line fluxes for the measured lines, normalized to = 100 (Columns 4-12), the reddening (Column 2) corrected for the Galactic foreground (based on Schlegel, Finkbeiner & Davis 1998) and the emission line equivalent widths (Column 13). In the case of emission lines which are theoretically expected to be in well-defined ratios to brighter lines, i.e. [O III] 4959 and [N II] 6548, we report only the measurement of the brightest line of the pair, namely [O III] 5007 and [N II] 6583. Uncertainties in the tabulated values are estimated to be 5% for the bright lines ([O II] 3727, [O III] 5007, He I 5876, [N II] 6584, [S II] 6717,6731), and between 10% and 20% for the fainter lines ([O I] 6300, He I 6678, [Ar III] 7135).
3 Analysis of global properties
3.1 Reddening
Looking at Column 2 in Table 3, we notice no significant difference in between disk H II regions (average 0.36) and hot spots (average 0.41). The mean value 0.38 is comparable to that measured by Ho, Filippenko & Sargent (1997) in H II regions located in galactic centers, and which they found to be not significantly larger than the average reddening in the EHRs studied by McCall, Rybski & Shields (1985). Oey & Kennicutt (1993) considered EHRs in early-type spirals, finding that their typical metallicity (mean ), based on the calibration of Dopita & Evans (1986), is a factor 1.5 larger than for the objects in the McCall, Rybski & Shields (1985) sample. Nevertheless, the reddening in the two samples is comparable, being in fact somewhat smaller in the early-type galaxies. The relatively low value of in the nuclear zone of M83, despite its high metallicity, was already noted by Storchi-Bergmann, Calzetti & Kinney (1994), indicating that other factors beside metal abundance determine the amount of extinction, such as the galaxy inclination to the line of sight and the geometrical distribution of dust within the star forming regions.
In the H II regions located in the proximity of the M83 nucleus heavy and patchy extinction by dust ( mag) is inferred from mid-IR observations (Turner, Ho & Beck, 1987; Rouan et al., 1996). In the band Thatte, Tecza & Genzel (2000) derived a wide range of extinction values, from 0.5 mag up to 9.2 mag. The fact that the optically derived extinctions are much lower (generally 2 mag) is an indication of the various depths probed at different wavelengths, the mid-IR reaching far more into the star forming regions then the near-IR and the optical, and that the optically measured regions are very heavily weighted to regions with the lowest extinction. A similar effect has been found in other nearby starbursts, as in, for example, He2-10 (Beck, Kelly & Lacy 1997).
While there seems to be no direct evidence for a connection between metallicity and amount of extinction as derived from the Balmer decrement, it is legitimate, however, to ask the question whether dust can affect the emission-line spectra of metal-rich H II regions in other ways, especially if the gas-to-dust ratio is increasing with metallicity. The work by Shields & Kennicutt (1995) in fact showed that the depletion of heavy elements onto dust grains can have measureable effects on the emission line spectra of metal-rich H II regions. The removal of gas coolants and the selective absorption of continuum photons at wavelengths longer than the Lyman limit combine to increase the equilibrium temperature of nebulae at high metallicity, with the result that low-ionization emission lines are enhanced with respect to the dust-free case. Since the impact of this effect is expected to be stronger in the high metallicity regime, this would provide a natural explanation for the enhanced [N II] and [S II] line intensities measured in H II regions in the nuclei of normal galaxies (Kennicutt, Keel & Blaha 1989; Ho, Filippenko & Sargent 1997). As we will see in Section 4, a weak effect might be present in the low-ionization lines measured in the hot spots in M83 and NGC 3351, which could be attributed to depletion by dust.
3.2 Density
The analysis of the density-sensitive ratio [S II] 6716/[S II] 6731 shows that disk H II regions and hot spots are well separated into two distinct sequences, as seen in Fig. 6, which plots the [S II] doublet ratio as a function of . The electron density in hot spots, derived from the observed ratios using the analytical formulae of McCall (1984), is on average approximately 400 cm-3, about six times larger than in disk H II regions. The average value for the latter is in good agreement with that found in the larger EHR sample of BKG. Such a difference is in general expected to have only a secondary effect on nebular emission properties, which explains why the diagnostic diagrams such as those in Fig. 8 (next Section) show no clear separation of disk and circumnuclear H II regions. It has been shown by Oey & Kennicutt (1993), however, that at high metallicity density can have an important effect on the collisional de-excitation of the fine-structure lines, which leads to an increased uncertainty in the abundance scale. The metallicities derived in the following section must therefore be taken with some care, although the relative values should still be reliable.
3.3 Metallicity
The question of how metal-rich the objects in our sample are does not have a simple and unique answer. These EHRs belong to the lowest end of the extragalactic H II region excitation sequence (see Fig. 4), and as a result of the increased metal abundance most of the cooling of the nebular gas occurs via fine structure infrared lines, such as the [O III] 52,88 m lines. The consequent unobservability of the -sensitive auroral lines in the optical forces us to use semi-empirical or theoretical approaches to estimate the chemical composition. Several semi-empirical abundance techniques can be found in the literature, employing different ratios of relatively bright nebular lines. For the widely used , originally proposed by Pagel et al. (1979), different authors have provided calibrations which might differ systematically at the high-metallicity end ( 0) by up to 0.2-0.3 dex (Edmunds & Pagel 1984; McCall, Rybski & Shields 1985; Dopita & Evans 1986, see the comparison in McGaugh 1991). Additional empirical methods have been proposed, including [O III] 5007/[N II] 6583 (Alloin et al. 1979, Dutil & Roy 1999), [N II]/ (van Zee et al. 1998), and [N II]/[O II] (van Zee et al. 1998, see also Dopita et al. 2000). In general, however, at high metallicity (solar and above) the calibration of these methods depends on a scant number of observations and on photoionization modeling (for example, the M101 H II region Searle 5 in the case of the Edmunds & Pagel 1984 work), and their reliability is often questioned. Typical uncertainties of 0.1-0.2 dex are normally quoted for abundances derived with these empirical methods at high metallicity, but the systematic differences mentioned above imply an uncertain absolute abundance scale, dependent on the choice of the semi-empirical calibration. Obviously, any comparison with metal-rich H II regions in the literature must take this choice into account. Recent work on metal-rich EHRs with measureable auroral lines by Castellanos, Díaz & Terlevich (2001) has shown indications that empirically determined abundances might be severely overestimated, by up to a factor of three (see also Pilyugin 2001b). The upper branch of the vs. relation (their Fig. 9), based on their new data and on the theoretical modeling of M51 H II regions by Díaz et al. (1991), has either a flatter slope or a systematically lower zero-point than the commonly adopted semi-empirical calibrations, such as those of McCall, Rybski & Shields (1985) or Edmunds & Pagel (1984).
In this paper we adopt the analytical expression reported by Kobulnicky, Kennicutt & Pizagno (1999), which is based on the photoionization models calculated by McGaugh (1991), and in which both [O III] 4959,5007/[O II] 3727 and are used to simultaneosuly contrain and the ionization parameter . This calibration is in good agreement with the experimental data and the photoionization models shown by Castellanos, Díaz & Terlevich (2001) at high abundance, and has an estimated uncertainty of 0.1 dex. The McGaugh models show a relative insensitivity to the ionization parameter and to the stellar effective temperature in the metal-rich regime. Empirically, at high metallicity the spread in is found to be rather small, with high-abundance EHRs having, on average, (van Zee et al. 1998), or a somewhat smaller value, based on the [S II]/[S III] line ratio (, from the BKG data), or the [O II]/[O III] and [S II]/ ratios of the current sample, based on the calibrations given by Díaz et al. (2000) and González Delgado et al. (1999b), respectively ().
There are some additional caveats to consider in the use of the strong line method at high abundance, as summarized by Stasińska (1999, cf. ). The McGaugh (1991) models assume unevolving ionizing star clusters, whereas the effects of evolution on the oxygen line strengths predicted by synthetic models are rather profound at high metallicity. This is due to the extreme sensitivity of the electron temperature and the [O III] 5007 line intensity to changes in nebular geometry, density and mean effective temperature in this abundance regime, making the strong line method very uncertain at supersolar metallicities. Abundances based on the auroral lines will be even more significantly affected. That the thermal equilibrium of metal-rich nebulae is affected by the electron density was pointed out in the study of high-abundance H II regions of Oey & Kennicutt (1993). On the other hand the boosting of the [O III] 5007 line due to the appearance of W-R stars could be overestimated in the models, since the observations (see Section 7) show that is hardly affected by the presence of W-R stars.
We have verified that all of our H II regions belong to the upper branch of the -abundance relationship, by using the [N II]/[O II] line ratio, which monotonically increases with abundance (McGaugh 1994). The oxygen abundances determined in this way are listed in Column 14 of Table 3. A comparison with existing semi-empirical calibrations show significative systematic differences. For example, the mean oxygen abundance of our sample using the McGaugh theoretical calibration is = 9.05. The calibration by Edmunds & Pagel (1984) gives a mean of 9.31, but the revised calibration at high abundance by Edmunds (1989), adopted in the abundance gradient work of Vila-Costas & Edmunds (1992), lowers it to 9.14, more in agreement with the McGaugh calibration. The two methods agree at the lower abundance end (around solar), while at the higher end they differ by up to 0.2 dex. As a comparison, both the abundances obtained for our sample H II regions using the two calibrations are given in the last two columns of Table 3 (MG for McGaugh 1991, and E for Edmunds 1989). Considering additional bright line methods, the [O III]/[N II] line ratio calibrated by Dutil & Roy (1999) gives a mean abundance = 9.20, and the -method of Pilyugin (2001a) provides an average of 8.76.
As shown in previous work in M83, the H II regions trace a shallow radial abundance gradient, and Table 3 shows on average slightly higher abundances in the inner H II regions and the hot spots than in regions further out. The radial coverage is however too small for a determination of the overall radial abundance gradient in this galaxy. With the adopted calibration the abundance in the nucleus is 1.5 . An early investigation of six H II regions in M83 by Dufour et al. (1980) found much higher values, up to 4-5 , from a differential analysis based on theoretical models of the [O II] and [O III] lines. A comparison of the observational data with more recent grids of H II region models (e.g. Dopita et al. 2000) suggests considerably lower values, on the order of 2 , consistent with our result. The central value quoted by Vila-Costas & Edmunds (1992), based on a fit to the optical data of Webster & Smith (1983) and Dufour et al. (1980), is = 9.24 (2.2 ). A similar result is obtained from the work of Zaritsky, Kennicutt & Huchra (1994). Considering the differences in empirical calibrations previously discussed, this is in rough agreement with our result. The radial abundance gradient traced by the H II regions observed by us and from previous work is illustrated in Fig. 7. Here the oxygen abundances from the data published by Dufour et al. (1980, squares) and Webster & Smith (1983, triangles) have been calculated using the same Kobulnicky, Kennicutt & Pizagno (1999) empirical calibration adopted for our data.
In NGC 3351 the uniformity in abundance for the observed H II regions is consistent with previous studies (e.g. Zaritsky, Kennicutt & Huchra 1994, Dutil & Roy 1999), which measured no significative abundance gradient in the inner parts of this galaxy. The central value from our measurements and the adopted abundance calibration is 1.6 (2.6 with the Edmunds 1989 calibration). Finally, the three objects observed in NGC 6384 have a roughly solar abundance, in agreement with the work of Oey & Kennicutt (1993).
4 Diagnostic diagrams
We present here some general properties of our H II region sample, as derived from some standard diagrams which are recognized as helpful diagnostics of the nebular physical conditions. These are often used to help discriminate between nebulae photoionized by massive stars and those involving nonstellar mechanisms (i.e. AGNs, Veilleux & Osterbrock 1987). Recent applications of this technique can be found, among others, in van Zee et al. (1998), Martin & Friedli (1999), BKG, Kennicutt et al. (2000), Barth & Shields (2000), and Contini et al. (2002). The excitation sequence is shown in terms of [N II]/ vs. [O III] and [S II]/ vs. [O III] in Fig. 8. In this and in all following plots we have used filled circles for disk H II regions and open circles for circumnuclear hot spots. The squares represent the data points taken from the galactic H II regions studied by Kennicutt et al. (2000), while the triangles represent the EHR sample of BKG, shown here as comparison samples. The two sequences in Fig. 8 show how our new extragalactic sample well matches the low-excitation, low- end of the galactic H II region sequences and of the known sequences of EHRs. This indicates that young and massive stars are the primary photoionization source for the whole sample. The plots suggest that the hot spots might have a somewhat enhanced [N II] and [S II] emission, as predicted by the Shields & Kennicutt (1995) models, but the effect, if real, is very small (0.1 dex). This is in contrast with the results obtained by Ho, Filippenko & Sargent (1997) in nuclear H II regions, which show clear signs of enhanced emission in the low-ionization lines (see also Kennicutt, Keel & Blaha 1989). In the specific case of the hot spots, we reach the conclusion that they are, generally speaking, virtually indistinguishable from disk EHRs in terms of their emission line spectra, and, although located in regions of somewhat extreme physical conditions like the nuclear zone of spiral galaxies, they do not share some of the anomalous properties of H II nuclei nor do they show strong effects due to dust at high metallicity.
To verify this interpretation we have calculated a small set of simple photoionization models with Cloudy (Version 94.0, Ferland 1997). CoStar atmosphere models at solar metallicity and interpolated for stellar temperatures = 36,000 K and = 37,000 K (Schaerer & de Koter 1997) provided the ionizing fluxes. To gauge the effects of density and depletion by dust on the predicted emission line fluxes, we calculated models at two different densities, = 70 and = 400 cm-3, to match the values derived from the sulphur doublet for disk and hot spot H II regions, respectively. The average depletion factors of the ISM and the silicate-graphite grain properties were taken to be the defaults allowed by Cloudy (see Ferland 1997 for further details). The ionization parameter was set to for a spherical geometry. The effects of dust on the = 70 cm-3 models at the two stellar temperatures are shown by the two arrows, while the short, steeper lines show the effect of changing the electron density from 70 to 400 cm-3. While the displacement in the plots due to density changes occurs mostly along the excitation sequence, dust works in the sense of increasing the [N II] and [S II] emission, as shown by Shields & Kennicutt (1995, cf. also the model predictions in the work of ). The observed line intensity ratios in the hot spots seem therefore compatible with only a mild effect by dust depletion.
Fig. 9 shows the observed trend of two diagnostics of the ionizing stellar population, [Ar III] 7135/ and the equivalent width of , , as a function of . The additional data points (open triangles) are taken from the EHR sample measured by BKG. Less than half of the objects in our new sample had a measurable argon emission line, but the overall trend shown in Fig. 9(a) is indicative of a clear excitation gradient with abundance. A weak trend is also seen in the lower plot, which shows , corrected for the underlying stellar absorption, vs. abundance. The larger scatter shows the well-known sensitivity of to the age of the stellar population responsible for the ionization of the gas, in addition to the ionizing radiation field (in an evolving star cluster these effects are linked to one another). The data points, however, suggest a rather well-defined upper boundary in the plot, which likely corresponds to the location of the youngest objects, since is predicted to decrease with time (and with increasing metallicity) by current evolutionary models (Cerviño & Mas-Hesse 1994, Schaerer & Vacca 1998, hereafter SV98).
The presence of a -metallicity gradient is perhaps best estimated (for 36-38,000 K) by plotting the intensity of neutral helium lines relative to as a function of , as we have done in Fig. 10, where the data for the He I 5876 lines are shown. The empirical He I line calibration as a function of from Kennicutt et al. (2000) provided the data for the horizontal lines, which approximately correspond to = 33,000, 34,000 and 36,000 K. At 38,000 K the optical He I lines do not provide information on , due to their saturation (all helium becoming ionized, Doherty et al. 1995). According to the diagram in Fig. 10 decreases to 34,000 K at about 1.5 times the solar abundance, but the absolute abundance scale is subject to the uncertainties mentioned previously. A similar trend was shown by BKG, although with a smaller number of extragalactic H II regions in the high-metallicity regime. Their He I 5876 measurements are represented by the open triangles in Fig. 10, where only data belonging to the upper branch (high metallicity) of the -abundance relation are shown. In Section 7.4 we will comment on the implications of this result for the properties of the ionizing cluster stellar population.
5 Properties of the nuclear hot spots
We have established in the previous section that the hot spots can be regarded as being mostly ‘normal’ EHRs when we consider their emission-line properties. We analyze here their stellar content in some further detail.
As mentioned in Section 1, the hot spots in M83 and, to a lesser extent, those in NGC 3351, have been fairly well studied with infrared imaging. The complex morphology of the M83 nuclear region in the near-IR, which is similar to the one in the optical, has been described by Gallais et al. (1991) and Elmegreen, Chromey & Warren (1998), who have identified the galaxy nucleus and the arc of star-forming regions 7 arcsec SW of the nucleus as the main emission sources. At longer wavelengths the picture is however very different, with two bright sources located in a bar-shaped feature appearing NW of the nucleus at 10 m and 6 cm (Telesco, 1988), both having a faint counterpart in the visible and in the near-IR. Our optical spectra were centered on peaks corresponding to some of the near-IR peaks studied by Elmegreen, Chromey & Warren (1998), and Table 1 provides the identification number from their paper in the last column. The mass of the individual nuclear H II regions has been estimated in the range 1-4 in M83 (Elmegreen, Chromey & Warren, 1998) and 1-10 in NGC 3351 (Elmegreen et al., 1997) from their near-IR colors. These authors point out that the regular spacing of the hot spots along circumnuclear rings is consistent with models of large-scale gravitational instabilities. Gallais et al. (1991) and Rouan et al. (1996) also suggested that star formation propagating along the circumnuclear ring of H II regions in M83 could be a possible explanation for the observed trend of the and colors along the ring itself. This would imply an age gradient along the star forming arc. It would be interesting to test this idea with the current optical spectra, however the determination of H II region ages from optical spectra can be rather uncertain. We have considered two different age indicators from the nuclear hot spot spectra: the equivalent width of the emission line, and the profiles of the Balmer series absorption lines.
In Table 3 one hot spot (M83 A), which corresponds to the position of region no. 8 in the -band image of Elmegreen, Chromey & Warren (1998), stands out among all others in the current sample by having the largest equivalent width, = 31 Å, as opposed to values beteween 6 and 10 Å for the remaining four in M83, and 8 to 16 Å for the four in NGC 3351. The small range observed in suggests that all of the hot spots, except M83 A, have approximately the same age. The comparison with the high-metallicity (2 ), instantaneous-burst models of SV98 ( = 120 , Salpeter slope) indicate an age of 5 Myr for M83 A and 7 Myr for the remaining objects. A younger age for M83 A would be consistent with the possible detection of W-R stars in it (see Section 6), and with the UV spectra discussed below. The circumnuclear H II regions in NGC 3351 appear somewhat younger then the M83 hot spot regions on average, around 6 Myr. Also note that in both galaxies only for the younger objects ( 16 Å) we detect the He I 5876 emission line. According to the results of photoionization models coupled with evolutionary models (González Delgado et al. 1999b, Stasińska, Schaerer & Leitherer 2001) in the instantaneous burst scenario the forbidden lines, such as [O III] 5007, and the He I recombination lines (He I 4471, 5876) are expected to fade as the ionizing clusters evolve (monotonically for the He I lines at all metallicities), becoming unobservable about 6-7 Myr after the onset of the star formation episode, as a result of the softening of the radiation field after the highest mass stars have disappeared. In a continuous regime of star formation, on the contrary, these lines would maintain an equilibrium, roughly constant ratio to the emission line, close to the zero-age value. The detection of He I 5876 only for larger values might therefore be interpreted as an argument in favor of the burst mode of star formation.
As mentioned in Section 2, the presence of the higher order Balmer lines and He I lines in absorption in the optical spectra of the circumnuclear H II regions is a signature of young stars of type O, B and A, which contribute to most of the blue continuum. These features are seen in the integrated spectra of starbursts (Vacca & Conti 1992, Storchi-Bergmann, Kinney & Challis 1995) and of some EHRs (González Delgado & Peréz 2000). To estimate the ages of the hot spots from these lines we have performed fits of the observed profiles of the absorption components of the Balmer lines to the evolutionary synthesis models of González Delgado, Leitherer & Heckman (1999). For the lower-order stellar Balmer lines, often filled by nebular emission, we restricted our analysis to the profiles in the line wings. An example of the procedure is shown in Fig. 11, where we show the normalized observed profiles of M83 B in four different spectral ranges, centered on , , and the next higher-order Balmer lines. The spectra were rectified adopting the continuum windows defined by González Delgado & Leitherer (1999). The instantaneous burst, solar metallicity, Salpeter IMF models are shown for ages of 4, 6 and 8 Myr, and their spectral resolution has been degraded to match the resolution of our data. Although the best fit is obtained with the 6 Myr model, the quality of the data does not allow us to put tight constraints on the ages, even if values larger then 10 Myr are ruled out. We obtain similar results for all the remaining hot spots in M83, except for M83 A, for which the model fits suggest an age of 4 to 5 Myr, albeit with large uncertainty, since even the high-order Balmer lines are filled with emission. This result is in overall agreement with the estimate obtained from . Observations at higher spectral resolution would allow us to put tighter constraints on the derived ages. It is worthwile to mention that fits of similar quality can be obtained with continuous star formation models, and discriminating between the two star formation modes (burst vs. continuous) is not possible based on this kind of analysis alone. Similar conclusions were reached by Böker et al. (2000), who applied the same method to date the nuclear star cluster in the starburst galaxy NGC 4449. Our previous considerations on the strength of the He I lines, however, rule out the possibility that in the single hot spots star formation proceeds continuously. The possibility remains that in the circumnuclear region as a whole star formation is sustained for long periods of time by the bar-driven gas inflows near the inner Lindblad resonance. Star formation possibly extending for several hundreds of Myr has in fact been suggested for the circumnuclear rings of NGC 5248 and NGC 1512 by Maoz et al. (2001).
Our age estimates are in good agreement with other studies. From HST broad-band imaging Heap et al. (1993) found several OB star clusters in the nuclear region of M83. A large number of these clusters is visible in the STIS image shown in Fig. 3, and we identify them as the ionizing sources of our hot spot H II regions. Heap et al. (1993) derived ages of 2 to 6 Myr, based on the dereddened cluster colors. This result is confirmed by the multi-band HST imaging of the nuclear clusters obtained by Harris et al. (2001), who found a peak in the age distribution between 5 and 7 Myr. The hot spots studied here correspond to clusters with ages of 5 to 6 Myr, with the exception of M83 A, which contains clusters having ages between 1 and 5 Myr. Studies of the infrared band emission peaks (Elmegreen, Chromey & Warren, 1998; Thatte, Tecza & Genzel, 2000) indicate ages younger than 10 Myr for the main star forming regions in the nucleus of M83. Finally, based on IUE spectra of NGC 3351, Colina et al. (1997) report ages of 4–5 Myr from model comparisons of the measured Si iv/C iv equivalent width ratio.
We also note that in M83 the hot spot ages are confined within a rather limited time interval, suggesting a burst of star formation about 5-7 Myr ago, and that very young ages ( 3 Myr) are not observed. This might also be the result of a selection effect or be related to a minimum time required for the bright, optically selected hot spots to burst out of their parental molecular clouds and become visible, explaining while hot spots in M83, NGC 3351 and other galaxies seem to posses roughly the same ages, as judged by their low . The M83 images presented by Harris et al. (2001) show that the regions occupied by our hot spots are relatively free of dust lanes, probably as an effect of the star forming episode itself, but the general distribution of the dust is very complex, being possibly mixed with the gas, and we cannot exclude the presence of highly extinct younger star forming regions.
5.1 UV spectra
To further characterize the stellar population in the hot spots, we show in Fig. 12 a portion of the rectified vacuum-UV spectra of three star clusters located in the circumnuclear ring of M83, centered on the resonance Si iv 1400 and C iv 1550 lines. These lines are among the most important stellar features observed in the UV, being direct indicators of the presence of massive stars, whose strong winds determine the distinctive blueshifted absorption or P Cygni line profile in the UV resonance lines (Walborn, Nichols-Bohlin & Panek 1985). Several recent papers concentrating on the UV spectra of starbursts in nearby galaxies observed with HST (González Delgado et al. 1999b, Johnson et al. 1999, 2000, Origlia et al. 2001, Tremonti et al. 2001) have greatly contributed to our understanding of starburst activity in galaxies (see Leitherer 2001 for a recent review).
Ultraviolet spectra from IUE and the Hopkins Ultraviolet Telescope with apertures covering the whole starburst ring in M83 and NGC 3351 have been available for some time (e.g. Bohlin et al. 1983). The large Si iv and C iv equivalent widths measured from these spectra, both on the order of 10 Å, are consistent with those found in metal-rich environments (Storchi-Bergmann, Kinney & Challis 1995, Heckman et al. 1998). The Space Telescope Imaging Spectrograph (STIS) MAMA detector data in Fig. 12 allow us to isolate some of the individual compact star-forming clusters. The original data, obtained with the G140L grating and the 52″2″ slit, were retrieved from the STScI archive (program 8785, PI: Heap). The spectra in Fig. 12 represent three clusters encircled in the optical hot spot M83 A. The blueshifted absorption components of the Si iv and C iv lines are a signature of the presence of massive stars also in this high-metallicity environment. The fact that P Cygni profiles are present in both lines indicate the presence of OB supergiant stars (Leitherer, Robert & Heckman 1995), which in an instantaneous star formation scenario appear approximately 3 Myr after the burst. The similar aperture geometry between our 2″ long slit spectra and the STIS spectra, obtained with the slit centered on the three clusters (whose dimensions are much smaller than the slit size), helps in the comparison of the optical with the UV spectra, where the three clusters are well separated in the spatial direction. In Fig. 12 synthetic spectra from the Starburst99 package (Leitherer et al. 1999) are displayed as a comparison. We show only solar metallicity, instantaneous burst models calculated with a Salpeter IMF with lower and upper mass limits = 1 and = 100 , since for the estimated ages the UV spectra are rather insensitive to the IMF parameters.
The age of the models shown in Fig. 12 is 3.5, 4 and 4 Myr, from top to bottom, while somewhat younger ages (by approximately 0.5 Myr) are inferred from the models which use the 2 stellar tracks. Part of the differences between the observed spectra and the synthetic ones can be attributed to a metallicity mismatch between the M83 clusters and the Starburst99 models, which were calculated including UV stellar templates at slightly subsolar chemical composition. A significant metallicity dependence is seen in the strength of the UV lines when comparing stellar libraries at 0.25 and (Leitherer et al. 2001), so we can expect a similar effect between the current models and supersolar abundance cluster spectra. An enhanced wind opacity in higher metallicity OB-type supergiants leads to higher mass-loss rates, and in a possible increase of the terminal velocity (Kudritzki & Puls 2000). An increased metal content would strengthen the photospheric lines, e.g. the Fe v lines at 1360-1380 Å, Si ii 1526,1533 and Fe iv 1533, which can contaminate the blue profiles of the wind lines. Blanketing from photospheric metallic lines (mostly iron in different ionization stages) might also be responsible for the depression of the continuum around 1450 Å.
In summary, the strength of the observed resonance lines and the model comparison provide evidence for the presence of massive stars and for young ages in the clusters observed in the UV. In particular, the hot spot M83 A contains three clusters with similar ages (4 Myr), a result which is consistent with the optically-derived age. At this age the Geneva stellar models predict the presence of 30-35 supergiant stars (B0 I), which tells us that the IMF must extend at least up to this mass.
6 W-R features
The study of W-R stars, the direct descendants of massive O stars, in star forming regions plays an important role in constraining population synthesis and evolutionary models of massive stars and burst properties (age, star formation rate, IMF; Cerviño & Mas-Hesse 1994, Meynet 1995, SV98, Leitherer et al. 1999, Mas-Hesse & Kunth 1999). In the optical spectra of nearby starbursts the most commonly observed feature of these stars is the broad ‘blue bump’ around 4650 Å, which includes broad stellar emission lines such as the He II 4686 and N III 4640 from WN stars (Conti 1991). At longer wavelengths, the C III 5696 and C IV 5808 emission lines, originating in WC stars, can also be observed, although their detection is usually more difficult (Schaerer, Contini & Pindao 1999). The investigation of W-R features in metal-rich H II regions is of particular interest, since the number of W-R stars relative to the O star population is expected to increase with metallicity on the basis of evolutionary models (Meynet 1995), as a result of the decrease of the minimum mass required for an evolving massive star to develop the W-R phase (between 21 and 32 at high metallicity, depending on mass loss rate, Maeder & Meynet 1994). Observations of starbursts with high chemical composition (solar and above) are consistent with this expectation (Guseva, Izotov & Thuan 2000, Schaerer et al. 2000).
We report here on the possible detection of the W-R bump in five of the H II regions we observed in M83. H II region M83-3 is one of the three objects in which Rosa & D’Odorico (1986) detected the presence of W-R stars, and corresponds to the position of supernova SN 1950b. The remaining three disk H II regions (M83-2, 5, 9) and the hot spot M83 A would be new detections. The corresponding spectra around the W-R features are shown in Fig. 13. For better clarity in the plot the flux scale is different for all objects. The wavelength of several lines of stellar origin are indicated, including N III 4640, N V 4604,4620 and the broad He II feature at 4686 Å. The right panel shows the region around 5800 Å, where features originating in WC stars are found, namely C III 5696 and C IV 5808. The detection of features in this wavelength range remains uncertain for most objects, although in at least one case the evidence for a detection of C III and C IV is rather convincing.
In the following we provide some brief comments about the five objects whose spectra are displayed in Fig. 13. To estimate the dominant W-R types we have adopted the classification scheme of Smith (1968, see also for the WN stars).
M83-2: the S/N ratio of the spectrum is very low. We estimate an extinction-corrected flux in the He II 4686 line erg cm-2 s-1. At the adopted distance of M83 this translates into a luminosity erg s-1. Here and in the following discussion we adopt a typical WNL star luminosity erg s-1 (SV98), and assume that all the flux in the He II 4686 line originates in WN stars. Our measurement is consistent with the presence of only one or two WN stars in this H II region.
M83-5: the similar intensity of N V 4604,20, N III 4640 and He II 4686 suggests an intermediate mean WN5 or WN6 type. From erg s-1 we estimate 3 WN stars. This is the H II region where the detection of WC stars is more convincing. Both C III 5696 and C IV 5805 are present. Their intensity ratio is approximately equal to one, which suggests a late W-R type, perhaps WC8.
M83-9: the single components of the blend in the blue cannot be separated. We estimate N III He II, which gives a He II luminosity erg s-1 (10 WN stars). The N IV 4058 line is detected, with an intensity relative to N III 4640 of 0.2. These observations suggest a mean WN8 type. No WC line is detected in the red.
M83 A: deblending of the different components of the blue bump is less uncertain in this case. N III 4640 is somewhat stronger than He II 4686, and N V 0.5 N III, suggesting a WNL type, around WN7. From the estimated number of WN stars is 31. C IV is probably not observed. The presence of absorption features at 5711 and 5783 (as seen in the templates of Bica 1988) mimic an emission feature at the position of the red bump. The presence of C III 5696 is very uncertain.
M83-3: N V is not visible, or is very faint. The relative intensity of N III and He II again suggests a WN7 or WN8 mean type, with 4 WN stars. Features from C III and C IV are not detected at a significant level, although emission at the wavelength of C III 5696 might be present.
We have estimated the fractional contribution to the total ionizing flux within the nebulae coming from the WN stars. The ionizing flux of W-R stars was assumed to be photons s-1, irrespective of subtype (SV98). The nebular ionizing flux was measured from the extinction-corrected luminosity of the emission line, assuming the density-bounded case and no loss of photons. The resulting / varies between 0.13 (M83 A) and 0.27 (M83-9). Under our assumptions, then, although WN stars make a substantial contribution to the total ionizing flux, the bulk of the ionizing photons comes from OB stars, unless several WC stars are also present. The current observations do not allow us to put credible constraints on this number based on the red bump. The implications of the small number of W-R stars present in these H II regions will be further discussed in Sect. 7.3.
7 Comparison with models and discussion
In this section we compare the observed spectral features, namely emission line ratios and equivalent widths, to the predictions of recent evolutionary and photoionization models from the literature. The recent advances in the synthesis of evolving stellar populations at different metallicities, coupled with modern photoionization codes, allow self-consistent investigations of the properties of extragalactic H II regions, starbursts and H II galaxies. The Starburst99 (Leitherer et al. 1999) and PÉGASE (Fioc & Rocca-Volmerange 1997) packages, in particular, have received a wide acceptance, and have prompted the re-analysis of the bulk properties of extragalactic emission line objects (Moy, Rocca-Volmerange & Fioc 2001, Dopita et al. 2000, Kewley et al. 2001). SV98 published a set of evolutionary models tailored to the investigation of the massive stars in young starbursts, based on the non-rotating Geneva stellar evolutionary tracks (Meynet et al. 1994, and references therein), and on the CoStar stellar atmosphere models (Schaerer et al., 1996; Schaerer & de Koter, 1997). New stellar tracks which account for stellar rotation are available from the Geneva group (Meynet & Maeder 2000, Maeder & Meynet 2001). Important changes in the stellar evolution are predicted, however none of the currently available evolutionary models include these newer tracks. The SV98 models were adopted by Stasińska, Schaerer & Leitherer (2001, hereafter SSL) in their analysis of H II galaxies. As recognized in the latter work, an uncertain aspect of most of these models is the treatment of the stellar atmospheres during the W-R phase, based, in the case of the Starburst99 and the SV98 models, on the pure helium Schmutz, Leitherer & Gruenwald (1992) models, which do not include metallicity effects on the outcoming ionizing flux. The correct treatment of metal blanketing is likely to introduce important changes in the predicted ionizing flux of stellar populations during the W-R phase (Crowther 1999, Crowther et al. 1999, BKG, Smith, Norris & Crowther 2002).
Further assumptions concern the mass-loss recipe adopted for the stellar evolutionary tracks. This choice has important repercussions on several aspects of massive star evolution. Of interest here are not only the duration of the W-R phase and the minimum mass required for stars entering this phase (increasing and decreasing, respectively, with mass-loss rate), but also the stellar extreme-UV spectrum. Recent population synthesis models often adopt the Geneva stellar tracks calculated with an enhanced mass-loss rate, i.e. twice the values given by de Jager, Nieuwenhuijzen & van der Hucht (1988) throughout the HR diagram (excluding W-R stars), with a metallicity scaling derived from stellar wind models, and /yr for WNL star (Meynet et al. 1994). For WNE and WC stars the mass-loss rates are kept fixed at the same values as in the standard case (Schaller et al. 1992). While empirical results, such as the W-R/O number ratio in regions of constant star formation, favor enhanced mass-loss rates in the pre-WR stage (Maeder & Meynet 1994), the actual mass-loss rates measured for WNL stars are lower by at least a factor of two with respect to the enhanced rates assumed in the Geneva tracks (Leitherer, Chapman & Koribalski 1997; Nugis & Lamers 2000). These rates have been considerably lowered (by a factor 2-3) in the newer tracks including rotation (Meynet & Maeder 2000).
One important aspect of mass-loss rate which is relevant for the following discussion is the fact that it controls the EUV flux (below the He II ionization edge at Å) in massive stars with expanding atmospheres. The flux can be either enhanced or decreased, depending on the wind density, by its effect on the depopulation of the He II ground state (Gabler et al. 1989). Schmutz, Leitherer & Gruenwald (1992, see also ) show that the presence of significant flux above 4 Ryd depends on relatively transparent (low ) W-R winds.
The evolutionary models considered in the remainder of this section are summarized in Table 6, where we indicate their main ingredients: atmospheres adopted during different evolutionary phases (main sequence and W-R), stellar tracks and mass-loss rate recipe. The latter is expressed in terms of the mass-loss rate value adopted by the Geneva group (1 X and 2 X for standard and enhanced mass-loss rate, respectively). A recent comparison of the different codes, focussing on the W-R population synthesis, is given by Leitherer (1999). Most codes adopt the Geneva stellar tracks (except for the Padova tracks in the case of PÉGASE). Different combination of atmosphere models are used, including the more recent CoStar fluxes for O stars in the SV98 and the Cerviño et al. (2002) models, and the Kurucz (1992) and Lejeune, Buser & Cuisinier (1997) atmospheres for the remaining stars across the HR diagram. For stars in the W-R stage, either specific models such as those of Schmutz, Leitherer & Gruenwald (1992), or the NLTE hot star models of Mihalas (1972) or Clegg & Middlemass (1987), are used.
7.1 Abundances
Dopita et al. (2000) have recalibrated the EHR sequence with models based on both the PÉGASE and Starburst99 predictions for the spectral energy distribution of zero-age instantaneous bursts. These were used as input for photoionization models which included a self-consistent treatment of dust effects on the nebular spectra. Their conclusion is that the bulk properties of EHRs can be satisfactorily explained by young ( 2 Myr) models, and proposed the use of the [O III]/[O II] versus [N II]/[O II] diagnostic diagram to estimate both the chemical abundance and the ionization parameter. In Fig. 14 we plot their models, based on the PÉGASE ionizing fluxes, on top of our new data, together with the BKG sample. According to this diagram, and under the assumption that these H II regions are very young, the metallicity of our new sample is supersolar, with several objects, including the hot spots, having abundances well above twice the solar value. The apparently large discrepancy with the metallicities derived previously from the strong line method underlines the difficulty of abundance determinations in this regime. However, the [N II]/[O II] depends on both (this ratio being larger at the lower temperatures found in metal-rich nebulae) and N/O ratio. A different recipe in accounting for how this ratio depends on would lead to different [N II]/[O II] line ratios. This is seen when the Stasińska, Schaerer & Leitherer (2001) models are considered, which adopt a milder dependence of N/O upon metallicity than the Dopita et al. (2000) models. This is the likely explanation for their generally small predicted [N II]/[O II] ratios at high abundance which, even in the 2 case, cannot account for the large values ([N II]/[O II] 3) observed in metal-rich H II nebulae. An increasing N/O ratio with time would also shift the model grid to the right in Fig. 14, leading to smaller metallicities estimates with respect to the zero-age case.
How does the abundance calibration adopted for this work, based on nebular models and zero-age ionizing cluster models (see Section 3.3) compare with recent photoionization models including time evolution? SSL have pointed out that at high metallicity the sensitivity of the optical [O III] lines to the balance of energy gains and losses makes the strong line method of abundance determination, together with the auroral-line based method, highly uncertain, and as the ionizing clusters evolve the empirical abundances will correspondingly show an important variation. In order to estimate the effect on our abundance scale, we have used the Kobulnicky, Kennicutt & Pizagno (1999) analytical expression of the McGaugh models (upper branch only of the - relation) and applied it to the time-evolving fluxes predicted by the SSL models. We have used their reference IMF models (Salpeter slope, = 100 ), with total cluster mass of , to calculate semi-empirical abundances from the model [O II] and [O III] lines. The results are little affected by changes in the total mass, and are summarized in Table 4 for instantaneous burst models at metallicities and 2 . The resulting semi-empirical abundances indeed show a variation with time, starting at approximately the theoretical input value, and then departing from it already 2 Myr after the initial burst. The departures can be quite large, and act in the sense of either over- or under-estimating the input model abundance, depending on the evolutionary status. For ages smaller than 6 Myr, however, the scatter is confined within 0.15 dex of the input abundance. This comparison indicates that, while it could be very difficult to assign accurate abundances to metal-rich nebulae, especially at abundances well above the solar value, we can confirm the supersolar abundances of most objects in the present sample of EHRs in M83, NGC 3351 and NGC 6384.
7.2 Ages
The age of a starburst is an additional, fundamental property which, in principle, can be derived from the observed spectrum. The equivalent width, , is widely adopted as a starburst chronometer (Copetti, Pastoriza & Dottori 1986), and at metallicities below solar also ([O III] 5007) could be employed (Stasińska & Leitherer 1996). However, difficulties in the use of can arise if a significant older underlying stellar population is present, as shown by Raimann et al. (2000). As a consequence, ages determined from , as done in Section 5, would in general be overestimated. In Fig. 15 we plot vs. for our metal-rich H II region data, supplemented by the BKG data. The SSL models for a Salpeter IMF and = 120 are plotted for starburst ages varying from 1 to 7 Myr. The dashed lines connect the solar abundance predictions with those for a = 30 IMF at twice solar abundance. The well-known lack of H II regions with values in excess of 500 Å, as predicted by photoionization models, is apparent at all abundances. This does not necessarily imply the absence of very young objects, and alternative explanations have been proposed. These include uncertainties in the evolutionary models (e.g. overprediction of ionizing photons, see Mas-Hesse & Kunth 1999) as well as effects of dilution by underlying stellar populations (Raimann et al. 2000), dust extinction affecting stars and gas in different proportions (Mas-Hesse & Kunth 1999, Schaerer et al. 2000), and leakage of ionizing photons (SSL). The absence of a proper zero age main sequence for massive stars and the considerable time, on the order of 2 Myr, they spend embedded in their parental clouds, as proposed by Bernasconi & Maeder (1996), does not seem to reduce by a suffient amount to reconcile it with the observational data (Schaerer et al. 2000). Although noted and addresses in several papers, this discrepancy therefore still lacks a unique and clear explanation.
In the high-abundance bins of Fig. 15 we notice several objects, including the hot spots, with very low . This diagram would imply that the bulk of the sample has ages between 3 and 5 Myr, with a number of older objects at high metallicity. It is however possible that an upward correction in should be considered, in order to account for an underlying older population, which is more likely to be present at high abundance and in the nuclear hot spots. This correction would lower the average age of the H II regions in the sample, but it is not possible in the current analysis to exactly quantify this effect. The detection of the W-R bump in five objects of the present sample, marked by the special symbols in Fig. 15, does not impose very tight constraints. According to the SV98 models, W-R star signatures should be visible in the spectrum of starbursts having ages in the range approximately between 2 and 7 Myr in the case of H II regions at solar abundance or above. The points corresponding to the W-R bump detections in Fig. 15 are all in agreement with this prediction. In Sect. 5, from the fit to the optical absorption line profiles and the UV spectra, we estimated for M83-A an age of 4-5 Myr, close to the age derived from . We also note that, except for one object (NGC 3351-1), all of the low points in Fig. 15 are hot spots. The absorption line profile fits to their spectra in Sect. 5 suggested ages between 5 and 6 Myr, although the uncertainty can be considerable. An upward correction in by 0.5 dex would be required to reconcile these ages with those estimated from .
In principle, we have already accounted for an underlying stellar population, since it resulted from our calculation of the reddening (Sect. 2), based on the simultaneous convergence of the observed / and / ratios to the theoretical values. However, Mas-Hesse & Kunth (1999) found that values of larger than the typical 1-2 Å measured in this way, and up to 5 Å, are required in some extragalactic star forming regions to match the values derived from the Balmer decrement to those derived from the UV continuum. Indeed, the evolutionary models of González Delgado, Leitherer & Heckman (1999) predict () 5 Å at Myr for an instantaneous burst at solar metallicity. Mas-Hesse & Kunth (1999) also found that the discrepancy between the optical (Balmer lines) and UV (continuum) ’s, already mentioned previously, is higher for the older H II regions, and at high metallicity. This can have an important impact on , in that it measures the ratio of nebular emission lines (higher reddening) to the stellar continuum (lower reddening). The likely explanation for this effect is that powerful stellar winds and supernova explosions sweep the dust out of the ionizing stellar clusters into filaments within the H II regions. The difference measured by Mas-Hesse & Kunth (1999) between stellar and nebular extinction at older ages would lead to underestimate by approximately a factor of 2. We argue that this might explain, at least partially, the apparent older ages at high oxygen abundance in Fig. 15, and reconcile the ages determined via line profile fits and . As a further test, we plot in Fig. 16 the same quantities as in Fig. 15, where we have applied a correction to following Calzetti (2001, see also ): log [obs/0] = gas. The resulting values indeed show how the effect of differential reddening produces somewhat younger ages overall, and partially removes the difference in between hot spots and disk H II regions.
We finally note that in the age range which includes most of the H II regions in our sample the effects of an IMF depleted in massive stars are secondary, as judged from the corresponding models in Fig. 15, and we can conclude that such a truncated mass function is not required to explain the distribution of with metallicity.
7.3 W-R features
The detection of W-R features in some of the H II regions of the present sample (Sect. 6) allows us to derive some important properties of the massive star content direcly from stellar features, rather than relying on the more indirect signatures represented by the nebular emission lines. The study of these features at high metallicity is of particular importance, because it helps us constraining current evolutionary synthesis models of massive stellar populations in supersolar abundance environments. So far only in a handful of extragalactic metal-rich H II regions these stars have been detected and analyzed quantitatively (Schaerer, Contini & Pindao 1999, Schaerer et al. 2000). Our observations do not reach a sufficient S/N ratio for an accurate analysis, but we can still infer some important properties of the ionizing stellar content of those clusters containing W-R stars, by comparing our observed line intensities and equivalent widths with the model predictions (mainly from SV98). We complement our sample with six additional metal-rich H II regions from the work of BKG, which show the presence of the W-R bump in their spectra (this analysis was not included in the BKG paper). Of these, only one object (M31-5 using the BKG nomenclature) shows a significantly strong red bump at 5808 Å.
In the following analysis we will make a series of assumptions. First of all, the extinction affecting the ionizing stars will be taken to be equal to the one measured for the gas from the Balmer decrement. As mentioned in the previous section, there are indications that the stars suffer less extinction than the gas (e.g. Mas-Hesse & Kunth 1999), and this would result in smaller numbers of W-R stars as estimated from the intensity of the blue bump. We will also rely on as an age indicator, and assume that all Lyman continuum photons contribute to the ionization of the gas, and that during the observations our slit included most of the emission from the ionized gas, i.e. we do not account for possible aperture effects. We refer the reader to the work of Schaerer, Contini & Pindao (1999) for a discussion on the impact of these assumptions.
Given the uncertainties involved in the measurement of the individual lines contributing to the W-R blue bump in our data, we will only consider their combined fluxes. Apparently, no contamination from nebular lines is present. The blue bump intensities relative to and their equivalent widths are summarized in Table 5 for the five H II regions in M83 described in Section 6, and for the additional EHRs from the BKG work (the identification refers to their Table 3). Uncertainties are of the order of 10-20 percent in the intensities, and 1-2 Å in the equivalent widths. The I(4650)/I() intensity ratio as a function of oxygen abundance is shown in Fig. 17 for our objects, together with datapoints for W-R galaxies taken from Schaerer et al. (2000). For the latter dataset we have, for consistency, estimated the oxygen abundance using our adopted strong line method calibration from the published strength of the [O II] and [O III] emission lines. There is a general agreement with the known trend of increasing I(4650)/I() with abundance, although the H II regions tend to have a weaker blue bump at a given abundance compared to the brighter starburst galaxies. In this plot we cannot exclude systematic differences arising from observational biases.
Our data are compared in Fig. 18 to the models of SV98 for the metallicities appropriate for our sample (, full line, and , dashed line). The model IMF has a Salpeter slope with . It can be seen that for half of the objects there is good agreement between the observed quantities (both I(4650)/I() and ) and those synthesized for an instantaneous burst of star formation. The remaining ones have low and/or I(4650)/I() values at a given if compared with these models, and are all concentrated at the lower end of the range spanned by our sample of objects. A discrepancy in the same direction was obtained for the five metal-rich W-R galaxies studied by Schaerer et al. (2000), who resolved the inconsistency by considering models for bursts extending for 4-10 Myr, instead of instantaneous ones. Under the same assumption, the burst duration for the objects in our sample would have to be longer, because of the lower blue bump intensities and equivalent widths of the discrepant objects. However, we find such mode of star formation less plausible in the case of disk H II regions than for starburst galaxies, which compose the objects considered in the Schaerer et al. (2000) work, and which are likely the superposition of several ionizing clusters in a kpc-scale star forming region. We do not detect in our spectra the signatures of older generations of stars, except in the special case of the hot spot M83 A, where we attributed such features to the old bulge population. More sensitive observations would be needed to confirm this, however. Observational biases, and in particular aperture effects, would make the comparison with the models even worse, by lowering the I(4650)/I() ratio (while would remain unaffected). The same is true if we considered an extinction for the stars lower than for the gas. Loss or leakage of ionizing photons, e.g. from dust absorption or density-boundedness, could not explain the discrepancy in both plots ( and I(4650)/I() would be affected, but would not). Schaerer et al. (2000) also showed that IMF parameters far from standard are unlikely to occur, in particular upper mass cutoffs as low as 30 are ruled out. A more moderate decrease in the upper mass limit of the Salpeter IMF from 120 to 60 cannot be excluded with the same degree of confidence, and would be consistent with the low-EW objects. However, if the measured values in excess of 100 Å are real, and not an effect of wrongly placed low continuum levels, this solution would not be acceptable, either.
A further hypothesis follows from noting that the discrepant objects in Fig. 18 are those with the lowest and . We can postulate that the low- end of the diagrams is not populated because at high metallicity the W-R phase has a shorter duration than predicted by the models. In fact, if the end of the W-R phase occurred at 6 Myr rather than 7 Myr as predicted by the SV98 models at high metallicity, the abrupt decrease of both I(4650)/I() and would take place at higher values of (around 30 Å), thus removing the discrepancy. Although this solution might seem perhaps justified by the uncertainties in our current knowledge of the W-R phase at high metallicity, its verification relies on the observation of larger samples of metal-rich H II regions. The measurement of W-R bump emission in H II regions having 10 Å would refute this hypothesis. Such objects would likely be faint because of their old age, and subject to considerable measurement uncertainties. The sample of Arnault, Kunth & Schild (1989, see ) appears to contain a handful of such objects. We must also mention the fact that the newer stellar tracks from the Geneva group including stellar rotation would predict longer W-R lifetimes than the non-rotating models, and not the opposite.
One effect which could, at least in principle, solve the discrepancy noted above is related to the stochastic nature of the IMF that occurs for small cluster masses. As discussed by Cerviño, Luridiana & Castander (2000), observables like and the intensity of the W-R bump are affected by significant fluctuations when ionizing clusters of total mass (accounting for stars in the 2-120 mass range) are synthesized with Montecarlo-generated IMFs rather than with analytical functions. In these cases a meaningful comparison with the observational data should include the study of these fluctuations. These effects can be quite important in the study of the emission line properties of EHRs. In our sample the cluster masses corresponding to the observed ionizing fluxes are in fact on the order of , except for M83 A, which is one order of magnitude more massive (similar moderate masses have been measured for the young clusters in the M83 nuclear region by Harris et al. 2001). Cerviño et al. (2002) have shown that during the W-R–rich phase of an evolving starburst, clusters having total masses smaller than ( ) will have an uncertainty in the number of He+ (He0) ionizing photons larger than 10%. We have also seen in Sect. 6 that the number of W-R stars contained in our sample H II regions is very small, therefore small number statistics certainly plays an important role in the interpretation of the diagrams presented in Fig. 18.
From the Cerviño et al. (2002) work we have estimated the fluctuations in the quantities plotted in Fig. 18, by assuming a cluster mass of . The dash-dotted lines show the analytical predictions, while the dotted lines give the upper and lower limits corresponding to the 90% confidence level, for the solar abundance case. These models were generated with the Geneva stellar tracks and the standard mass-loss rate, which makes the analytical solution to lie below the corresponding prediction from SV98, since less W-R stars are produced with a lower mass loss. Despite this difference, the range in which we expect to find objects roughly corresponding to those in our sample is compatible with the location of the datapoints in both diagrams. This solution is particularly attractive, since we do not have to postulate changes in the IMF or very extended periods of star formation in order to explain the diagrams in Fig. 18. Future work on the comparison of improved evolutionary codes with larger samples of metal-rich H II regions should shed new light on this interpretation.
7.4 Equivalent effective temperatures
The equivalent effective temperature of a stellar population, , defined as the temperature of a single hot star having the same ratio of He I and H ionizing photons as the ensemble of ionizing stars, is a useful diagnostic of EHRs. The decrease of the fractional abundance of ionized helium with increasing oxygen abundance has led Panagia (2000) to argue in favor of a decreased upper mass limit for the IMF at high metallicity (as in BKG), or an increase in the absorption of ionizing photons from the circumstellar material. We have shown in the diagrams in Section 4, in particular the one relating the He I 5876/ emission line ratio with abundance, an empirical trend of the ionizing cluster with metallicity, reaching 33-35 at supersolar abundances. Theoretically, such a trend is expected from the effects of metal abundance on the stellar temperatures, and McGaugh (1991) showed, using zero-age models of ionizing clusters, how this would explain the decreasing hardness of the ionizing spectra with metallicity. However, is expected to decrease also as the ionizing clusters evolve with time, as a result of the progressive disappearance of the hottest and most massive stars (Cerviño & Mas-Hesse 1994). At intermediate ages (3-6 Myr) the appearance of W-R stars could, as a result of high effective temperatures, disrupt this trend by increasing the hardness of the cluster ionizing spectra (García-Vargas, Bressan & Díaz 1995). We attempt now to use our observations to verify the predictions of current evolutionary models regarding this particular aspect. In our previous work (BKG) we argued about a possible depletion of massive stars in the IMF of metal-rich H II regions. This argument followed from the result that the ages of the H II regions in our sample were preferentially restricted to the first 3 Myr after the onset of star formation. We reached this conclusion by comparing the data with photoionization models based on the cluster SEDs of Leitherer & Heckman (1995). BKG proposed that, unless the hardness of the ionizing spectra predicted by the models was overestimated, an agreement with the data was found only for young ages. In view of the progress in evolutionary synthesis modeling and the availability of improved stellar tracks with respect to those used in the Leitherer & Heckman (1995) work (the Maeder 1990 tracks), leading in particular to shorter phases of enhanced from W-R stars at high metallicity, we re-analyze here the BKG data, together with our new data, regarding inferences on the IMF from the nebular lines. In fact, we are not forced to assume preferentially young ages for the EHR in our samples, and have used the throughout this paper as a reliable time indicator. Lower ’s can thus be obtained also as a result of aging.
The He I 5876/ vs. plot is shown in Fig. 19 (top panel). Only the metal-rich objects are plotted from the BKG sample, as estimated from the adopted abundance empirical calibration. The results of the photoionization models of SSL, based on the SV98 spectral energy distributions, at two different metallicities ( and 2 ) are also shown (Salpeter IMF, = 120 ). The He I 5876/ ratio is independent of the ionization parameter, as seen by comparing the models calculated for a cluster (full lines) with those for a cluster (dotted lines). Changes in the other parameters explored by the SSL models have also little effect on the predicted ratio. The predicted fluxes from the newer photoionization models are in good agreement with the BKG models, which, as mentioned above, were calculated based on the Leitherer & Heckman (1995) SEDs, and were therefore dependent on different stellar tracks and stellar atmospheres than those in the SSL work, except during the W-R phase, for which the same Schmutz, Leitherer & Gruenwald (1992) models were employed. Empirically we find an indication of a slight decrease of the He I 5876/ ratio with , which can be interpreted as a trend of decreasing from 36,000 down to 34,000 as the H II regions become older. The photoionization models suggest the same trend, but seem to predict 30% stronger He I lines than observed at a given age, or equivalently higher effective temperatures. SSL, too, could not reconcile their models with existing measurements made in samples of H II galaxies, in particular finding no evidence for an age dependence of He I 5876/. Although such a trend appears to be present in our current sample of EHRs, a discrepancy with the models persists.
A possible explanation for this discrepancy is that the evolutionary models overpredict the number of He I ionizing photons. In the bottom panel of Fig. 19 we have estimated the equivalent derived from the SV98 models (, Salpeter slope), by assigning to the ionizing clusters the effective temperature of a CoStar model atmosphere (Schaerer & de Koter 1997) having the same ratio. The time evolution of thus determined is shown by the dot-dashed ( models) and the dotted (2 ) lines. It should be noted that CoStar atmospheres of solar metallicity were used in both cases to estimate the effective temperatures. The empirical effective temperatures from the He I line are cooler than the temperatures from the models, which appear to be boosted during the W-R phase (especially during the WC-dominated period), which lasts for several Myr at high metallicity, and which provides a substantial contribution to the total ionizing flux. We also show in the bottom panel the trend as a function of predicted by the Cerviño, Mas-Hesse & Kunth (2001) models (http://www.laeff.esa.es/~mcs/model) with the same upper IMF parameters as for the SV98 case (full line: ; dashed line: 2 ). These models, an update of those presented by Cerviño & Mas-Hesse (1994, see also ) use different input parameters and assumptions regarding the stellar atmospheres when compared with SV98 (see Table 6). The most important differences are in the use of Geneva tracks with standard mass loss, and in the description of the ionizing output of W-R stars, which are treated as main sequence O stars of a given , up to the O3 type, which leads to softer ionizing spectra then the Schmutz, Leitherer & Gruenwald (1992) continuum energy distributions. Although a different recipe was used to derive from , based on a combination of Mihalas (1972) and Kurucz (1979) atmospheres, the correspondence between and is similar to what one obtains using CoStar atmospheres. The origin of the difference between the two sets of models in Fig. 19, therefore, lies mostly in the ionizing fluxes predicted by the adopted atmosphere models. More recent calculations by Cerviño et al. (2002) include the same treatment of stellar tracks and atmospheres as SV98, and lead to results which are consistent with the latter work, in particular higher ’s than in the models with ‘soft’ W-R spectra are predicted. The comparison in Fig. 19 shows that the older evolutionary models, although less sofisticated in the treatment of W-R stars, are more in agreement with the empirical results, being able to reproduce the mild gradient deduced from the He I line and the moderate effective temperatures throughout most of the diagram. We finally note that the presence of W-R stars does not affect significantly the derived nebular effective temperatures, since EHRs showing W-R features in their spectra do not show signs of harder ionizing fluxes.
In conclusion, the most recent evolutionary models using a Salpeter IMF extending to high masses appear to be consistent with several observed line ratios, contrary to the conclusion reached by BKG on the basis of older models. We still find some evidence, however, for an ionizing spectrum which is possibly too hard during the W-R phase. It is likely that the inclusion of blanketing in the atmospheres of these stars will help resolve this issue. The recent W-R star non-LTE blanketed model atmospheres of Smith, Norris & Crowther (2002) indeed predict a negligible He II ionizing continuum flux, and a reduced He I ionizing flux at high metallicities. These softer spectra, at least qualitatively, agree with our experimental result. On the other hand, the unblanketed W-R models used in most current population synthesis models have been shown to give far-UV fluxes in reasonable agreement with observations of single W-R stars surrounded by ring nebulae, except for the lowest- WNLs (Esteban et al. 1993). If, as suggested by this latter work, such models are approximately correct for WNE and WC stars, we would expect better agreement in our comparison during the evolutionary phases dominated by these stars, i.e. around 4 Myr after the initial burst of star formation. Fig 19 seems to suggest that this is not the case, and, as mentioned above, during this phase the models predict the highest effective temperatures, which is not corroborated by the empirical data. In this respect, the effects of the choice of mass-loss rates adopted in the stellar evolution models on the output of ionizing flux may become important. The number of hot W-R stars determined by the stellar tracks can also be a matter of discussion. The detailed investigation of the impact of all these different scenarios is however beyond the scope of our work.
8 Summary and conclusions
The interpretation of the optical spectra of metal-rich H II regions is, generally speaking, riddled with several uncertainties, owing to the low excitation of the gas. An ill-defined electron temperature of the nebular gas, possibly substantial contributions of underlying stellar populations and the effects of dust can severely undermine our ability to infer the properties of the ionizing clusters, as well as the determination of metal abundances. We have presented a sample of extragalactic H II regions which are estimated to have high abundances (equal to solar and above) from semi-empirical methods applied to strong spectral lines. Among these are a number of nuclear hot spots, which are shown to share most of their spectral properties with the H II regions in the disks of spiral galaxies. By using different methods (, Balmer lines in absorption, UV spectra) we derive constistently young ages for these hot spots.
In the spectra of a number of objects in our sample we have detected the blue bump at 4650 Å from W-R stars, and possibly also detected WC features in the red, which allows us to put tighter constraints on their massive stellar content. We have compared the measured intensity and equivalent width of the 4650 Å bump with some recent evolutionary models. By assuming instantaneous bursts of star formation and Salpeter IMFs the ages derived from are in general agreement with the predicted age span of the W-R rich phase, between 3 and 6 Myr. Some inconsistency with the models of SV98 is found relative to the strength of the blue bump. Our favored explanation is related to the small number of stars formed in the clusters. Accounting for stochastic variations in the observables appears sufficient to solve the apparent discrepancy with the analytical models, without the need for changes in the IMF or in the mode of star formation We await the availability of higher S/N spectra in a larger sample of metal-rich extragalactic H II regions before we can reach definite conclusions on the validity of this suggestion.
Some of the indicators of the hardness of the ionizing spectra available to us, in particular the intensity of the He I 5876 recombination line relative to , are examined, and compared to the results of photoionization models by SSL. We have found that the equivalent effective temperature of the ionizing clusters is not affected by the presence of W-R stars. We also find some evidence that the evolutionary models can be overestimating the number of He ionizing photons. The observed trend of with (taken as a good age estimator) and metal abundance are however consistent with the predictions of Cerviño, Mas-Hesse & Kunth (2001).
Contrary to our previous conclusion from the analysis of the spectra of extragalactic H II regions, based on evolutionary models calculated from stellar tracks older than the ones used in the current work, we find no compelling evidence for a depletion of massive stars in the mass function of metal-rich clusters. The change in the models which has mostly affected our conclusion, when compared to our previous analysis (BKG), comes from updated stellar evolution tracks. The non-rotating, enhanced mass loss Geneva tracks which are part of the SV98, Starburst99 and PÉGASE evolutionary models lead to shorter W-R phases of enhanced hardness of the ionizing radiation at high metallicity. As a result the spectra of EHRs are compatible with the models for longer periods of time, although during the (shorter) W-R phase the predicted ionizing flux may still be too hard. The improvements in stellar atmospheres for massive O stars with respect to the older models (e.g. CoStar versus Kurucz) have a secondary effect on the model emission lines, while a larger effect might be expected from the inclusion of blanketed W-R atmospheres.
The new synthesis models, when coupled with modern photoionization codes, seem to provide a good description of the general properties of mostly metal-poor extragalactic H II regions, provided that additional effects are accounted for (underlying older populations, gas and stars affected by different amounts of extinction, loss of ionizing photons, etc.). This gives us some confidence that a similar degree of accuracy can be reached by the models also in the high metallicity regime, although, again, some issues still need further investigation (e.g. standard vs. enhanced mass loss, W-R ionizing fluxes). Regarding the upper IMF at high metallicity, the constraints on the lowest value of the upper mass limit which we can still regard as consistent with the different observables cannot be very tight, because of the degeneracies involved (aging of the ionizing clusters, mass function at birth) and the stochastic nature of the IMF itself. However, when different indications from several parameters (, , W-R lines, UV spectra) are analyzed in a consistent way we conclude that the upper mass limit must be at least 40-50 also at metallicities well above the solar value, in agreement with the findings of Schaerer et al. (2000). Higher values of cannot be neither ruled out nor confirmed with the presently available data, but a mass function depleted in massive stars is not required from modern data and evolutionary models. The discovery and investigation of ‘normal’ H II regions, younger ( Myr) than the ones observed so far at high abundance will be crucial to settle this question. This might be made difficult by a possible obscuration of young, massive stars by parental molecular clouds in metal-rich environments. In any case, this conclusion does not imply that H II regions in extreme environments, such as those found in IR-luminous starburst, might not develop peculiar initial mass functions.
References
- Achtermann & Lacy (1995) Achtermann, J.M. & Lacy, J.H. 1995, ApJ, 439, 163
- Alloin & Nieto (1982) Alloin, D. & Nieto, J.-L. 1982, A&AS, 50, 491
- Alloin et al. (1979) Alloin, D., Collin-Souffrin, S., Joly, M. & Vigroux, L. 1979, A&A, 78, 200
- Alonso-Herrero, Ryder & Knapen (2001) Alonso-Herrero, A., Ryder, S.D. & Knapen, J.H. 2001, MNRAS, 322, 757
- Arnault, Kunth & Schild (1989) Arnault, P., Kunth, D. & Schild, H. 1989, A&A, 224, 73
- Barth & Shields (2000) Barth, A.J., & Shields, J.C. 2000, PASP, 112, 753
- Beck, Kelly & Lacy (1997) Beck, S.C., Kelly, D.M. & Lacy, J.H. 1997, AJ, 114, 585
- Bernasconi & Maeder (1996) Bernasconi, P.A. & Maeder, A. 1996, A&A, 307, 829
- Bica (1988) Bica, E. 1988, A&A, 195, 76
- Bica & Alloin (1987) Bica, E. & Alloin, D. 1987, A&AS, 70, 281
- Bohlin et al. (1983) Bohlin, R.C., Cornett, R.H., Hill, J.K., Smith, A.M. & Stecher, T.P. 1983, ApJ, 274, L53
- Böker et al. (2000) Böker, T., van der Marel, R.P., Mazzuca, L., Rix, H.-W., Rudnick, G., Ho, L.C. & Shields, J.C., 2001, AJ, 121, 1473
- Bresolin, Kennicutt & Garnett (1999) Bresolin, F., Kennicutt, R.C. & Garnett, D.R. 1999, ApJ, 510, 104
- Buta & Crocker (1993) Buta, R. & Crocker, D.A. 1993, AJ, 105, 1344
- Calzetti (2001) Calzetti, D. 2001, PASP, 113, 1449
- Calzetti, Kinney & Storchi-Bergmann (1994) Calzetti, D., Kinney, A.L. & Storchi-Bergmann, T. 1994, ApJ, 429, 582
- Castellanos, Díaz & Terlevich (2001) Castellanos, M., Díaz, A.I. & Terlevich, E. 2001, MNRAS, in press
- Cerviño et al. (2002) Cerviño, M., Valls-Gabaud, D., Luridiana, V. & Mas-Hesse, J.M. 2002, A&A, 381, 51
- Cerviño, Mas-Hesse & Kunth (2001) Cerviño, M., Mas-Hesse, J.M. & Kunth, D. 2001, A&A, submitted
- Cerviño, Luridiana & Castander (2000) Cerviño, M., Luridiana, V. & Castander, F.J. 2000, A&A, 360, L5
- Cerviño & Mas-Hesse (1994) Cerviño, M., & Mas-Hesse, J. M. 1994, A&A, 284, 749
- Clegg & Middlemass (1987) Clegg, R.E.S. & Middlemass, D. 1987, MNRAS, 228, 759
- Colina et al. (1997) Colina, L., García Vargas, M.L., Mas-Hesse, J.M., Alberdi, A. & Krabbe, A. 1997, ApJ, 484, L41
- Conselice et al. (2000) Conselice, C.J., Gallagher, J.S., Calzetti, D., Homeier, N. & Kinney, A. 2000, AJ, 119, 79
- Conti (1991) Conti, P.S. 1991, ApJ, 377, 115
- Contini et al. (2002) Contini, T., Treyer, M.A., Sullivan, M. & Ellis, R.S. 2002, MNRAS, 330, 75
- Copetti, Pastoriza & Dottori (1986) Copetti, M.V.F., Pastoriza, M.G. & Dottori, H.A. 1986, A&A, 156, 111
- Coziol, Doyon & Demers (2001) Coziol, R., Doyon, R. & Demers, S. 2001, MNRAS, 325, 1081
- Crowther (1999) Crowther, P.A. 1999, in IAU Symposium 193, Wolf-Rayet Phenomena in Massive Stars and Starburst Galaxies, ed. K.A. van der Hucht, G. Koenigsberger & P.R.J. Eenens (San Francisco: ASP), 129
- Crowther et al. (1999) Crowther, P.A., Pasquali, A., de Marco, O., Schmutz, W., Hillier, D.J., & de Koter, A., 1999, A&A, 350, 1007
- de Jager, Nieuwenhuijzen & van der Hucht (1988) de Jager, C., Nieuwenhuijzen, H. & van der Hucht, K.A. 1988, A&AS, 72, 259
- de Vaucouleurs, Pence & Davoust (1983) de Vaucouleurs, G., Pence, W. D., & Davoust, E. 1983, ApJS, 53, 17
- Díaz et al. (2000) Díaz, A.I., Castellanos, M., Terlevich, E. & García-Vargas, M.L. 2000, MNRAS, 318, 462
- Díaz et al. (1991) Díaz, A.I., Terlevich, E., Vílchez, J.M., Pagel, B.E.J. & Edmunds, M.G. 1991, MNRAS, 253, 245
- Doherty et al. (1995) Doherty, R.M., Puxley, P.J., Lumsden, S.L. & Doyon, R. 1995, MNRAS, 277, 577
- Dopita et al. (2000) Dopita, M.A., Kewley, L.J., Heisler, C.A. & Sutherland, R.S. 2000, ApJ, 542, 224
- Dopita & Evans (1986) Dopita, M.A. & Evans, I.N. 1986, ApJ, 307, 431
- Dufour et al. (1980) Dufour, R.J., Talbot, R.J., Jensen, E.B. & Shields, G.A. 1980, ApJ, 236, 119
- Dutil & Roy (1999) Dutil, Y. & Roy, J.-R. 1999, ApJ, 516, 62
- Edmunds (1989) Edmunds, M.G. 1989, in Evolutionary Phenomena in Galaxies, ed. J.E. Beckman & B.E.J. Pagel (Cambridge: Cambridge University Press), 356
- Edmunds & Pagel (1984) Edmunds, M.G. & Pagel, B.E.J. 1984, MNRAS, 211, 507
- Elmegreen, Chromey & Warren (1998) Elmegreen, D. M., Chromey, F. R., & Warren, A. R. 1998, AJ, 116, 2834
- Elmegreen et al. (1997) Elmegreen, D.M., Chromey, F.R., Santos, M. & Marshall, D. 1997, AJ, 114, 1850
- Elmegreen (1994) Elmegreen, B.G. 1994, ApJ, 425, L73
- Esteban et al. (1993) Esteban, C., Smith, L.J., Vilchez, J.M. & Clegg, R.E.S. 1993, A&A, 272, 299
- Feinstein (1997) Feinstein, C. 1997, ApJS, 112, 29
- Ferland (1997) Ferland, G.J., 1997, Hazy, a brief introduction to Cloudy 90
- Figer et al. (1998) Figer, D.F., Najarro, F., Morris, M., McLean, I.S., Geballe, T.R., Ghez, A.M. & Langer, N. 1998, ApJ, 506, 384
- Fioc & Rocca-Volmerange (1997) Fioc, M. & Rocca-Volmerange, B. 1997, A&A, 326, 950
- Freedman et al. (2001) Freedman, W.L. et al. 2001, ApJ, 553, 47
- Gabler et al. (1989) Gabler, R., Gabler, A., Kudritzki, R.P., Puls, J. & Pauldrach, A. 1989, A&A, 226, 162
- Gallais et al. (1991) Gallais, P., Rouan, D., Lacombe, F., Tiphène, D. & Vauglin, I. 1991, A&A, 243, 309
- Garnett (1992) Garnett, D.R. 1992, AJ, 103, 1330
- Goldader et al. (1997) Goldader, J.D., Joseph, R.D., Doyon, R. & Sanders, D.B. 1997, ApJ, 474, 104
- González Delgado (2001) González Delgado, R.M. 2001, in IAU Symposium 207, Extragalactic Star Clusters, ed. E.K. Grebel, D. Geisler & D. Minniti (San Francisco: ASP)
- González Delgado, Heckman & Leitherer (2001) González Delgado, R.M., Heckman, T. & Leitherer, C. 2001, ApJ, 546, 845
- González Delgado & Peréz (2000) González Delgado, R.M. & Peréz, E. 2000, MNRAS, 317, 64
- González Delgado, Leitherer & Heckman (1999) González Delgado, R.M., Leitherer, C. & Heckman, T.M. 1999, ApJS, 125, 489
- González Delgado et al. (1999b) González Delgado, R.M., García-Vargas, M.L., Goldader, J., Leitherer, C. & Pasquali, A. 1999, ApJ, 513, 707
- González Delgado & Leitherer (1999) González Delgado, R.M. & Leitherer, C. 1999, ApJS, 125, 479
- Guseva, Izotov & Thuan (2000) Guseva, N.G., Izotov, Y.I. & Thuan, T.X. 2000, ApJ, 531, 776
- Hamuy et al. (1992) Hamuy, M., Walker, A.R., Suntzeff, N.B., Gigoux, P., Heathcote, S.R., & Phillips, M.M. 1992, PASP, 104, 533
- Harris et al. (2001) Harris, J., Calzetti, D., Gallagher, J.S, Conselice, C.J. & Smith, D.A. 2001, AJ, 122, 3046
- Heap et al. (1993) Heap, S.R., Holbrook, J., Malumuth, E., Shore, S. & Waller, W., 1993, BAAS, 182, 3104
- Heckman et al. (1998) Heckman, T.M., Robert, C., Leitherer, C., Garnett, D.R. & van der Rydt, F. 1998, ApJ, 503, 646
- Ho, Filippenko & Sargent (1997) Ho, L.C., Filippenko, A.V. & Sargent, W.L.W. 1997, ApJ, 487, 579
- Hodge (1974) Hodge, P. 1974, ApJS, 27, 113
- Hummer & Storey (1987) Hummer, D.G. & Storey, P.J. 1987, MNRAS, 224, 801
- Israel & Baas (2001) Israel, F.P. & Baas, F. 2001, A&A, 371, 433
- Johnson et al. (2000) Johnson, K.E., Leitherer, C., Vacca, W.D. & Conti, P.S. 2000, AJ, 120, 1273
- Johnson et al. (1999) Johnson, K.E., Vacca, W.D., Leitherer, C., Conti, P.S. & Lipscy, S.J. 1999, AJ, 117, 1708
- Kenney et al. (1992) Kenney, J., Wilson, C., Scoville, N., Devereux, N. & Young, J. 1992, ApJ, 395, L79
- Kennicutt et al. (2000) Kennicutt, R. C., Bresolin, F., French, H. & Martin, P. 2000, ApJ, 537, 589
- Kennicutt, Keel & Blaha (1989) Kennicutt, R.C., Keel, W.C. & Blaha, C.A. 1989, AJ, 97, 1022
- Kewley et al. (2001) Kewley, L.J., Dopita, M.A., Sutherland, R.S., Heisler, C.A. & Trevena, J. 2001, ApJ, 556, 121
- Kinkel & Rosa (1994) Kinkel, U. & Rosa, M.R. 1994, A&A, 2822, L37
- Kobulnicky, Kennicutt & Pizagno (1999) Kobulnicky, H.A., Kennicutt, R.C. & Pizagno, J.L. 1999, ApJ, 514, 544
- Kotilainen et al. (2000) Kotilainen, J.K., Reunanen, J., Laine, S. & Ryder, S.D. 2000, A&A, 353, 834
- Kudritzki & Puls (2000) Kudritzki, R.P. & Puls, J. 2000, ARAA, 38, 613
- Kurucz (1992) Kurucz, R.L. 1992, in IAU Symposium 149, The Stellar Populations of Galaxies, ed. B. Barbuy & A. Renzini (Dordrecht: Kluwer), 225
- Kurucz (1979) Kurucz, R.L. 1979, ApJS, 40, 1
- Leitherer (2001) Leitherer, C. 2001, in A Decade of HST Observations, ed. M. Livio, K.S. Noll & M. Stiavelli (Cambridge: Cambridge University Press), in press
- Leitherer et al. (2001) Leitherer, C., Leao, J.R.S., Heckman, T.M., Lennon, D.J., Pettini, M. & Robert, C. 2001, ApJ, 550, 724
- Leitherer et al. (1999) Leitherer, C., et al. 1999, ApJS, 123, 3
- Leitherer (1999) Leitherer, C. 1999, in IAU Symposium 193, Wolf-Rayet Phenomena in Massive Stars and Starburst Galaxies, ed. K.A. van der Hucht, G. Koenigsberger & P.R.J. Eenens (San Francisco: ASP), 526
- Leitherer, Chapman & Koribalski (1997) Leitherer, C., Chapman, J.M. & Koribalski, B. 1997, ApJ, 481, 898
- Leitherer & Heckman (1995) Leitherer, C. & Heckman, T.M. 1995, ApJS, 96, 9
- Leitherer, Robert & Heckman (1995) Leitherer, C., Robert, C. & Heckman, T.M. 1995, ApJS, 99, 173
- Lejeune, Buser & Cuisinier (1997) Lejeune, T., Buser, R. & Cuisinier, F. 1997, A&AS, 125, 229
- Luhman et al. (1998) Luhman, M.L., Satyapal, S., Fischer, J., Wolfire, M.G., Cox, P., Lord, S.D., Smith, H.A., Stacey, G.J. & Unger, S.J. 1998, ApJ, 504, L11
- Maeder & Meynet (2001) Maeder, A. & Meynet, G. 2001, A&A, 373, 555
- Maeder & Meynet (1994) Maeder, A. & Meynet, G. 1994, A&A, 287, 803
- Maeder (1990) Maeder, A. 1990, A&AS, 84, 139
- Maoz et al. (2001) Maoz, D., Barth, A.J., Ho, L.C., Sternberg, A. & Filippenko, A.V. 2001, AJ, 121, 3048
- Martin & Friedli (1999) Martin, P. & Friedli, D. 1999, A&A, 346, 769
- Massey (1998) Massey, P. 1998, in The Stellar Initial Mass Function, ed. G. Gilmore & D. Howell (San Francisco: ASP), 17
- Massey & Hunter (1998) Massey, P. & Hunter, D.A. 1998, ApJ, 493, 180
- Mas-Hesse & Kunth (1999) Mas-Hesse, J.M. & Kunth, D. 1999, A&A, 349, 765
- McCall (1984) McCall, M. L. 1984, MNRAS, 208, 253
- McCall, Rybski & Shields (1985) McCall, M.L., Rybski, P.M. & Shields, G.A. 1985, ApJS, 57, 1
- McGaugh (1994) McGaugh, S.S. 1994, ApJ, 426, 135
- McGaugh (1991) McGaugh, S.S. 1991, ApJ, 380, 140
- Meynet & Maeder (2000) Meynet, G. & Maeder, A. 2000, A&A, 361, 101
- Meynet et al. (1994) Meynet, G., Maeder, A., Schaller, G., Schaerer, D., & Charbonnel, C. 1994, A&AS, 103, 97
- Meynet (1995) Meynet, G. 1995, A&A, 298, 767
- Mihalas (1972) Mihalas, D. 1972, Non-LTE model atmospheres for B and O stars, NCAR-TN/STR-76
- Moy, Rocca-Volmerange & Fioc (2001) Moy, E., Rocca-Volmerange, B. & Fioc, M. 2001, A&A, 365, 347
- Morgan (1958) Morgan, W.W. 1958, PASP, 70, 364
- Nugis & Lamers (2000) Nugis, T. & Lamers, H.J.G.L.M. 2000, A&A, 360, 227
- Oey & Kennicutt (1993) Oey, M.S. & Kennicutt, R.C. 1993, ApJ, 411, 137
- Origlia et al. (2001) Origlia, L., Leitherer, C., Aloisi, A., Greggio, L. & Tosi, M. 2001, AJ, 122, 815
- Osterbrock (1989) Osterbrock, D.E. 1989, The Astrophysics of Gaseous Nebulae and Active Galactic Nuclei (Mill Valley: University Science Books)
- Pagel et al. (1979) Pagel, B.E.J., Edmunds, M.G., Blackwell, D.E., Chun, M.S. & Smith, G. 1979, MNRAS, 189, 95
- Panagia (2000) Panagia, N. 2000, in The evolution of the Milky Way: Stars Versus Clusters, ed. F. Matteucci & F. Giovanelli (Dordrecht: Kluwer), 495
- Pérez-Ramírez et al. (2000) Pérez-Ramírez, D., Knapen, J.H., Peletier, R.F., Laine, S., Doyon, R. & Nadeau, D. 2000, MNRAS, 317, 234
- Planesas, Colina & Pérez-Olea (1997) Planesas, P., Colina, L. & Pérez-Olea, D. 1997, A&A, 325, 81
- Puxley, Doyon & Ward (1997) Puxley, P.J., Doyon, R. & Ward, M.J. 1997, ApJ, 476, 120
- Pilyugin (2001b) Pilyugin, L.S. 2001b, A&A, 373, 56
- Pilyugin (2001a) Pilyugin, L.S. 2001a, A&A, 369, 594
- Pilyugin (2000) Pilyugin, L.S. 2000, A&A, 362, 325
- Raimann et al. (2000) Raimann, D., Bica, E., Storchi-Bergmann, T., Melnick, J. & Schmitt, H. 2000, MNRAS, 314, 295
- Rosa & D’Odorico (1986) Rosa, M., & D’Odorico, S. 1986, in IAU Symposium 116, Luminous stars and associations in galaxies (Dordrecht: Reidel), 355
- Rouan et al. (1996) Rouan, D., Tiphène, D., Lacombe, F., Boulade, O., Clavel, J., Gallais, P., Metcalfe, L., Pollock, A. & Siebenmorgen, R. 1996 A&A, 315, L141
- Ryder, Knapen & Takamiya (2001) Ryder, S.D., Knapen, J.H. & Takamiya, M. 2001, MNRAS, 323, 663
- Saraiva et al. (2001) Saraiva, M.F., Bica, E., Pastoriza, M.G. & Bonatto, C. 2001, A&A, 376, 43
- Schaerer et al. (2000) Schaerer, D., Guseva, N.G., Izotov, Y.I. & Thuan, T.X. 2000, A&A, 362, 53
- Schaerer, Contini & Pindao (1999) Schaerer, D., Contini, T. & Pindao, M. 1999, A&AS, 136, 35
- Schaerer (1999) Schaerer, D. 1999, in IAU Symposium 193, Wolf-Rayet Phenomena in Massive Stars and Starburst Galaxies, ed. K.A. van der Hucht, G. Koenigsberger & P.R.J. Eenens (San Francisco: ASP), 539
- Schaerer & Vacca (1998) Schaerer, D., & Vacca, W. D. 1998, ApJ, 497, 618
- Schaerer & de Koter (1997) Schaerer, D., & de Koter, A. 1997, A&A, 322, 598
- Schaerer et al. (1996) Schaerer, D., de Koter, A., Schmutz, W., & Maeder, A. 1996, A&A, 310, 837
- Schaller et al. (1992) Schaller, G., Schaerer, D., Meynet, G. & Maeder, A. 1992, A&AS, 96, 269
- Schlegel, Finkbeiner & Davis (1998) Schlegel, D.J., Finkbeiner, D.P. & Davis, M. 1998, ApJ, 500. 525
- Schmutz, Leitherer & Gruenwald (1992) Schmutz, W., Leitherer, C. & Gruenwald, R. 1992, PASP, 104, 1164
- Seaton (1979) Seaton, M.J. 1979, MNRAS, 187, 73
- Sersic & Pastoriza (1967) Sersic, J.L. & Pastoriza, M. 1967, PASP, 79, 152
- Sersic & Pastoriza (1965) Sersic, J.L. & Pastoriza, M. 1965, PASP, 77, 287
- Shields & Kennicutt (1995) Shields, J.C. & Kennicutt, R.C. 1995, ApJ, 454, 807
- Skillman (1989) Skillman, E.D. 1989, ApJ, 347, 883
- Shlosman (1999) Shlosman, I. 1999, in The Evolution of Galaxies on Cosmological Timescales, ed. J.E. Beckman & T.J. Mahoney (San Francisco: ASP), 100
- Smith, Norris & Crowther (2002) Smith, L.J., Norris, R.P.F. & Crowther, P.A. 2002, Ap&SS, in press
- Smith, Shara & Moffat (1996) Smith, L.F., Shara, M.M. & Moffat, A.F.J. 1996, MNRAS, 281, 163
- Smith (1968) Smith, L.F. 1968, MNRAS, 138, 109
- Stasińska, Schaerer & Leitherer (2001) Stasińska, G., Schaerer, D. & Leitherer, C. 2001, A&A, 370, 1
- Stasińska (2001) Stasińska, G. 2001, RevMexAA, in press
- Stasińska (1999) Stasińska, G. 1999, in Dwarf Galaxies and Cosmology, ed. T.X. Thuan, C. Balkowski, V. Cayette & J. Tran Thanh Van (Gif-sur-Yvette: Editions Frontieres), 259
- Stasińska & Leitherer (1996) Stasińska, G. & Leitherer, C. 1996, ApJS, 107, 661
- Storchi-Bergmann, Kinney & Challis (1995) Storchi-Bergmann, T., Kinney, A.L. & Challis, P. 1995, ApJS, 98, 103
- Storchi-Bergmann, Calzetti & Kinney (1994) Storchi-Bergmann, T., Calzetti, D. & Kinney, A.L. 1994, ApJ, 429, 572
- Telesco (1988) Telesco, C. M. 1988, ARA&A, 26, 343
- Thatte, Tecza & Genzel (2000) Thatte, N., Tecza, M. & Genzel, R., 2000, A&A, 364, L47
- Thornley et al. (2000) Thornely, M.D., Förster Schreiber, N.M., Lutz, D., Genzel, R., Spoon, H.W.W. & Kunze, D. 2000, ApJ, 539, 641
- Tremonti et al. (2001) Tremonti, C.A., Calzetti, D., Leitherer, C. & Heckman, T.M. 2001, ApJ, 555, 322
- Turner, Ho & Beck (1987) Turner, J.L., Ho, P.T.P. & Beck, S.C. 1987, ApJ, 313, 644
- Vacca & Conti (1992) Vacca, W.D. & Conti, P.S. 1992, ApJ, 401, 543
- van Zee et al. (1998) van Zee, L., Salzer, J.J., Haynes, M.P., O’Donoghue, A.A. & Balonek, T.J. 1998, AJ, 116, 2805
- García-Vargas, Bressan & Díaz (1995) García-Vargas, M.L., Bressan, A. & Díaz, A.I. 1995, A&AS, 112, 13
- Veilleux & Osterbrock (1987) Veilleux, S., & Osterbrock, D. E. 1987, ApJS, 63,295
- Vila-Costas & Edmunds (1992) Vila-Costas, M. B., & Edmunds, M. G. 1992, MNRAS, 259, 121
- Webster & Smith (1983) Webster, B.L. & Smith, M.G. 1983, MNRAS, 204, 743
- Zaritsky, Kennicutt & Huchra (1994) Zaritsky, D., Kennicutt, R.C. & Huchra, J.P. 1994, ApJ, 420, 87
- Walborn, Nichols-Bohlin & Panek (1985) Walborn, N.R., Nichols-Bohlin, J. & Panek, R.J. 1985, International Ultraviolet Explorer Atlas of O-type Spectra from 1200 to 1900 Å (Washington: NASA)
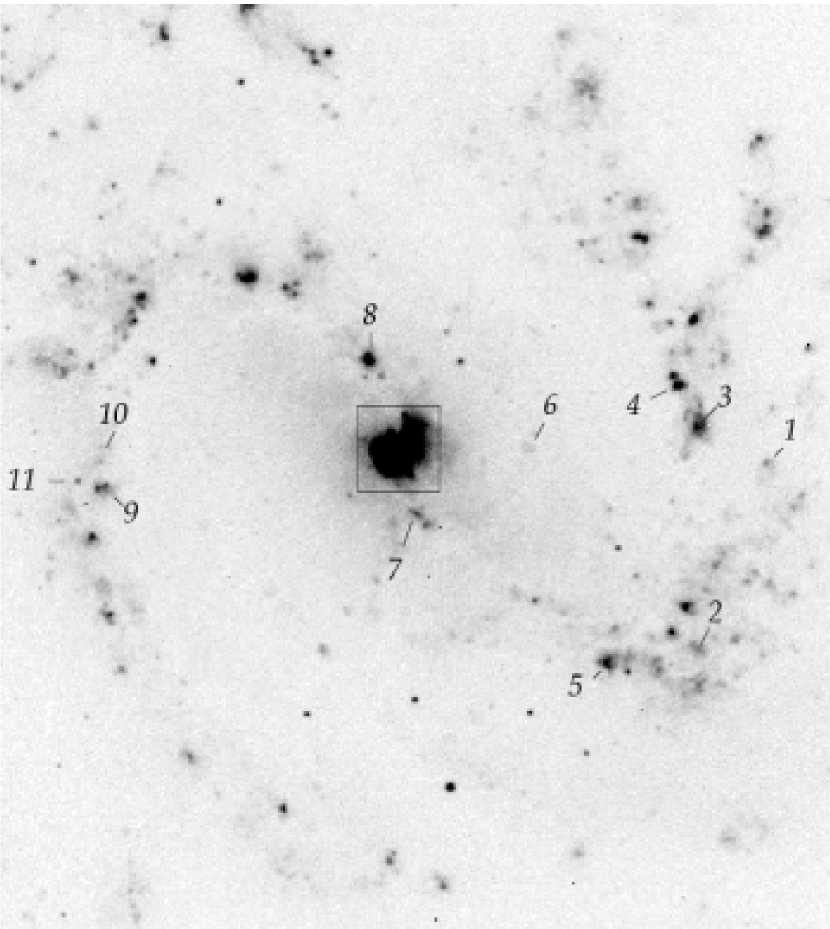
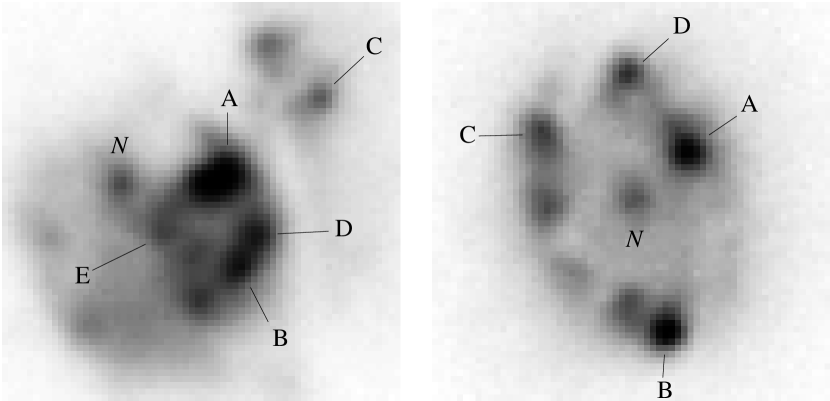
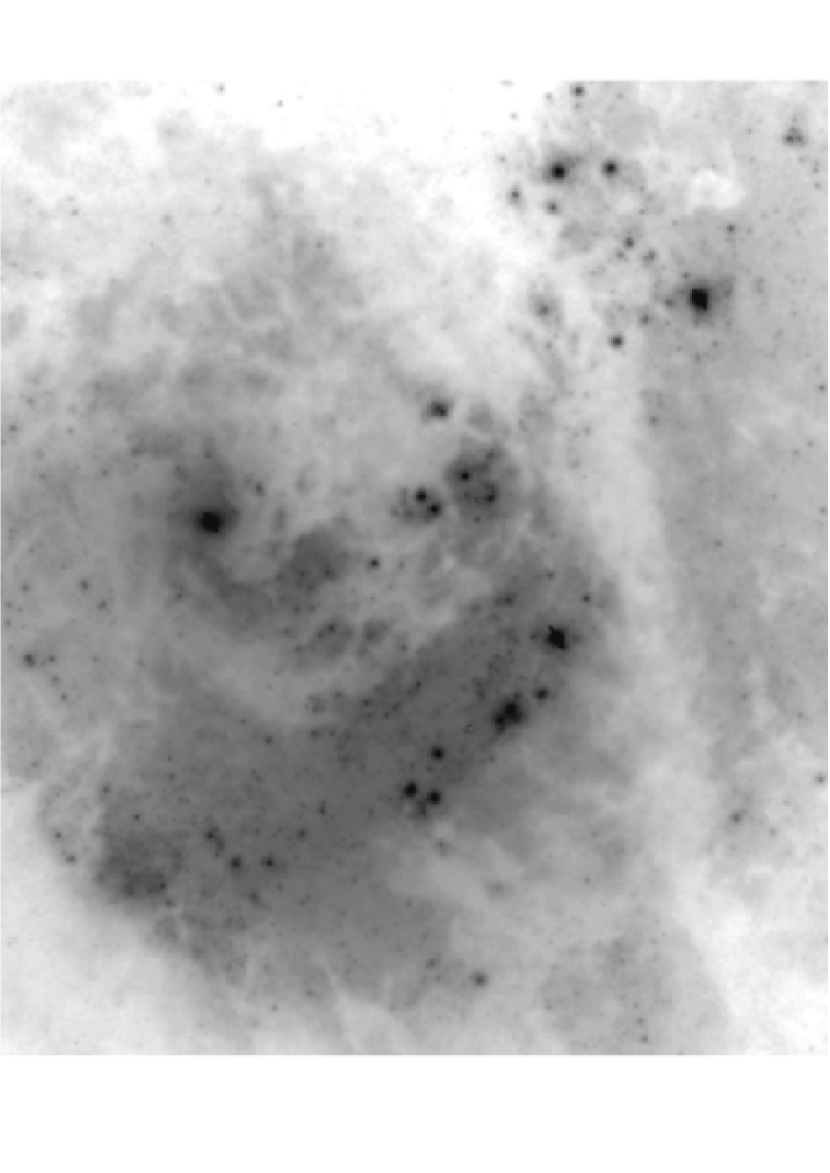


| ID | Offset from center (arcsec) | Other ID | |
|---|---|---|---|
| RA | DEC | ||
| M83 | |||
| 1 | -129 | -3 | T 230 |
| 2 | -108 | -63 | deV 10 |
| 3 | -105 | 15 | deV 12, D III, W 9 |
| 4 | -98 | 28 | deV 16 |
| 5 | -79 | -68 | deV 22, W 8 |
| 6 | -48 | 1 | T 172 |
| 7 | -10 | -21 | deV 31 |
| 8 | 8 | 32 | deV 35, D I |
| 9 | 99 | -15 | deV 49 |
| 10 | 100 | -5 | |
| 11 | 108 | -12 | deV 52, W 11 |
| A | -5.1 | -0.2 | E 8, W 2 |
| B | -6.0 | -4.1 | E 4 |
| C | -10.1 | 4.3 | E 6, W 5 |
| D | -6.9 | -2.6 | E 5, W 1 |
| E | -2.4 | -2.2 | |
| NGC 3351 | |||
| 1 | 22 | 66 | H 34 |
| 2 | 47 | -14 | H 19 |
| A | -2.6 | 2.6 | P R2, C K |
| B | -1.5 | -6.5 | P R3, C J |
| C | 4.8 | 3.6 | P R7, C B |
| D | 0.4 | 6.5 | P R1 |
| NGC 6384 | |||
| 1 | -19 | 85 | F 43 |
| 2 | 23 | -71 | F 3 |
| 3 | -3 | -87 | F 1 |
Note. — References for additional ID: T = Talbot et al. 1983; deV = deVaucouleurs et al. 1983; D = Dufour et al. 1980; H = Hodge 1974; F = Feinstein 1997; E = Elmegreen et al. 1998; C = Colina et al. 1997; P = Planesas et al. 1997; W = Webster & Smith 1983.
| ID | Ca K | CN | G band | Mg |
|---|---|---|---|---|
| (1) | (2) | (3) | (4) | (5) |
| M83 | ||||
| A | 2.3 | 1.0 | 1.0 | 2.1 |
| B | 2.2 | 0.9 | 0.8 | 1.7 |
| C | 3.1 | 1.2 | 1.2 | 1.6 |
| D | 2.2 | 0.9 | 0.6 | 1.5 |
| E | 3.1 | 1.2 | 1.5 | 2.1 |
| NGC 3351 | ||||
| A | 4.5 | 1.2 | 2.0 | 2.8 |
| B | 2.8 | 1.0 | 1.3 | 1.7 |
| C | 3.2 | 1.2 | 1.2 | 2.0 |
| D | 4.9 | 1.8 | 1.8 | 1.8 |
| ID | [O II] | [O III] | He I | [O I] | [N II] | He I | [S II] | [S II] | [Ar III] | 12 + log(O/H) | ||||
|---|---|---|---|---|---|---|---|---|---|---|---|---|---|---|
| (Å) | 3727 | 5007 | 5876 | 6300 | 6583 | 6678 | 6716 | 6731 | 7135 | (Å) | MG | E | ||
| (1) | (2) | (3) | (4) | (5) | (6) | (7) | (8) | (9) | (10) | (11) | (12) | (13) | (14) | (15) |
| M83 | ||||||||||||||
| 1 | 0.28 | 4.3 | 133.2 | 31.2 | 9.8 | 125.8 | 3.6 | 37.4 | 27.9 | 44 | 8.99 | 9.02 | ||
| 2 | 0.32 | 0.2 | 91.4 | 10.8 | 8.1 | 3.1 | 106.7 | 2.9 | 41.9 | 28.9 | 36 | 9.06 | 9.14 | |
| 3 | 0.33 | 1.2 | 71.2 | 5.0 | 6.5 | 1.6 | 101.6 | 1.8 | 34.4 | 24.7 | 1.3 | 71 | 9.09 | 9.21 |
| 4 | 0.43 | 1.3 | 111.0 | 18.5 | 9.3 | 2.4 | 145.8 | 2.7 | 30.6 | 24.3 | 3.8 | 142 | 9.03 | 9.08 |
| 5 | 0.26 | 0 | 78.8 | 10.0 | 7.4 | 112.2 | 2.4 | 31.1 | 22.6 | 1.8 | 34 | 9.07 | 9.17 | |
| 6 | 0.08 | 0 | 63.3 | 8.6 | 8.5 | 13.1 | 122.0 | 0.6 | 32.5 | 21.9 | 42 | 9.09 | 9.22 | |
| 7 | 0.83 | 1.1 | 47.6 | 13.3 | 6.2 | 3.0 | 103.0 | 2.4 | 32.9 | 26.4 | 0.5 | 26 | 9.09 | 9.25 |
| 8 | 0.65 | 0 | 54.4 | 8.3 | 7.9 | 1.5 | 118.4 | 2.5 | 24.8 | 19.9 | 1.5 | 46 | 9.10 | 9.25 |
| 9 | 0.61 | 0 | 90.5 | 9.9 | 7.7 | 1.8 | 115.7 | 1.7 | 31.1 | 22.8 | 2.2 | 87 | 9.06 | 9.14 |
| 10 | 0.40 | 0 | 182.6 | 30.7 | 10.4 | 11.3 | 135.0 | 1.9 | 66.0 | 45.6 | 108 | 8.94 | 8.96 | |
| 11 | 0.37 | 2.2 | 144.8 | 50.0 | 12.4 | 121.2 | 2.5 | 34.6 | 27.6 | 5.9 | 302 | 8.96 | 8.97 | |
| A | 0.41 | 0.6 | 59.7 | 8.6 | 7.4 | 1.5 | 159.9 | 2.6 | 22.7 | 24.7 | 1.8 | 31 | 9.09 | 9.23 |
| B | 0.25 | 1.7 | 93.8 | 19.2 | 4.5 | 184.9 | 0.6 | 41.6 | 44.0 | 7 | 9.04 | 9.11 | ||
| C | 0.71 | 1.4 | 71.6 | 11.8 | 4.1 | 153.3 | 0.2 | 34.8 | 32.7 | 1.3 | 10 | 9.08 | 9.18 | |
| D | 0.33 | 1.2 | 81.5 | 20.5 | 3.5 | 158.5 | 0.4 | 37.7 | 38.1 | 9 | 9.06 | 9.13 | ||
| E | 0.37 | 1.1 | 116.9 | 16.3 | 4.9 | 152.4 | 1.4 | 49.6 | 43.1 | 6 | 9.03 | 9.07 | ||
| NGC 3351 | ||||||||||||||
| 1 | 0.33 | 0.9 | 38.9 | 7.4 | 5.7 | 72.5 | 0.3 | 21.0 | 15.2 | 10 | 9.11 | 9.32 | ||
| 2 | 0.24 | 0.7 | 34.4 | 5.8 | 5.4 | 110.2 | 0.7 | 22.9 | 15.5 | 22 | 9.12 | 9.36 | ||
| A | 0.32 | 1.4 | 49.1 | 12.2 | 121.6 | 1.5 | 30.4 | 26.9 | 8 | 9.10 | 9.25 | |||
| B | 0.34 | 1.7 | 37.2 | 6.9 | 4.8 | 124.4 | 2.5 | 25.4 | 24.7 | 1.5 | 16 | 9.11 | 9.33 | |
| C | 0.28 | 1.8 | 29.7 | 8.2 | 96.1 | 1.1 | 26.1 | 23.2 | 12 | 9.12 | 9.37 | |||
| D | 0.73 | 1.7 | 43.6 | 9.1 | 5.3 | 129.3 | 3.8 | 29.5 | 26.7 | 16 | 9.10 | 9.29 | ||
| NGC 6384 | ||||||||||||||
| 1 | 0.08 | 3.7 | 207.5 | 63.4 | 12.6 | 88.8 | 3.0 | 50.3 | 36.4 | 46 | 8.87 | 8.89 | ||
| 2 | 0.12 | 4.4 | 171.1 | 33.6 | 11.6 | 106.5 | 2.5 | 49.7 | 32.3 | 32 | 8.95 | 8.96 | ||
| 3 | 0.38 | 3.2 | 210.2 | 33.7 | 9.0 | 4.2 | 103.9 | 3.2 | 36 | 8.90 | 8.92 | |||
| Age (Myr) | 12 + log(O/H) | |
|---|---|---|
| Model: | ||
| 0 | 8.86 | 0.91 |
| 1 | 8.93 | 1.06 |
| 2 | 9.08 | 1.51 |
| 3 | 8.93 | 1.06 |
| 4 | 8.88 | 0.95 |
| 5 | 8.93 | 1.07 |
| 6 | 9.12 | 1.65 |
| Model: 2 | ||
| 0 | 9.16 | 1.84 |
| 1 | 9.26 | 2.29 |
| 2 | 9.36 | 2.87 |
| 3 | 9.38 | 3.04 |
| 4 | 9.06 | 1.44 |
| 5 | 9.10 | 1.57 |
| 6 | 8.94 | 1.10 |
| Object | I(4650)/I() | EW(4650) |
|---|---|---|
| M83-2 | 0.14 | 5.0 |
| M83-3 | 0.15 | 8.0 |
| M83-5 | 0.27 | 6.0 |
| M83-9 | 0.27 | 20.0 |
| M83 A | 0.17 | 4.6 |
| Additional objects | ||
| M31-4 | 0.10 | 11.0 |
| M31-5 | 0.09 | 16.0 |
| M51-4 | 0.30 | 11.0 |
| M51-6 | 0.25 | 12.0 |
| NGC 3351-4 | 0.20 | 17.0 |
| NGC 3368-1 | 0.23 | 7.0 |
| Authors | Stellar | Stellar | Mass-loss |
|---|---|---|---|
| atmospheres | tracks | rate | |
| Cerviño et al. (2002) | O stars: Schaerer & de Koter (1997) | Geneva | 1-2 X |
| Kurucz (1992) | |||
| W-R: Schmutz et al. (1992) | |||
| Cerviño, Mas-Hesse & Kunth (2001) | Mihalas (1972) + Kurucz (1979) | Geneva | 1 X |
| (Mas-Hesse & Kunth 1991) | W-R: Main Sequence star | ||
| Leitherer et al. (1999) | Lejeune et al. (1997) | Geneva | 1-2 X |
| (Starburst99) | W-R: Schmutz et al. (1992) | ||
| Schaerer & Vacca (1998) | O stars: Schaerer & de Koter (1997) | Geneva | 2 X |
| Kurucz (1992) | |||
| W-R: Schmutz et al. (1992) | |||
| Fioc & Rocca-Volmerange (1997) | Lejeune et al. (1997) | Padova | 1 X |
| (PÉGASE 2) | : Clegg & Middlemass (1987) |