Status of the EPIC/MOS calibration
Abstract
The XMM-Newton observatory has the largest collecting area flown so far for an X-ray imaging system, resulting in a very high sensitivity over a broad spectral range. In order to exploit fully these performances, a very accurate calibration of the XMM-Newton instruments is required, and has led to an extensive ground and flight calibration program. We report here on the current status of the EPIC/MOS cameras calibrations, highlighting areas for which a reasonably good accuracy has been achieved, and noting points where further work is needed.
keywords:
Missions : XMM-Newton – Instrumentation : EPIC1 Introduction
In order to achieve the highest collecting power ever deployed in X-ray astronomy, the XMM-Newton observatory carries three telescopes with identical mirrors ([\astronciteJansen et al.2001]). There is one CCD camera at the focus of each mirror, the ensemble of these three cameras making up the European Photon Imaging Camera instrument (EPIC, [\astronciteTurner et al.2001]). Two of the telescopes have X-ray gratings mounted behind the mirrors, and for them the original flux is roughly equally shared between the EPIC focal plane and the Reflection Grating Spectrometer (RGS, [\astronciteden Herder et al.2001]); the two corresponding EPIC cameras are made of MOS CCDs ([\astronciteShort et al.1998]), and are the ones we will be discussing in this paper. The third telescope has an unobstructed beam, and is equipped with PN CCDs ([\astronciteStrüder et al.2001]). The calibration status of this EPIC/PN camera is discussed by [*]pferrando-WA2:Briel2002 in these proceedings.
The overall response of the MOS cameras, which is the final product of interest for the observer when analysing his data, results from the combination of the calibration of all the individual hardware parts which are encountered by the X-rays between the celestial source and the focal plane detectors. These hardware pieces, and the associated calibration items are :
-
•
the mirror, characterized by its on-axis effective area, vignetting, and point spread function,
-
•
the grating stack of the RGS (not present in the PN camera), characterized by its transmission function, and its azimuthal modulation,
-
•
the filter inside the EPIC camera, which can be either thin, medium or thick, characterized by its transmission and its homogeneity,
-
•
the focal plane detectors, characterized by the quantum efficiency, charge transfer inefficiency, homogeneity, redistribution matrix, energy scale of the CCDs, as well as their metrology.
In addition to measuring the above characteristics, the calibration tasks also include the two problems of i) the background determination, essential for the study of extended sources, and ii) pile-up treatment, essential for the study of strong point sources.
Prior to launch, a large number of subsystem calibrations have been determined by ground measurements. The most outstanding are the mirrors characterization in UV and X-rays at the CSL and Panter facilities respectively, as well as the extensive CCDs measurements performed in the ORSAY/LURE synchrotron beams (e.g. [\astroncitePigot et al.1999]). If these ground results have given a solid basis for building the calibration data base, they had obviously first to be checked and refined with flight data. Furthermore, given the few percent accuracy goal set for the calibrations, a number of calibration aspects were not entirely, or not satisfactorily, covered by the ground measurements; this is the case for example of the CCD quantum efficiency at low energy. Some others, like the metrology or background aspects, and obviously the monitoring of the CCD Charge Transfer Inefficiency degradation, can be studied with flight data only. This is the reason for the intensive flight calibration program which has followed the commissioning phase, and for the routine calibration observations which are scheduled (see list in [\astronciteEhle & Altieri2001]). A first report on these in-flight calibration activities was given by [*]pferrando-WA2:Lumb2000. Although the exercise is a rather drastic simplification of the complex calibration analysis, Table 1 gives a first cut estimate of the main contributor, ground or flight data, to each of the calibration items mentioned above.
| Item | Ground | Flight | |
|---|---|---|---|
| Telescope | On axis area | X | |
| Point Spread Function | X | ||
| Vignetting | X | ||
| Gratings | Transmission | X | |
| Azimuthal Modulation | X | ||
| Filters | Transmission | X | |
| Homogeneity | X | ||
| CCDs | Quantum efficiency | X | X |
| Charge Transf. Ineff. | X | ||
| Redistribution Matrix | X | X | |
| Homogeneity | X | ||
| Background | X | ||
| Metrology, astrometry | X | ||
| Timing | X |
In this report, and after a brief section on the basic operating modes of the MOS cameras, we will mainly describe the status of the items listed under the “flight data” column in Table 1.
2 The EPIC/MOS cameras and modes
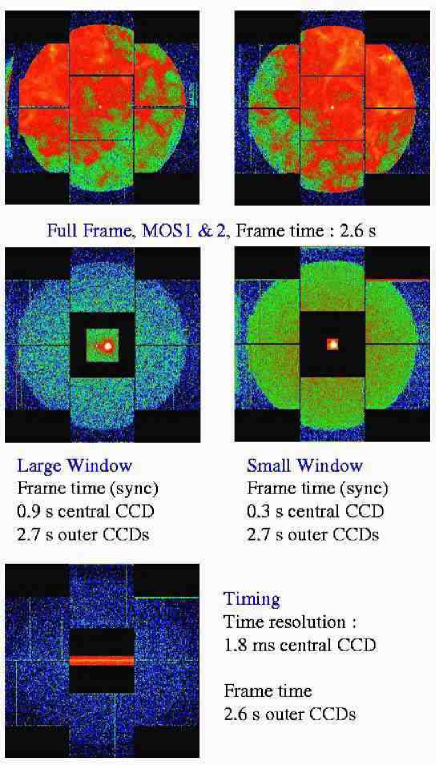
The two EPIC/MOS cameras are made of 7 CCDs each, passively cooled to an operating temperature of . Each CCD is operated in a frame transfer mode, and has a pixels imaging section, the pixel size being of 40 m, corresponding to 1.1\arcsecon the sky. The CCDs are arranged with a central CCD and 6 peripheral CCDs, as can be seen in Figure 1. There are three basic imaging modes for the operation of the camera, and one timing mode. Images taken in these modes are displayed in Fig.1; the two top images correspond to MOS1 and MOS2 for the same field, and illustrate the fact the two MOS cameras are oriented at from each other. For the timing mode, the short axis on the central chip image corresponds to a true spatial coordinate axis, while the long axis coordinate is here a measurement of time, and therefore carries no spatial information. Note that the peripheral CCDs are always operated in Full Frame, whatever the camera mode.
3 Imaging characteristics
3.1 Metrology and absolute astrometry
Contrary to the PN camera which has a monolithic CCD, the seven CCDs of the MOS camera are mounted individually, and it was necessary to measure their relative positions, in X, Y, and rotation angle using celestial sources. The method for refining the MOS metrology involves iteratively improving boresight and CCD offset values in the Current Calibration Files (CCFs) for both cameras, using known star fields. Starting with the most recent iteration of the CCFs calibrated event lists were produced using the MOS processing chain in the SAS, which were in turn used for generating cleaned, band limited, images suitable for source searching. The SAS source detection chain was then used to generate source lists. Using the maximum likelihood this source list was then used in conjunction with the USNO catalogue positions to i) remove gross offsets in the central CCDs via shifts in the 3 boresight Euler angles, and ii) optimise the outer CCD displacements by minimising the rms offset error between the detected positions and catalogue positions for each CCD.
This processing was performed on the Orion Molecular Cloud field, the \objectNGC 2516 open cluster, and the Lockman Hole field. This has allowed the source detection error to be reduced to approx 0.4\arcsecand the rms offset errors between detections and catalogue positions to approx 0.5\arcsecfor MOS1 and 0.55\arcsecfor MOS2. This accuracy, which is half the pixel size, is probably at the limit of this single field method and further improvements in the MOS metrology will have to come through statistical studies of large numbers of detections over the lifetime of XMM-Newton. This work has now been fully reflected in the CCFs.
It must be clear that these numbers characterize the internal focal plane metrology, and not the absolute pointing accuracy reached in the absence of any positional reference in the X-ray image. This last question has been addressed by [*]pferrando-WA2:Tedds_Watson2002 in these proceedings, who performed a statistical study on a very large number of fields; they have found that the absolute astrometric error of the XMM-Newton coordinate frame has a distribution with a FWHM of 3–4\arcsecper axis (R.A. and Dec), and 0.3\degrin roll angle.
3.2 Point Spread Function
The knowledge of the image shape (Point Spread Function, PSF) of a point-like celestial source, and of the related Encircled Energy Fraction (EEF) quantity, are obviously of prime importance regarding the aspects of source detection and spectral extraction. The PSFs of the XMM-Newton mirrors have a rather complex shape, even for a source located on axis, as shown in Figure 4. Taking into account this complex shape is however unnecessary for most of the applications, in which the observer is simply interested in knowing the EEF for a given circular extraction radius, or in comparing the observed radial profile to the expected one for a point-like source.
For these purposes, [*]pferrando-WA2:Ghiz&Mol2002 have looked for a simple analytical representation of the PSF. They showed that a simple king profile, with only two parameters, represents the data very well. An example of fit is given in Figure 4. This study was done on a large set of data, up to 12 arcmin off-axis position. For each selected source, the core radius and the slope parameter were determined for seven energy intervals, when allowed by the statistics. [*]pferrando-WA2:Ghiz&Mol2002 found that these parameters have a simple linear dependence on the energy and off-axis angle of the incoming photons. They also provide a range of validity, both in and , for this modeling, based on the availability of adequate point source observations. It must be noted in particular that the high energy and high off-axis angle regions are excluded from the range of application of this model. This parametrisation has been fully implemented in the CCFs.
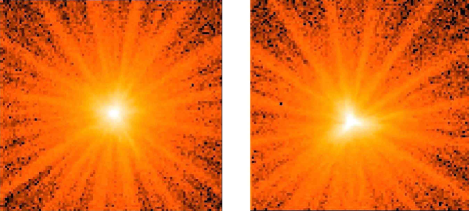


Although the precise core shapes look quite different for the two MOS cameras (Fig. 4), their encircled energy, at least on axis, is not drastically different. For example, Figure 4 shows the on-axis EEF for a ring with inner and outer radii of 5 and 60\arcsecrespectively, typical of extraction regions for piled-up sources. The difference in EEF for the two cameras, if not considered properly, would translate into a difference of about on the slope of a power law spectrum.
3.3 Vignetting
Compared to the PN camera, the MOS telescopes vignetting is complicated by the presence of the gratings arrays. They introduced an azimuthal variation, as well as an additional energy dependence above about 5 keV ([\astronciteErd2000]). The in flight measurements were performed mainly with observations of \objectG21.5-0.9, on axis and at 10\arcminand 12\arcminoff-axis positions. Although the variations with energy are not completely understood and are still under investigation, the uncertainty on the vignetting corrections is estimated to be better than 5 % up to 10\arcminoff-axis, and 10 % at 12\arcmin.
4 Spectral response
4.1 Effective area
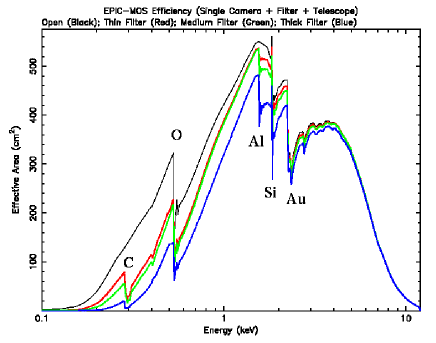
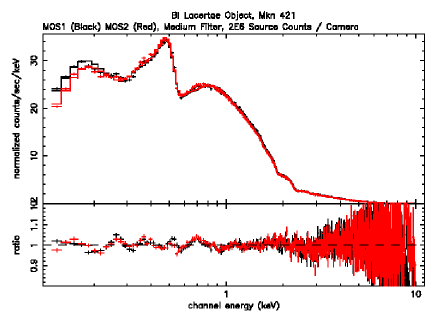
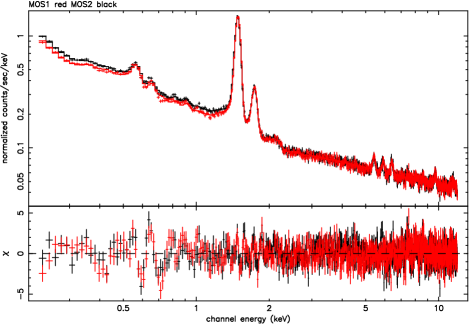
The EPIC/MOS effective area, as displayed in Figure 6, combines the mirror area, the gratings and filter transmissions, and the CCD quantum efficiency. Starting from ground calibration data for all these quantities, [*]pferrando-WA2:Sembay2002 have succeeded in working out the corrections necessary to minimize the residuals obtained when fitting on-axis sources with simple spectra, such as BL Lacs. The main changes to the ground calibration data made in this work were on the Au edge for the mirror response, and the CCD quantum efficiency below one keV, a quantity which was poorly determined from the synchrotron measurements. Figure 6, from [*]pferrando-WA2:Sembay2002, illustrates the quality of the fit obtained on a spectrum of \objectMrk 421, with more than 2 millions counts per camera. The residuals are below over all instrumental edges, and on the full range from to keV.
Regarding now the overall spectrum, the quality of the fit does obviously not ensure the correctness of the parameters. It does however allow detailed cross-calibrations between the EPIC instruments to be performed, as well as between EPIC and the RGS within XMM-Newton, or between EPIC and other X-ray instruments. This is discussed separately in these proceedings by [*]pferrando-WA2:Griffiths2002, [*]pferrando-WA2:Haberl2002, [*]pferrando-WA2:denHerder2002, and [*]pferrando-WA2:Snowden2002. There is generally good agreement between the EPIC instruments however small discrepancies still remain, namely differences in values (by ) on the low energy side, and differences of for spectral indices on the high energy side. Besides that, future work will also be dedicated to the lowest energies, below eV, for which unexpected features have sometimes been observed.
4.2 Charge Transfer Inefficiency
Although they have been designed to be highly resilient to radiation, the MOS CCDs were expected to experience a slow degradation of their parallel Charge Transfer Inefficiency due to their constant irradiation by high energy protons. By reducing the magnitude of charge packets which originates furthest from the read-out node, CTI has the effect of shifting energies toward lower values, and to broaden lines. The monitoring of the CTI degradation is performed via the measurement of Al, Mn-K and -K lines generated by an internal calibration source, which is turned on via a special position of the filter wheel (closed w.r.t. the sky). These “calibration source” observations have been regularly scheduled at the beginning of each orbit when XMM-Newton is still in the outer parts of the radiation belts in a too high radiation environment to allow meaningful astrophysical observations.
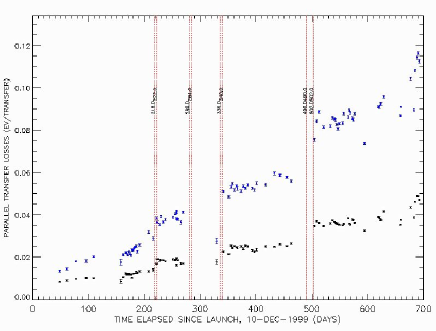
The detailed study of the CTI evolution is presented by [*]pferrando-WA2:Bennie2002 in these proceedings. The CTI has been observed to increase smoothly with time, with jumps coincident with large solar flares, as shown in Figure 7. Algorithms have been designed to make a first order correction to the CTI effect, and are included in the SAS 5.3 version. Because of its statistical nature however, it is not possible to fully recover the CTI degradation. [*]pferrando-WA2:Bennie2002 have shown that there is still a 21 % broadening left on the FWHM of the Mn-K line measured on the full CCD chip, when the SAS 5.3 correction is used.
Beyond improving the CTI correction in the form currently implemented in SAS 5.3, a more drastic improvement under investigation is to adopt the concept of a deviation map as done for the Chandra ACIS. This would allow to account for column to column individualities which have been evidenced, and reduce the amount of unrecoverable damage to 5 eV/year for the Mn-K line FWHM, which had a pre-launch value of 125 eV. It remains that the CTI has an irreducible line broadening effect, which has now to be taken into account in the redistribution function.
4.3 Redistribution function
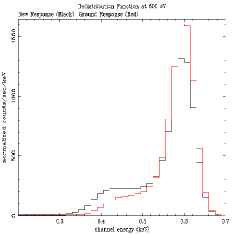
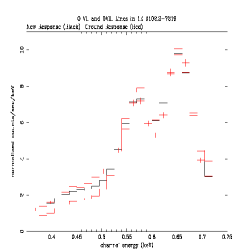
The ground calibration, in particular with monochromatic beams, has shown that the redistribution function (rmf) is rather complex. In particular, below 1 keV it has a significant low-energy shoulder which becomes increasingly important when the incident energy decreases. This is believed to be due to an incomplete charge collection for X-rays which are absorbed close to the surface layer ([\astronciteShort et al.1998]).
[*]pferrando-WA2:Sembay2002 have been carefully modelling the rmf, using sources with strong emission lines, such as \objectSNR 1E0102.2-7219. As is shown in Figure 8, there has been a significant increase in the surface loss component, which required modifications to the rmf w.r.t. the pre-launch shape. The rmf are currently handled together with the effective area has stand-alone files. As mentioned above, the CTI degradation implies that a time dependent rmf has to be considered now; the way to implement that is under investigation.
Finally, we note here that a single redistribution function (as well as effective area) is found to be adequate for describing the response of the MOS for all imaging modes; it is not however adequate for the timing mode, which spectral response has still to be worked out.
5 Background
The background in EPIC has been triggering extensive discussions and work inside the EPIC calibration team (and outside…), starting right after launch. A lot of work has been devoted to characterize this background and to look for ways of reducing it to a minimum. The XMM User Handbook gives a pretty complete account of the different components of the background found in EPIC, MOS and PN, which we will not be repeated here. We simply recall the main features of this background, and give the latest developments, in particular those from [*]pferrando-WA2:Lumb2002a, [*]pferrando-WA2:Lumb2002b.
It is now recognized that the EPIC background is made of 4 components, being :
-
1.
A low energy electronic noise,
-
2.
A transient soft proton “flare” induced,
-
3.
A quiet time high energy protons induced,
-
4.
The diffuse cosmic X-ray background.
The first of this list is occuring at low energy, and is due to electronic interferences. It is selectively removed by the standard SAS processing.
The second background is the one causing the strong “brightening” of the image inside the field of view, as in Figure 1. It is induced by soft energy protons, below a few hundred keV, that directly reach the detectors via scattering through the mirrors. It happens in an unpredictable way, and has a highly variable light curve when it is present. Moreover, it has been shown that its spectral shape is also highly variable. Despite numerous attempts, it was impossible to find any signature of these events that would allow them to be distinguished, and hence filtered out, from real X-rays. In practice, and except for very bright sources, periods contaminated by such a background have to be excluded from the analysis.
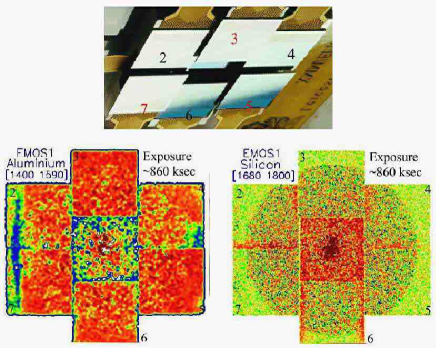
The characterization of the third background is the one on which most of the progress has been done. It was demonstrated to have only secular variations, as expected for an origin being from interactions of high energy cosmic-rays inside and around the detectors. Its spectrum is made of two components : a continuous component, and a line component. The continuous component has a hard spectrum, displayed on Figure 9, probably generated by the combination of fluctuations in the energy losses suffered by the cosmic-rays when they go through the CCDs, and of Compton electrons due to interaction of the gamma-rays produced in the material around the CCDs. As expected because of its origin, there is no evidence for a spatial variation of this component in the full focal plane. The line component is made up fluorescent lines, particularly Al and Si. Contrary to the continuous component, the distribution of these fluorescent lines, as well as weaker ones as Au for example, have a strong spatial dependency. This is evidenced in Figure 10 which are maps made in the Al and Si lines respectively. They were generated from the sum of basically all the PV and CAL phases observations, with only SNR observations excluded because of their strong line emissions. Because of potential residuals from the on-axis sources, the central part of the central CCD should not be considered significant here; however all the other structures are significant, and correspond to variations of about 15 % from one area to the other. This is readily explained by the localisation of the CCDs, also depicted in Figure 10 : the outer CCDs detect more Al than the central one, because of their closer proximity to the Aluminium camera housing, while the Si excess seen in the central CCD is explained as Si escape lines from the back of the outer CCDs, which are located above the central one. The same explanation holds for the excess on the edges of CCDs 2, 4 and 6.
In order to cope with this variable background, particularly for extended sources, while awaiting for the development of an adequate SAS task to model it, [*]pferrando-WA2:Lumb2002a has prepared a background template file and has made it available. This data set is characterised by i) a long exposure time, over 400 ks, sufficient for most observations, ii) an homogeneous collection of observations all at high galactic latitudes, with no bright sources, and all with the thin filter position. On each of the fields, a source detection task was applied and led to about 10 objects per field to be excluded, corresponding typically to objects with a flux brighter than ergs cm-2s-1. In the final set built by co-adding all observations, the excision of these point sources led to only a small % level of local depression. As evidenced in Figures 3 and 4 of [*]pferrando-WA2:Lumb2002b, this set gives results very similar to the one noted above regarding the fluorescent lines spatial dependency.
Finally, by comparing the spectrum derived from this data set with a model of the particle induced background spectrum, [*]pferrando-WA2:Lumb2002b has found a reasonable power law index of 1.4 for the extragalactic background. The same index is also found by [*]pferrando-WA2:deLuca2002, with a different data set and using a somewhat different approach to model the particle background modelisation. The absolute normalisation however has still a rather large uncertainty.
6 Areas in progress
The above sections have stressed the areas for which most of the calibration work has been performed. In short, this is basically the understanding of the response to on-axis sources, observed in all imaging modes, the characterization of the telescope vignetting, and of the background components. There are a number of calibration areas which have been less touched up to now, although this does not mean that they have particular problems. Some of them are briefly discussed below.
6.1 Pile-up
Although this is not strictly a calibration issue, it is important to confirm the conditions for which pile-up has a sizeable effect on the spectra. Work is in progress on this area. Preliminary results confirm the theoretical analysis of [\astronciteBallet1999] which stresses that pile-up effects are minimized by selection of isolated pixels (pattern 0). Awaiting for a potential correction of these pile-up effects, the observer has to exclude regions too heavily piled-up for spectral extractions.
6.2 Off axis analysis
At high energy, and apart from a slight difference in their depletion depth, the EPIC CCDs have homogeneous responses. This is not the case below 300 eV, for which ground measurements have shown evidence of large inhomogeneities for some of the CCDs. While the high energy QE variations from one CCD to the other is implemented in the response functions, this is not the case yet of these inhomogeneities at very low energy within each CCD. One needs however to verify their presence in flight data, a task extremely difficult because of the interplay between redistribution and efficiency. Similarly, the thick filters have known inhomogeneities below the C edge which are not implemented yet.
If a work as extensive as the one performed for on-axis sources has not been done yet, and will probably be impossible to do for the full focal plane given the observation time it would request, once can say however that the analysis of “simple” extended sources, as clusters, has not revealed any significant problem for the overall off-axis response.
6.3 Timing mode
The timing functionalities of the timing mode have been verified to be as expected. They are presented by [*]pferrando-WA2:Kuster2002 in these proceedings. The response function however is quite different from that of the imaging modes. This is due to the fact that rows are binned within the sequencer program that reads out the CCDs. Also, contrary to imaging data, the timing data do not include any information on the energy in the pixels surrounding the X-ray event. This renders the tasks of noise cleaning and energy determination extremely different from that of imaging data, and extremely difficult. This is still to be done properly, and at the time of writing, the spectra obtained in timing mode cannot be accurately modeled.
7 Conclusions
We have presented here a short summary of the status of the calibration of the MOS cameras of EPIC, as they are less than two years after the start of the initial calibration phase. Most of the results have made, or are going to make, their way into version 5.3 of SAS. Apart from the references given here, the interested reader can find a lot of details on the calibration status in the technical notes maintained on the SOC web page. If the status for on-axis sources can be considered as quite good, we have also outlined a number of areas where work is still needed and will be done by the calibration team.
Acknowledgements.
The constant support of PPARC, CEA, CNES and ASI, which fund a very large part of the calibration activities on the MOS cameras of EPIC, is gratefully acknowledged.References
- [\astronciteBallet1999] Ballet J. 1999, A&AS 135, 371
- [\astronciteBennie et al.2002] Bennie P., Tiengo A., Altieri B., et al. 2002, ESA SP-488
- [\astronciteBriel et al.2002] Briel U., et al. 2002, ESA SP-488
- [\astronciteEhle & Altieri2001] Ehle M., Altieri B. 2001, SOC note XMM-SOC-CAL-PL-0001
- [\astronciteErd2000] Erd C. 2000, SOC note XMM-SOC-PS-TN-0038
- [\astronciteGhizzardi & Molendi2002] Ghizzardi S., Molendi S. 2002, ESA SP-488
- [\astronciteGriffiths et al.2002] Griffiths R.G., Briel U.G., Dadina M. et al. 2002, ESA SP-488
- [\astronciteHaberl et al.2002] Haberl F., Bennie P., Briel U.G. et al. 2002, ESA SP-488
- [\astronciteden Herder et al.2001] den Herder J.W., Brinkman A.C., Kahn S.M. et al. 2001, A&A 365, L7
- [\astronciteden Herder et al.2002] den Herder J.W., Bennie P., Briel U.G. et al. 2002, ESA SP-488
- [\astronciteJansen et al.2001] Jansen F., Lumb D., Altieri B. et al. 2001, A&A 365, L1
- [\astronciteKuster et al.2002] Kuster M., Kendziorra E., Benllochl S., et al. 2002, ESA SP-488
- [\astroncitede Luca & Molendi2002] de Luca A., Molendi S. 2002, ESA SP-488
- [\astronciteLumb2002a] Lumb D.H., 2002a, SOC-Note
- [\astronciteLumb2002b] Lumb D.H., 2002b, ESA SP-488
- [\astronciteLumb et al.2000] Lumb D.H., Gondoin Ph., Turner M.J.L. et al. 2000, Proc. SPIE, 4140, 22
- [\astroncitePigot et al.1999] Pigot C., Belsole E., Bennie P. et al. 1999, Proc. SPIE 3765-27
- [\astronciteSembay et al.2002] Sembay S., Turner M.J.L., Bennie P. et al. 2002, ESA SP-488
- [\astronciteShort et al.1998] Short A.D., Keay A., Turner M.J.L. 1998, Proc. SPIE 3445, 13
- [\astronciteSnowden et al.2002] Snowden S.L. et al. 2002, ESA SP-488
- [\astronciteStrüder et al.2001] Strüder L., Briel U., Dennerl K. et al. 2001, A&A 365, L18
- [\astronciteTedds & Watson2002] Tedds J., Watson M. 2002, ESA SP-488
- [\astronciteTurner et al.2001] Turner M.J.L., Abbey A.F., Arnaud M. et al. 2001, A&A 365, L27