The UV line spectrum of the soft X–ray transient XTE J1118+480: a CNO-processed core exposed
Abstract
We compare UV spectra of the recent soft X–ray transients XTE J1118+480 and XTE J1859+226. The emission line strengths in XTE J1118+480 strongly suggest that the accreting material has been CNO processed. We show that this system must have come into contact with a secondary star of about , and an orbital period hr, very close to the bifurcation value at which nuclear and angular momentum loss timescales are similar. Subsequent evolution to the current period of 4.1 hr was driven by angular momentum loss. In passing through a period of 7.75 hr the secondary star would have shown essentially normal surface abundances. XTE J1118+480 could thus represent a slightly later evolutionary stage of A0620–00. We briefly discuss the broad Ly absorption wings in XTE J1118+480.
Key Words: accretion, accretion discs - stars: individual XTE J1118+480 -
X–rays: stars.
1 INTRODUCTION
The recently-discovered soft X–ray transient (SXT) XTE J1118+480 ( = KV UMa; Remillard et al 2000) lies at high galactic latitude, close to the Lockman Hole in the local ISM. The exceptionally low interstellar absorption permits unprecedented wavelength coverage (Mauche et al 2000, Hynes et al 2000, McClintock et al 2001b, Chaty et al 2002).
A low amplitude photometric modulation with period 4.1 hr was reported by Cook et al (2000) and Uemura et al (2000). Dubus et al (2000) present spectroscopy showing an emission line radial velocity ‘S-wave’ modulation at a period close to this. This period was recently confirmed as orbital, and a mass function of was measured by McClintock et al (2001a) and Wagner et al (2001). Therefore the accretor clearly has to be a black hole.
We present the UV line spectrum of XTE J1118+480, which we compare with that of another recent SXT, XTE J1859+226. Full analyses of these HST spectra will be presented elsewhere (Hynes et al 2002a,b; Chaty et al 2002). Here we focus on the prior evolution of XTE J1118+480.
2 OBSERVATIONS
We obtained HST spectra of XTE J1859+226 near the peak of outburst on 1999 October 18 and 27 and November 6. At each epoch far-UV spectra were obtained using the low-resolution G140L grating and wide (0.5 arcsec) slit, yielding wavelength coverage 1150–1730 Å and resolution Å. We used the standard pipeline data products except that the spectral extraction was done by hand using the iraf implementation of optimal extraction. This gave a significantly cleaner removal of geocoronal emission lines (principally Ly and O i 1302 Å). After extracting the one-dimensional spectra (with the pipeline wavelength and flux calibrations), we resampled them onto a common wavelength grid and took an exposure-time weighted average.
For XTE J1118+480, we obtained high-resolution (echelle) spectra using the E140M grating and 0.2 arcsec square aperture on 2000 April 8, 18 and 29, May 28, June 24, and July 8. The pipeline extraction was adequate, although a few high pixel values had to be replaced by hand. The extracted spectra were rebinned into 0.2 Å bins and averaged with exposure-time weighting. The process is clearly not perfect. In particular, there are a number of abrupt steps in the spectrum at longer wavelengths. These artefacts, at per cent level, arise from inconsistencies in the relative flux calibration of adjacent echelle orders.
Figure 1 gives the UV spectra of XTE J1118+480 and XTE J1859+226. Both show interstellar absorption features. In XTE J1118+480 these appear sharper because the spectral resolution was higher.
2.1 EMISSION LINES
The difference in the equivalent widths of the emission lines in the two systems is striking (Fig. 1, Table 1; Haswell et al 2000). In XTE J1859+226 C iv is the strongest line, with N v, C iii, O v, Si iv, and He ii also strongly present. These emission line strengths are roughly as expected for an X-ray bright LMXB (cf Sco X-1, Kallman, Boroson, & Vrtilek 1998). Compared to cataclysmic variables (CVs), the N v/C iv ratio is relatively large, while Si iv/C iv is small, as expected for a high ionisation parameter (Mauche, Lee & Kallman 1997). In contrast, for XTE J1118+480, the carbon and oxygen lines are undetectable, while the N v emission appears enhanced. A similar anomalous emission line spectrum is seen in the magnetic CV AE Aqr, in which the N v is much stronger than the C iv line (Jameson et al 1980, Eracleous et al 1994).

| Line flux (erg s-1 cm-2) | Equivalent width (Å) | Gaussian FWHM (Å) | ||
|---|---|---|---|---|
| XTE J1859+226 | N v | 13 | ||
| O v | 15 | |||
| Si iv | 17 | |||
| C iv | 11 | |||
| He ii | 10 | |||
| XTE J1118+480 | N v | 14 | ||
| N iv | ||||
| O v | ||||
| Si iv | 18 | |||
| C iv | ||||
| He ii | 15 |
The N iv 1718 line would add a valuable additional constraint on the interpretation of the line spectrum in terms of the photo-ionisation conditions, so we carefully assessed our XTE J1118+480 spectra to determine whether it was present. Unfortunately our well-exposed E140M echelle spectrum stops at 1710 and our E230M echelle spectrum suffers from shorter total exposure and the low sensitivity of the NUV MAMA in this region. 1718 falls right on the boundary between the two STIS MAMA detectors, and consequently neither is optimised at this wavelength. We find no strong () line in the spectrum, but this upper limit provides a weak constraint due to the poor quality of our data at this wavelength.
2.2 ABSORPTION LINES
The Ly absorption in XTE J1118+480 (Fig. 1) clearly has a sharp core, which is probably interstellar, with very broad wings. The continuum slope is well constrained by the spectrum longwards of . Extrapolating this continuum is suggestive of broad Ly extending from to . The combination of noise, N v emission, and absorption features hinder measurement of the Ly wings, but they definitely extend at least from to .
The broad absorption may be damped Ly from the H i in our galaxy (Bowen, priv. comm.). If we assume, instead, that it is due to absorbing gas executing Keplerian motion around the black hole, and take the largest width suggested by our data, the full width implies velocities of and absorbing material at distances as close as . Taking the securely determined line width would imply absorption from Keplerian material at .
An independent line of argument based on the shape of the spectral energy distribution, and dependent on the value of the neutral hydrogen column density, , has been used to estimate the disc inner radius (Hynes et al 2000, McClintock et al 2001, Chaty et al 2002). Hynes et al (2000) estimate , a choice which suggests the disc is terminated at . This is inconsistent with the Keplerian interpretation of the broad Ly absorption. Alternatively, informed by the Chandra data, McClintock et al (2001) suggest that could be as high as , with . Chaty et al (2002) adopt , which leads to . The latter two values are consistent with the Keplerian interpretation of the broad Ly absorption.
The feature near does not have an obvious identification and we believe it may be spurious, although it does not correspond to any known instrumental artefacts (Sahu 2001 priv. comm.). This issue is under investigation.
3 IONISATION DIFFERENCES VERSUS ABUNDANCE ANOMALIES
The C iv 1550 and the N v 1240 lines are both resonance lines of lithium-like ions, and are produced under essentially the same physical conditions. Kallman and McCray (1982, hereafter KM82) present theoretical models of compact X-ray sources predicting the ionisation structure expected in a wide variety of astrophysical situations, including galactic X-ray binaries. KM82 present 8 distinct models; in each one the source luminosity, , spectral shape, and gas density, , are fixed. For each model the output includes the dependence on ionisation parameter,
| (1) |
(where is the distance from the central source) of the abundances (as a fraction of the total elemental abundance) of the ions of common elements.
KM82 consider (i) three species detected in both XTE J1118+480 and XTE J1859+226: He ii, Si iv, and N v; and (ii) three species detected only in the spectrum of XTE J1859+226: C iv, C iii, and O v. Strikingly similar ionisation parameters were required for the two sets of lines in all models. In almost all cases the presence of N v places the tightest constraint on , and almost invariably this is encompassed within the range producing C iv. In the minority of cases where there exists an ionisation parameter which produces N v and not C iv, this range also produces O v. Consequently, KM82 give no set of photoionisation parameters which would predict production of N v in XTE J1118+480 while suppressing the C iv and O v.
The X-ray spectrum of XTE J1118+480 is clearly different from that of XTE J1859+226: the former is an extended power-law (Hynes et al 2000, McClintock et al 2001, Frontera et al 2001, Chaty et al 2002) with a cut-off at keV indicative of the low-hard state, and often attributed to an advection-dominated accretion flow (ADAF; e.g. Esin et al 2001); while in the early stages of the outburst the latter was dominated by the soft thermal black-body disk spectrum which turned over by keV (Hynes et al 2002a), typical of the high-soft state. Ho et al (2000) note that the characteristically harder ionising spectrum of an ADAF lowers the effective ionisation parameter, and hence favours the production of lower ionisation species. Hence, if anything, the differences in the X-ray spectra should cause C iv to be relatively prominent (compared with N v) in XTE J1118+480, rather than being suppressed as we observe.
Hamann and Ferland (1992) used the observed C iv 1550 and N v 1240 lines to estimate the N/C abundance ratio in high redshift QSOs. Their photionisation calculations show that for a broad range of ionisation parameters the N v 1240 / C iv 1550 line ratio is lower at lower metalicities even when the N/C abundance ratio is kept constant. This means that if anything we should expect the N v 1240 line to be suppressed relative to C iv 1550 in XTE J1118+480 which is a halo object, and consequently might be expected to have a lower metalicity than that of XTE J1859+226.
A definitive abundance analysis for XTE J1118+480 would require exact knowledge of the geometry, densities, and ionising spectrum in the regions emitting the UV lines. While Hynes et al (2000, 2002b) gives some information on the geometry, and Chaty et al. (2002) gives good coverage of the X-ray spectrum, the EUV spectrum remains open to significant uncertainty (compare the range of dereddened EUV spectra in Chaty et al 2002, McClintock et al 2001, Esin et al 2001, Hynes et al 2000, Merloni et al 2000). Furthermore the range of densities present in the UV line emitting gas is difficult to determine. Consequently a quantitative abundance determination of the type carried out in stellar photospheres, where the physical conditions are well-known, is not possible.
Hence it is impossible to rule out definitively a contrived spectrum and gas distribution which would produce the set (i) lines while suppressing the set (ii) lines. However as
-
•
set (i) and set (ii) ions require essentially identical ranges of
-
•
the ionising spectrum of XTE J1118+480 might be expected to favour C iv relative to N v
-
•
the lower metallicity expected for XTE J1118+480 might be expected to boost the C iv1550 / N v 1240 line ratio
by far the simplest explanation of our observed UV line spectra is that a substantial underabundance of carbon is present in the surface layers of the mass donor star in XTE J1118+480.
In XTE J1118+480 (as in AE Aqr), the underabundance of carbon compared to nitrogen strongly suggests that the material in the accretion flow is substantially CNO processed (Clayton 1983). If the CNO bi–cycle achieves equilibrium, it converts most CNO nuclei into 14N. At the lower temperatures typical in MS stars (which we shall suggest as the progenitor of the companion in XTE J1118+480) this conversion is much more at the expense of 12C than 16O, and in fact 17O increases. Hence the oxygen abundance is not expected to decrease by much in XTE J1118+480 and this argument does not of itself explain the observed weakness of O v 1371. However C iv1550, N v 1240 are resonance lines, whose ratio must be regarded as a robust indicator of conditions in the line emitting gas, whereas O v 1371 is a subordinate line, which may not be formed efficiently in a low density photoionized gas. We thus regard the spectrum of XTE J1118+480 as indicating CNO processing.
4 THE EVOLUTION OF XTE J1118+480
The spectrum shown in Figure 1 implies that the companion star in XTE J1118+480 must be partially nuclear–evolved and have lost its outer layers, exposing inner layers which have been mixed with CNO–processed material from the central nuclear–burning region.


Mass transfer must therefore have been initiated from a somewhat evolved and sufficiently massive donor of , and thus with an initial period hr. The main difficulty in understanding the current status of XTE J1118+480 is to explain its observed short orbital period; in general, significant nuclear evolution is associated with a period increase, rather than the inferred decrease.
There are two ways in which this decrease could have occurred:
(i) the system came into contact with initial secondary/primary mass ratio and underwent a phase of thermal–timescale mass transfer until . At the end of this phase the period would have either decreased or not increased greatly. Subsequent orbital angular momentum loss could then pull the system in to the observed hr. This case is similar to the likely evolution of AE Aqr (Schenker et al., 2002a).
(ii) the system came into contact with already, and subsequent evolution was driven by angular momentum loss towards shorter periods. This case resembles that proposed for A0620–00 by de Kool et al (1983), with a severe additional constraint: the donor must be sufficiently evolved to provide the observed surface abundance ratios. This requires a near–equality of the nuclear and orbital angular momentum loss timescales (cf Fig. 2). Put another way, must have been very close to the ‘bifurcation period’ defined by Pylyser & Savonije (1988).
Case (i) above can be ruled out by the current system parameters. At the end of thermal timescale mass transfer we must have , which would require a donor mass and an orbital period hr. But for such a system (cf Fig. 2), implying evolution to longer periods, in stark contrast to the current 4.1 hr. Put another way, there is an upper limit on the binary mass for case (i) evolution to give nuclear–evolved donors at short orbital periods. The near equality can only realistically hold if magnetic braking dominates angular momentum loss, so we require at the end of the thermal–timescale episode. But since there, we must have total binary mass in case (i) evolutions.
We are therefore left only with case (ii) above. The secondary mass when the system came into contact is now constrained to be close to : CNO processing excludes significantly lower masses, while the requirement for excludes significantly higher masses. Figs. 3, 4 show the evolution of such a system: a MS star was allowed to evolve and fill its Roche lobe in a 15 hr binary with a BH. The predicted mass transfer rate throughout the evolution, including its current value , shows that the system would indeed have appeared as a soft X–ray transient, according to the irradiated–disc criterion for black–hole systems given by King, Kolb & Szuszkiewicz (1997). It should be noted that the change in C/N is mostly due to a drastic depletion of 12C, supplemented by a more modest increase in 14N. The total O abundance at the surface has only decreased very little; in fact the O/N ratio is reduced by only a factor of 3 to 5 at most, predominantly due to the increase of N. Interestingly, this model also passes through at around , showing much weaker N enhancements (i.e. almost normal abundances, cf Fig. 3). Thus it can also be considered a reasonable model for A0620–00. A subsequent paper (Schenker et al., 2002b) will explore this and related evolutions in detail.
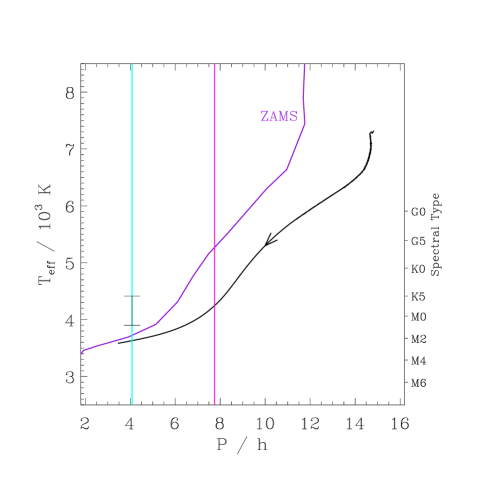
Finally we can compare further properties of the secondary in our model to observations: Figure 4 shows the evolution of effective temperature with orbital period, together with a simple mapping to spectral types. The procedure is based on a conversion of observed colours to spectral types (Beuermann et al., 1998) and a set of non-grey stellar atmospheres (Hauschildt et al., 1999) providing the colours for each set of stellar boundary conditions. For solar metallicity the resulting SpT turns out to be only a function of effective temperature with a very weak dependence on surface gravity. However this mapping should only be considered a first estimate, as the evolutionary code in its current form still uses grey atmospheres. Furthermore the whole conversion is based on an observed set of unevolved stars and theoretical ZAMS models, i.e. no fully self-consistent application to a partially evolved MS star such as shown in Fig. 4 is possible for the time being. Allowing for the uncertainties described above, our model may be slightly too cool (M2 rather than K5-M1 as mentioned in McClintock et al (2001), or K7-M0 by Wagner et al (2000). Similar evolutionary tracks of strongly evolved CVs are known to get hotter again (Baraffe & Kolb, 2000) at short periods, so a confirmed secondary spectral type would provide insight as to the state of nuclear evolution in the donor star of XTE J1118+480. Figure 4 shows that in any case that the donor will currently appear to be close to the ZAMS, and thus that the distance estimate derived by McClintock et al (2000) on this basis is likely to be quite good.
5 Conclusions
We have compared the UV spectra of XTE J1118+480 and XTE J1859+226. The former shows strong evidence of CNO processing, which tightly constrains the evolution of the system. XTE J1118+480 must have first reached contact with the donor star having a significantly nuclear–evolved core, at a period where nuclear and angular momentum loss timescales were comparable. This in turn constrains the end point of the earlier common–envelope phase: immediately after the common–envelope phase the system had a wide enough separation that significant nuclear evolution could occur before contact was achieved. In a future paper we will investigate such evolutions systematically.
6 Acknowledgments
CAH and RIH gratefully acknowledge the superb support of Tony Roman, Kailash Sahu, and all involved in the implementation of our time-critical HST observations. Support for proposals GO-08245 and GO-08647 was provided by NASA through a grant from the Space Telescope Science Institute, which is operated by the Association of Universities for Research in Astronomy, Inc., under NASA contract NAS5-26555. This work was supported by the Leverhulme Trust F/00-180/A. Theoretical astrophysics research at Leicester is supported by a PPARC rolling grant. We thank Christian Knigge for discussion about the nature of the feature, and an anonymous referee for useful comments.
References
- [1] Baraffe, I., Kolb, U. 2000, MNRAS, 318, 354
- [2] Barret, D., Olive, J.F., Boirin, L., Done, C., Skinner, G.K., Grindlay, J.E. 2000, ApJ, 533, 329
- [3] Beuermann, K., Baraffe, I., Kolb, U., & Weichhold, M. 1998, A&A, 339, 518
- [4] Chaty, S. et al 2002, in prep
- [5] Clayton, D.D. 1983, “Principle of Stellar Evolution and Nucleosynthesis”, (Chicago: University of Chicago Press)
- [6] Cook, L., Patterson, J., Buczynski, D., Fried, R. 2000, IAU Circ 7397
- [7] de Kool, M., van den Heuvel, E.P.J., Pylyser, E. 1987, A&A 183, 47
- [8] Dubus, G., Kim, R.S.J., Menou, K., Szkody, P., Bowen, D.V. 2001, ApJ, 553, 307.
- [9] Eracleous, M., Horne, K., Robinson, E.L., Zhang, E.-H., Marsh, T.R., Wood, J.H. 1994, ApJ, 433, 313
- [10] Esin, A, McClintock, J.E., Drake, J.J., Garcia, M.R., Haswell, C.A., Hynes, R.I., Muno, M.P. 2001, ApJ 555, 483.
- [11] Frontera et al 2001, ApJ, 546, 1027
- [12] Hamann, F. and Ferland, G. 1992, ApJLett, 391, 53
- [13] Haswell, C.A., Hynes, R.I., King, A.R., Stull, J., Ioannou, Z., Webb, N.A. 2000, IAU Circ 7407
- [14] Hauschildt, P.H., Allard, F., Baron, E. 1999, ApJ, 512, 377
- [15] Ho, L.C., Rudnick, G., Rix, H.-W., Shields, J.C., McIntosh, D.H., Filippenko, A.V., Sargent, W.L., Eracleous, M. 2000, ApJ, 541, 120
- [16] Hynes, R.I., Haswell, C.A., Chaty, S., Cui, W., Shrader, C.R. 2000, HEAD, 32, 3111
- [17] Hynes, R.I., Mauche, C.W., Haswell, C.A., Shrader, C.R., Cui, W., Chaty, S. 2000, ApJLett, 539, L37
- [18] Hynes, R.I., Haswell, C.A., Chaty, S., Shrader, C.R., Cui, W. 2002a, MNRAS, in press, astro-ph/0111333
- [19] Hynes, R.I. et al 2002b, in prep.
- [20] Jameson, R.F., King, A.R., Sherrington, M.R., 1980 MNRAS, 191, 559
- [21] Kallman, T., Boroson, B., Vrtilek, S.D. 1998, ApJ, 502, 441
- [22] Kallman, T. & McCray, R. 1982, ApJSupp, 50, 263 (KM82)
- [23] King, A.R., Kolb, U., & Szuszkiewicz, E., 1997, ApJ, 488, 89
- [24] Kolb, U. 1992 PhD Thesis, LMU Munich
- [25] Mauche, C.W., Hynes, R.I., Charles, P.A., Haswell, C.A. 2000, IAU Circ 7401
- [26] Mauche, C.W., Lee, Y.P., Kallman, T.R. 1997, ApJ, 477, 832
- [27] McClintock, J.E., Garcia, M.R. , Caldwell, N., Falco, E.E. , Garnavich, P.M., Zhao, P., 2001a, ApJLett, 551, L147.
- [28] McClintock, J., Garcia, M. , Zhao, P., Caldwell, N., Falco, E. 2000, IAU Circ 7542
- [29] McClintock, J.E., Haswell, C.A., Garcia, M.R., Drake, J.J., Hynes, R.I., Marshall, H.L., Muno, M.P., Chaty, S. et al 2001b, ApJ, 555, 477.
- [30] Morton, D.C. 1991, ApJSupp, 77, 119
- [31] Pylyser, E., Savonije, G.J. 1988, A&A 191, 57
- [32] Remillard, R., Morgan, E., Smith, D., Smith, E., 2000, IAU Circ 7389
- [33] Revnivtsev, M., Sunyaev, R., Borozdin, K. 2000, A&A, 361, L37
- [34] Schenker, K. et al 2002a,b, MNRAS, in prep
- [35] Uemura M. 2000, IAU Circ 7418
- [36] Wagner, R.M., Foltz, C.B., Shahbaz, T., Casares, J., Charles, P.A., Starrfield, S.G., Hewett, P. 2001, ApJ, 556, 42.
- [37]