Chandra Observations and the Mass Distribution of EMSS1358+6245: Toward Constraints on Properties of Dark Matter
Abstract
Chandra observations of lensing galaxy clusters have now provided accurate dark matter profiles for several objects in which the intracluster medium is likely to be in hydrostatic equilibrium. We discuss Chandra observations of the mass profile of one such cluster, EMSS1358+6245. We find no evidence for flattening of the mass density profile at radii greater than h kpc . This result, and similar findings from Chandra observations of other clusters, appear to rule out models in of dark matter self-interaction proposed to explain the flat cores of low-surface brightness galaxies.
keywords:
Missions: Chandra – galaxies:clusters:individual (EMSS1358+6245) – cosmology:dark matter1 Introduction
X-ray emission from the intracluster medium (ICM) is a powerful diagnostic of the structure of galaxy clusters. If the ICM has reached hydrostatic equilibrium within the cluster gravitational potential, one can infer the run of thermal pressure with radius from X-ray imaging spectroscopy, and so obtain the cluster mass distribution. The assumption of hydrostatic equilibrium, as well as the reliability of the estimated mass enclosed within fiducial radii, can be checked by comparison with other mass constraints obtained, for example, from gravitational lensing. Despite some famous cases of diasagreement between lensing and X-ray mass estimates, it was shown by [*]mbautz-B3:all98 that the X-ray data themselves can be used (along with accurate optical cluster positions) to select objects which are likely to be in hydrostatic equilibrium. Morevover, the superb angular resolution of the current generation of X-ray observatories makes it relatively straightforward to detect departures from hydrostatic equilibrium (e.g. [\astronciteMarkevitch et al.2000];[\astronciteVikhlinin et al.2001]; [\astronciteMachacek et al.2002]) in the ICM.
Our purpose here is to note that this new observational capability, which provides not only accurate masses, but also accurate mass distributions for clusters, may actually lead to constraints on the nature of dark matter itself. To illustrate this point we discuss Chandra results for the cluster EMSS1358+6245. These results are described in detail elsewhere ([\astronciteArabadjis et al.2002]) so we provide only a summary here.
2 Observations and Analysis
EMSS1358+6245, at redshift z=0.33, is a luminous (L erg s-1, 0.2 - 4.5 keV; [\astronciteFabricant et al.1991]) cluster in which a cooling flow ([\astronciteBautz et al.1997]; [\astronciteAllen1998]) has been reported. Both strong ([\astronciteFranx et al.1997]) and weak ([\astronciteHoekstra et al.1998]) gravitational lensing have been used to constrain the cluster mass distribution. The mean ASCA temperature (7 keV; [\astronciteAllen1998]) and the ROSAT surface brightness profile together imply a mass of about , consistent with the lensing studies.
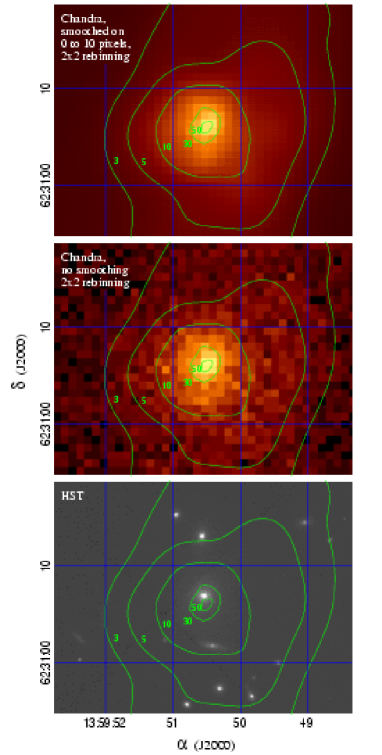
We summarize here a 55 ks Chandra observation of EMSS1358+6245 with the ACIS/S3 detector performed in 2000 September. Smoothed and raw Chandra images of the cluster core are shown and compared with an HST optical image in Figure 1. We confirm the presence of a low-temperature, high-X-ray-surface-brightness component at the center of the cluster ( h kpc). The peak of the X-ray emission coincides with the location of the brightest cluster galaxy within the astrometric errors of about 1\arcsec (6 h kpc), and the isophotes are roughly circular. These characteristics suggest that the ICM is likely to be in hydrostatic equilibrium in the cluster gravitational potential ([\astronciteAllen1998]) so that the X-ray data will yield a reliable cluster mass profile.
We have fit spatially resolved Chandra spectra from 10 concentric annuli simultaneously for the electron density and temperature of the ICM in each of 10 corresponding concentric, spherical shells. We used the MEKAL model in XSPEC, fixing the metal abundance at 0.3 solar, and fit for a single Galactic column common to all annuli. We obtain an acceptable fit to the Chandra data with a two-temperature model in each of the two central bins (which have \arcsec h kpc); a single-temperature model fits well at larger radii. We have assumed pressure equilibrium between the hot and cool components in order to determine their densities. Results are shown in Figure 2. As expected from the ASCA and ROSAT data, a single-temperature component does not fit the data well in the cluster core.

We find that the hot component is isothermal within measurement errors. The weighted mean temperature is keV, in good agreement with ASCA results. The resulting mass profile is shown in the left panel of Figure 3 (One of the mass profile points, shown as a dashed box, is unphysical due to stochastic fluctuations in the fitted temperature profile.) We have fit the so-called universal density profile of Navarro, Frenk and White (1997; NFW), with (in integral form) to the data; the result is the solid curve in the left panel of Figure 3. Best-fit values for the model parameters are also shown in Figure 3. The concentration parameter , where is the virial radius; see NFW for details.
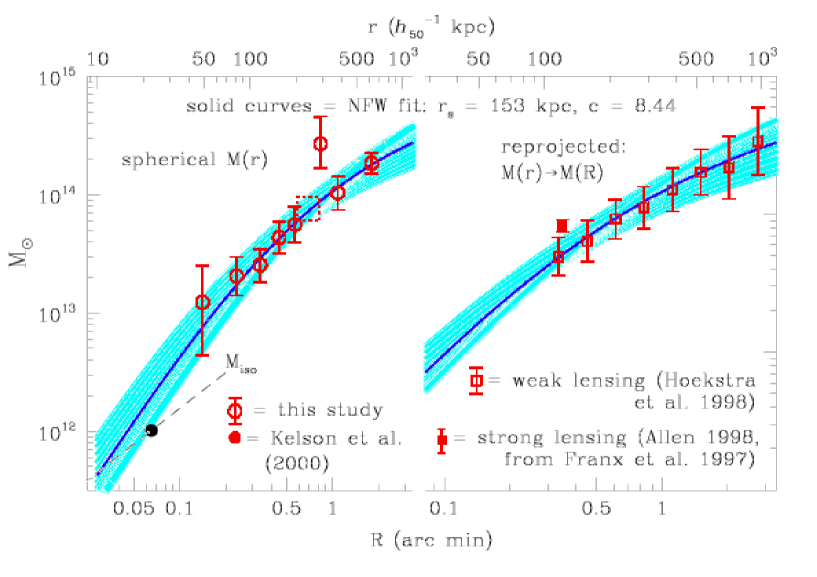
We have projected our best-fit NFW model mass profile onto the plane of the sky and, in the right panel of Figure 3, compare it to the weak lensing results of Hoekstra et al. (1998; open squares) and the strong lensing result derived by [*]mbautz-B3:all98 from the arc discovered by Franx et al. (1997; filled square). The X-ray mass profile is in excellent agreement with the weak lensing results. The strong lensing point exceeds the both the X-ray and weak lensing mass estimates by a factor of about 1.6. We note that the image reconstruction of [*]mbautz-B3:fra97 suggests that an elliptical mass distribution is required to explain the strong lensing data. The spherical mass estimate dervied by [*]mbautz-B3:all98 may thus be an overestimate.
3 Discussion
The agreement between the X-ray and weak lensing data is strong evidence for the reliability of the Chandra mass profile. Note that the X-ray data probe much smaller radii (h kpc) than the lensing data, and so measure the mass distribution at higher densities. They thus may constrain dark matter’s cross-section for non-gravitational self-interaction. In particular, we note that the mean density within the central h kpc is M⊙ pc-3, comparable to the central density in dwarf galaxies (Firmani et al. 2001). The flat density profiles in the cores of such galaxies have been cited, along with other data, as possible evidence for self-interacting dark matter (e.g. Spergel & Steinhardt 2000; Davé et al. 2001). Assuming the cross-section for any such interaction is identical in the cores of galaxies and clusters, the mean-free path for interactions will be similar since the densities are similar. Given the much larger size of cluster cores, the optical depth for scattering would actually be higher, and the presumed effects of self-interactions greater, in clusters than in dwarf galaxies, at least if the systems are of comparable age.
Indeed, [*]mbautz-B3:yos00 have simulated the formation of cluster-sized halos of self-interacting dark matter with various interaction cross-sections. They find that even if the dark matter interaction cross-section is as small as 0.1 cm2 g-1, i.e., about 50 times smaller than that required to produce flat cores in the galaxy simulations of [*]mbautz-B3:dav01, a cluster-sized halo would show a flattened core with radius of order 80 h kpc.
We find no evidence for a flat core in the density profile of EMSS1358+6245. A fit of a softened isothermal sphere density profile, with , where is the velocity dispersion and the core radius, yields h kpc. In this sense, our observations are inconsistent with any non-gravitational dark matter interaction with a cross-section exceeding 0.1 cm2 g-1. Other Chandra mass profiles published to date, e.g., for Hydra-A ([\astronciteDavid et al.2001]), Abell 2390 ([\astronciteAllen et al.2001a]), Abell 1835 ([\astronciteSchmidt et al.2001]) and RXJ1347.5-1145 ([\astronciteAllen et al.2001b]), all show mass core radii no greater than h kpc, and are thus consistent with our limit on any dark-matter interaction cross-section.
4 Summary
A Chandra observation of EMSS1358+6245 has produced a mass profile in good agreement with weak lensing results. Both X-ray and weak-lensing mass estimates are somewhat lower than the strong lensing estimate at h kpc. From the X-ray-derived mass profile we place an upper limit of h kpc on the radius of any flat core in the dark matter density profile. Taken together with the self-interacting dark matter simulations of [*]mbautz-B3:yos00, this result rules out a velocity-independent dark matter interaction cross-section large enough to explain the flat mass density profiles in dwarf galaxies.
Acknowledgements.
This work was supported by NASA under contract NAS8-37716 and NAS8-38252.References
- [\astronciteAllen et al.2001b] Allen, S.W., Schmidt, R.W. & Fabian, A.C. 2001b MNRAS submitted (astro-ph/0111368)
- [\astronciteAllen et al.2001a] Allen, S.W., Ettori, S. & Fabian, A.C. 2001a MNRAS 324, 877
- [\astronciteAllen1998] Allen, S.W. 1998, MNRAS 296, 392
- [\astronciteArabadjis et al.2002] Arabdjis, J., Bautz, M. and Garmire, G. 2002, ApJ 572 (in press; astro-ph/0109141)
- [\astronciteBautz et al.1997] Bautz, M. W., Honda, E.P., Ventrella, J. and Gendreau, K. C. 1997, in X-ray Imaging and Spectroscopy of Cosmic Hot Plasmas, ed. F. Makino & K. Mitsuda (Tokyo: Universal Acad. Press) 75
- [\astronciteDavé et al.2001] Davé, R., Spergel, D. N., Steinhardet, P.J. & Wandelt, B.D. 2001 ApJ 547, 574
- [\astronciteDavid et al.2001] David, L.P., Nulsen, P.E.J, McNamara, B. R., Forman, W., Jones, C., Ponman, T., Roberston, B. & Wise, M. 2001 ApJ 557,546
- [\astronciteFabricant et al.1991] Fabricant, D., McClintock, J. & Bautz, M. W., 1991 ApJ 381, 33
- [\astronciteFirmani et al.2000] Firmani, C., D’Onghia, E., Avial-Reese, V., Chincarini, G., and Hernandez, X., 2000 MNRAS 315, L29
- [\astronciteFranx et al.1997] Franx, M., Illignworth, G. D., Kelson, D. D. , van Dokkum, P. G. & T ran, K.-V., 1997 ApJ, 486, L75
- [\astronciteHoekstra et al.2000] Hoekstra, H., Franx, M. & Kuijken, K., 2000 ApJ 532, 88
- [\astronciteHoekstra et al.1998] Hoekstra, H., Franx, M., Kuijken, K. & Squires, G., 1998 ApJ 504, 636
- [\astronciteMachacek et al.2002] Machacek, M.E., Bautz, M.W., Canizares, C.R. & Garmire, G.P., 2002 ApJ 567 (in press)
- [\astronciteMarkevitch et al.2000] Markevitch, M., et al., 2000 ApJ 541, 542
- [\astronciteNavarro, Frenk & White1997] Navarro, J. F., Frenk, C. S. & White, S. D. M., 1997 ApJ 490, 493
- [\astronciteSchmidt et al.2001] Schmidt, R. W., Allen, S.W. & Fabian, A.C. 2001 MNRAS 327, 1057
- [\astronciteSpergel & Steinhardt2000] Spergel, D. N. & Steinhardt, P.J. 2000 Phys. Rev. Lett. 84, 17
- [\astronciteVikhlinin et al.2001] Vikhlinin, A., Markevitch, M. & Murray, S.S., 2001 ApJ 549, L47
- [\astronciteYoshida et al.2000] Yoshida, N., Springel, V., White, S.D.M., & Tormen, G. 2000 ApJ 544, 87