The far-infrared energy distributions of Seyfert and starburst galaxies in the Local Universe: ISO photometry of the 12m active galaxy sample111Based on observations with ISO, an ESA project with instruments funded by ESA Member States (especially the PI countries: France, Germany, the Netherlands and the United Kingdom) with the participation of ISAS and NASA
Abstract
New far-infrared photometry with ISOPHOT, onboard the Infrared Space Observatory, is presented for 58 galaxies with homogeneous published data for another 32 galaxies all belonging to the 12 galaxy sample. In total 29 Seyfert 1’s, 35 Seyfert 2’s and 12 starburst galaxies, about half of the 12m active galaxy sample, plus 14 normal galaxies for comparison. The ISO and the IRAS data are used to define color-color diagrams and spectral energy distributions (SED). Thermal dust emission at two temperatures (one cold at 15-30K and one warm at 50-70K) can fit the 60–200 SED, with a dust emissivity law proportional to the inverse square of the wavelength. Seyfert 1’s and Seyfert 2’s are indistinguishable longward of 100m, while, as already seen by IRAS, the former have flatter SEDs shortward of 60m. A mild anti-correlation is found between the [200 - 100] color and the “60m excess”. We infer that this is due to the fact that galaxies with a strong starburst component, and thus a strong 60m flux, have a steeper far-infrared turnover. In non-Seyfert galaxies, increasing the luminosity corresponds to increasing the star formation rate, that enhances the 25 and 60m emission. This shifts the peak emission from around 150m in the most quiescent spirals to shorter than 60m in the strongest starburst galaxies. To further quantify these trends, we followed Rowan-Robinson and Crawford (1989) in identifying with the IRAS colors three idealized infrared SED: that of pure quiescent disk emission, pure starburst emission, and pure Seyfert nucleus emission. Even between 100 and 200m, the quiescent disk emission remains much cooler than the starburst component. Seyfert galaxies have 100–200m SED ranging from pure disks to pure starbursts, with no apparent contribution from their active nuclei at those wavelengths.
1 INTRODUCTION
One of the main goals of selecting a complete sample of galaxies using the IRAS 12 flux was the definition of a complete and largely unbiased sample of active galaxies in the local universe. This selection was done twice, the first one producing a list of 26 Seyfert type 1 galaxies (hereinafter Seyfert 1’s) and 32 Seyfert 2’s (Spinoglio & Malkan, 1989), out of a sample of 390 galaxies from the IRAS PSC (1988). The second was a selection of 53 Seyfert 1’s, 63 Seyfert 2’s, two blazars and 38 high-luminosity non-Seyferts (i.e. galaxies with without an obvious Seyfert type optical spectrum) out of a sample of 893 galaxies (Rush, Malkan & Spinoglio, 1993) (RMS) from the IRAS Faint Source Catalog (Moshir et al., 1992). It was found that the 12 flux is approximately a constant fraction ( 1/5) of the bolometric flux in active galaxies. Moreover, also for non-Seyferts (mostly spirals) 12 selection was found to be the closest available approximation to selection by a limiting bolometric flux, which is about 14 times at 12 (Spinoglio et al., 1995) (hereinafter S95). It therefore follows that deep surveys at 12 should provide complete samples at different bolometric flux levels of normal and active galaxies, which will not suffer the strong selection effects present both in the optical-UV and far-infrared. We refer to the introduction of the paper presenting the original sample (Spinoglio & Malkan, 1989) for the arguments in favor of the mid-infrared selection. After the determination by RMS, two more works derived the local 12 luminosity function (Xu et al., 1998; Fang et al., 1998) and a new selection of galaxies from the IRAS database at 12 is in progress (Alexander & Aussel, 1999).
The study of the infrared energy distributions of active and starburst galaxies in the local universe is not only important by itself, but also because it is needed to understand galaxy evolution. Deep ISO surveys have shown that indeed a strong evolution is present at z 1, indicating that many galaxies at that epoch were experiencing phases of extremely high luminosities in the far-infrared, likely to represent violent events of star formation [see e.g. the reviews of Malkan (2000), Genzel & Cesarsky (2000), and Franceschini et al. (2001)]. Also, the peak of the energy output of galaxies lies in the far-infrared. This makes redshifted galaxies appear relatively brighter at the longest far-infrared and sub-millimeter wavelengths; surveys in these wavebands are therefore capable of discovering very distant galaxies at substantial cosmic look-back times (see e.g. Malkan, 2001). It is thus even more urgent to understand the local infrared emission, to provide a firm base for comparing the local universe “activity” with the properties and evolution observed in the recent and upcoming cosmological surveys (e.g. Franceschini et al., 2001; Malkan, 2001).
Several papers have reported ISO photometric data on galaxies in the unexplored range from 100-200, but most of these are on few individual sources, often the prototypes of the various classes of active, starburst and normal galaxies. The only exceptions are the study of 42 objects (20 Seyfert 1’s and 22 Seyfert 2’s) (Pérez García & Rodríguez Espinosa, 2000)(PGRE) of the CfA Seyfert galaxy sample (Huchra & Burg, 1992), the study of a random sample (Haas et al., 2000) of 17 Palomar Green quasars (Schmidt & Green, 1983), the study of 22 radio-loud and radio-quiet quasars (Polletta et al., 2000) and one of 10 galaxy/quasar pairs from the 3CR catalog (Meisenheimer et al., 2001). The CfA Seyfert galaxy sample is smaller (48 objects) than the 12 active galaxy sample (158 objects), and is selected by the optical light of the galaxy, which may bias the results significantly. For example, a recent work on high resolution radio observations of the Seyfert galaxies of the 12 sample (Thean et al., 2000, 2001), report a detailed statistical analysis of the redshift distributions and 12 flux distributions of Seyfert 1’s and 2’s and compared these with the CfA sample. In the 12 active galaxy sample the two types of Seyferts are equally distributed according to redshift, their 12 flux density distributions are well matched and therefore Seyfert 1’s and 2’s are equally luminous in the IRAS 12 band. On the contrary, the CfA Seyfert sample has different redshift distributions for the two Seyfert types, and is biased against including distant Seyfert 2’s.
The three latter works on quasars (Haas et al., 2000; Polletta et al., 2000; Meisenheimer et al., 2001) are complementary to ours since most of the sources have much higher redshifts (). However, these studies are not suited to studying the population of active galaxies in the local universe.
The present work is based on observations of 90 galaxies, randomly selected from the 12 galaxy sample, including 29 Seyfert 1’s, 35 Seyfert 2’s, 12 high luminosity non-Seyferts (hereafter called starburst galaxies) and 14 normal galaxies for comparison. It is the largest sample of active galaxies for which far-infrared photometry is available out to 200. Since it contains both active and starburst galaxies it is expected to be the basis for firm and statistically significant conclusions on the far-infrared behaviour of galaxies in the local universe.
The paper is organized as follows: section 2 describes the observations collected and reduced longward of 100; section 3 shows the results in terms of average energy distributions and presents a derivation of “pure” infrared emission components, for quiescent disks, starbursts, and Seyfert nuclei; section 4 shows the color-color diagrams of the various classes of galaxies that can be explained by thermal emission from dust and presents a correlation between the far infrared color [200 - 100] and the 60 excess; section 5 shows the correlations among the different luminosities and between colors and luminosities. Section 6 presents our conclusions. Finally, in the Appendix we present the results obtained shortward of 100.
2 OBSERVATIONS
The Infrared Space Observatory (ISO) (Kessler et al., 1996) data presented here were obtained in the open time proposal “IR energy distributions and imaging of the complete sample of 12 active galaxies”. Photometric data at several wavelengths between 60 and 200 were collected with the two array cameras, C100 and C200 of the ISOPHOT imaging photo-polarimeter (Lemke et al., 1996). In particular, we present in this section the ISOPHOT photometric results obtained with the C200 detector array in the spectral range 120-200 on 39 objects belonging to the 12 active galaxies sample. The data obtained with the C100 array camera are presented in Appendix 1, for two reasons: first, these data are less precise than the C200 data, having larger uncertainties, due either to a difficult subtraction of the background and to a less accurate calibration (see the discussion in Appendix 1); second, these data are less important, because all the galaxies of the sample have good IRAS detections at 12, 25, 60 and 100m. To increase the statistics, we have also analyzed ISOPHOT C200 archive data on other 19 galaxies and we have included in the discussion ISOPHOT literature data on another 32 galaxies, bringing the present sample to 90 objects. This is therefore currently the largest sample of active galaxies in the local universe studied to 200m.
The journal of the C200 ISOPHOT observations is given in Table 1, which presents the details of each single observation that we analysed: for each source are given the coordinates of the observations, the redshift, the galaxy type (hereafter we call starburst nuclei sbn the high luminosity non Seyfert galaxies), the ISO observation identification number and the total integration time spent on-source.
All of the detections are consistent with that expected for unresolved point sources. That is, none of the galaxies were significantly resolved by the large ISOPHOT PSF, which is estimated to be 100 FWHM in diameter at 120 m [e.g. see Fig.4.8 of Laureijs et al. (2001)].
The C200 ISOPHOT observations were collected in chopped photometric mode in the five filters centered at 120, 150, 170, 180 and 200. The data reduction has been performed using the PIA222PIA is a joint development by the ESA Astrophysics Division and the ISOPHOT consortium led by the MPI fur Astronomie, Heidelberg. Contributing institutes are DIAS, RAL, AIP, MPIK and MPIA. software, version 7.2 (Gabriel et al., 1997) and the results were verified with version 8.0. Data were deglitched, corrected for non-linearity and then for each ramp a straight line was fitted. In most cases the first signal per chopper plateau was discarded since the detector response was not stabilized. Then the data were corrected for dark current and for signal dependence on the ramp integration time and calibrated with the internal Fine Calibration Source (FCS1). The same reduction procedure was applied also to the calibration data. An independent reduction of several of these observations was made by one of us (MM) at IPAC333IPAC (Infrared Processing and Analysis Center) is part of the Division of Physics, Mathematics and Astronomy at Caltech, Pasadena, and the Space and Earth Sciences Program Directorate at JPL, Pasadena., those results are in good agreement with the values published here. We realize there are faint outer parts to some of these galaxies, and this was even measured and discussed in the appendix of RMS. However, we find that only a small fraction of the total flux is actually missed due to the central concentration of the light, and that our colors should be very reliable anyway, one of the main points of this study.
The ISOPHOT flux densities have been corrected using the color correction, from the PIA (Gabriel et al., 1997), corresponding to black-body functions with an emissivity law proportional to the inverse square of the wavelength. The chosen dust temperatures were the lowest color temperature that we derive from the [200 - 100] color of each class of galaxies, derived from the positions in the far-infrared color-color diagrams presented in section 4. They are 20K for Seyfert 1’s and normal galaxies, 25K for Seyfert 2’s and 30K for high luminosity non-Seyferts. At these temperatures, the color correction is, however, quite small (less than 15%).
Because all the galaxies have good detections in all the IRAS bands, we have constructed their spectral energy distributions using the new ISOPHOT data together with the IRAS data given in RMS. In Fig. 1 we present the spectral energy distributions of each individual object. Table 2 presents the measured flux densities and 1 statistical errors in the five ISOPHOT C200 wavebands for each object. Absolute calibration uncertainty is in the range 10—30%.
For most of the sources a good general agreement is found between IRAS and ISO measurements and the C200 values place themselves on a smooth curve running from the IRAS to the ISO photometry. Data for Arp 220, NGC 6240 and IZW 1 were taken from the archive. The results reported here agree well with those published in the literature for the first two sources (Klaas et al., 1997) while the C200 data of IZW 1 of Table 2 agree with those published by Haas et al. (2000) but not with those by PGRE. The measurements were taken with different observational setups, the ones reported here were gathered in chopping mode while those by PGRE in staring mode and the resulting values are much lower in this latter case. We ascribe this difference to the different background subtraction procedure and it could be due to an overestimation of the background value by this latter authors. They indeed did not detect IZw 1 at 200m while we obtained a signal-to-noise ratio larger than 18 at the same wavelength. Data taken towards NGC 6090 (MK 496) reported here are lower than those published by Calzetti et al. (2000) by a factor of 1.3-1.7, however they agree within the large errors quoted by these authors.
In the following analysis we also included the ISO results published by several authors on galaxies belonging to the 12m galaxy sample: 17 CfA Seyfert galaxies (PGRE), 10 normal galaxies (Siebenmorgen, Krugel & Chini, 1999), 4 nearby spiral galaxies (Alton et al., 1998) and the Seyfert 2 NGC 7582 (Radovich et al., 1999). The CfA Seyfert 1’s included are: NGC 3227, NGC 3516, NGC 4051, NGC 4151, MK 766, MK 231, NGC 5033, NGC 5548, MK 817 and NGC 7469, while the CfA Seyfert 2’s are: NGC 1143/44, NGC 3079, NGC 3982, NGC 4388, NGC 5256, NGC 5929 and NGC 1068. The normal galaxies included are: MK 323, MK 332, MK 555, MK 538, MK 799, NGC 5719, NGC 6918, NGC 7083, UGC 2936 and UGC 2982 and the nearby spiral galaxies are: NGC 134, NGC 660, NGC 5194 and NGC 5236.
Table 3 gives the integrated mid-to-far infrared luminosity from 8 to 250m for all 90 galaxies, including those taken from the literature. This luminosity has been computed using the formula:
| (1) |
with the the flux densities in Jy and = 13.48, 5.16, 2.58, 1.0, 1.04, 1.02, 0.95, 0.65, 0.48, for = 12, 25, 60, 100, 120, 150, 170, 180 and 200 , respectively444The four frequency intervals () relative to the IRAS wave-bands have been taken from Rowan-Robinson and Crawford (1989), while the others have been computed from Table 2.7 of Laureijs et al. (2001).. We adopted a value of .
To show how the present sub-sample is representative of the 12m active galaxy sample, we have computed average redshift and completeness of the sub-sample and compared with that of the original sample (RMS). The average redshift of the Seyfert 1’s in the present sub-sample is , compared to the value of of the original sample; that of the Seyfert 2’s is , which is exactly the same of the value of the original sample; that of the starburst galaxies is , compared to the value of of the original sample. The completeness test was applied only to the Seyfert galaxies, because the starburt nuclei of the 12m sample are not supposed to be a complete sample (see RMS): the present sub-sample contains 63% of the Seyfert 1’s and 57% of the Seyfert 2’s of the original sample down to a flux limit of 0.30 Jy at 12m and 61% of the Seyfert 1’s and 64% of the Seyfert 2’s of the original sample down to 0.40 Jy. We conclude from this analysis that the present sub-sample represents fairly well the 12m active galaxy sample, and there is no apparent bias.
3 SPECTRAL ENERGY DISTRIBUTIONS
3.1 Average energy distributions
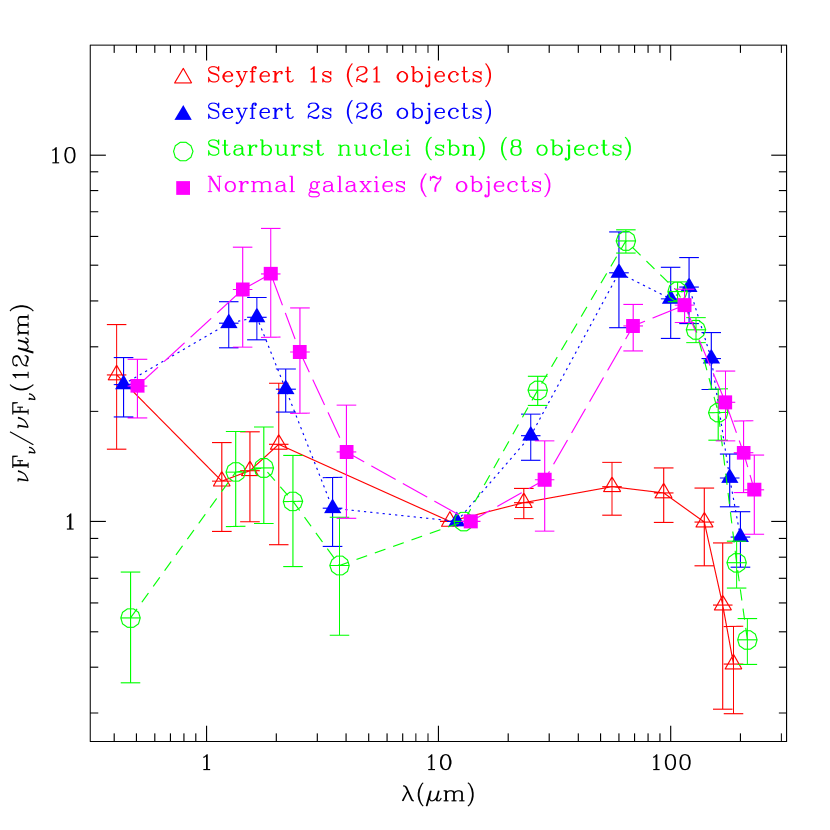
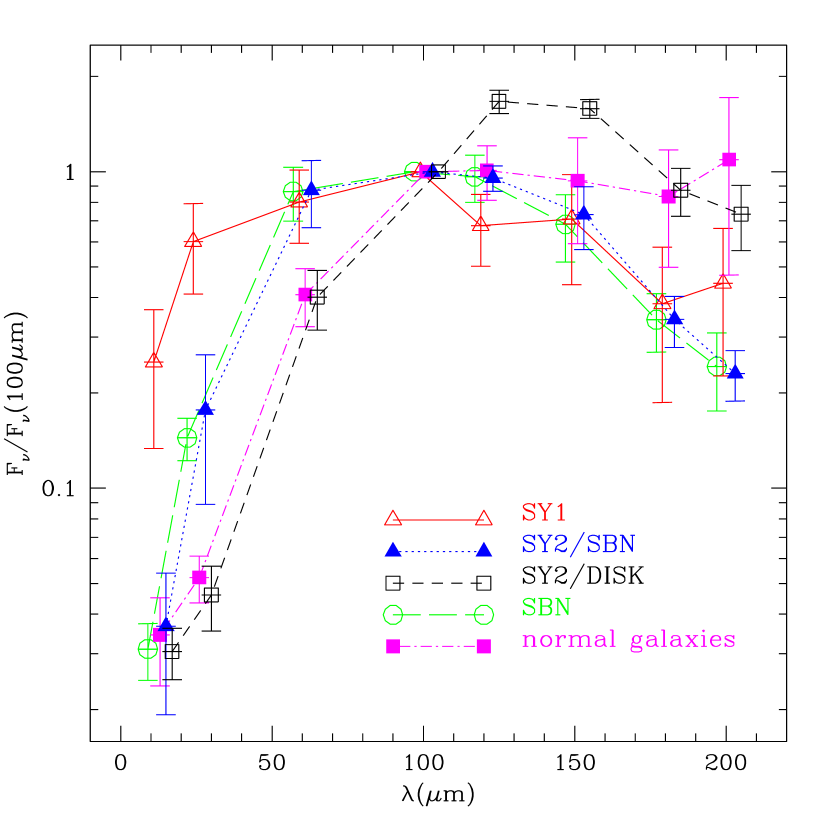
Fig. 2 shows the average observed power from 4400 Å to 200 of each class of galaxies (except for the very few nearby spiral galaxies, for which the statistics is poor) normalized to the 12 power observed by IRAS. The optical and near-infrared data have been corrected for aperture sizes to represent the total fluxes (S95). The shape of the optical-to-far-infrared spectral energy distribution (hereinafter SED) changes from one class to another: Seyfert 1’s show a general decrease from the optical to the far-infrared with only a small bump around the L (3.6) band; Seyfert 2’s show two pronounced peaks with about the same power around the J-H bands (1.2-1.6) and at 60; starburst galaxies have again the same two peaks in their SEDs, but the far-infrared peak is much brighter than the near-infrared peak; finally normal galaxies show two peaks with about the same power.
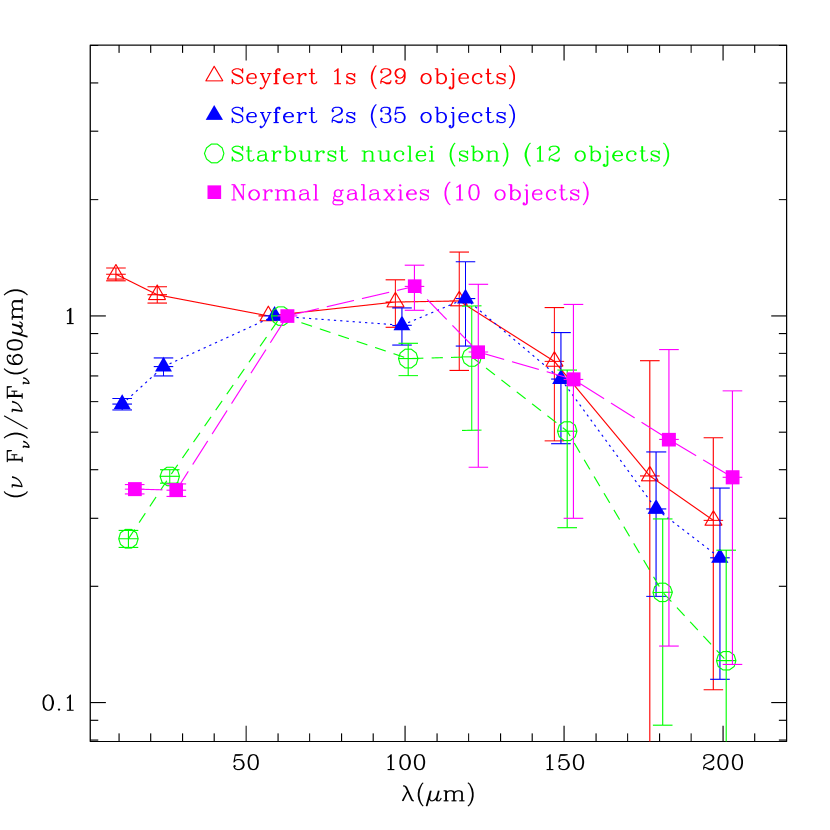
To better show the far-infrared turnover, we show in Fig. 3 the mean far-infrared SED for each class of galaxies, except nearby spirals, normalized to the observed power at 60.
The main results here are: i) Seyfert 1’s have a flatter SED shortward of 60, compared to all other classes of galaxies; ii) the two Seyfert types have virtually identical spectra from 60 to 200, while they appear different only shortward of 60 ; iii) the SED of starburst galaxies show the steepest drop off beyond 60; iv) the normal galaxies in the sample observed show stronger emission at wavelengths longer than 150 than the other types of galaxies.
The various types of galaxies show a sequence in the slope of the short wavelength part of the SED (from 12 to 60) from the very flat Seyfert 1’s, through the intermediate Seyfert 2’s, to the steep starburst and normal galaxies. The flatter SED of Seyfert 1’s in the range 12-120 probably arises from the warmer dust heated by the active nucleus.
3.2 Testing unified models of Seyfert 1’s and 2’s
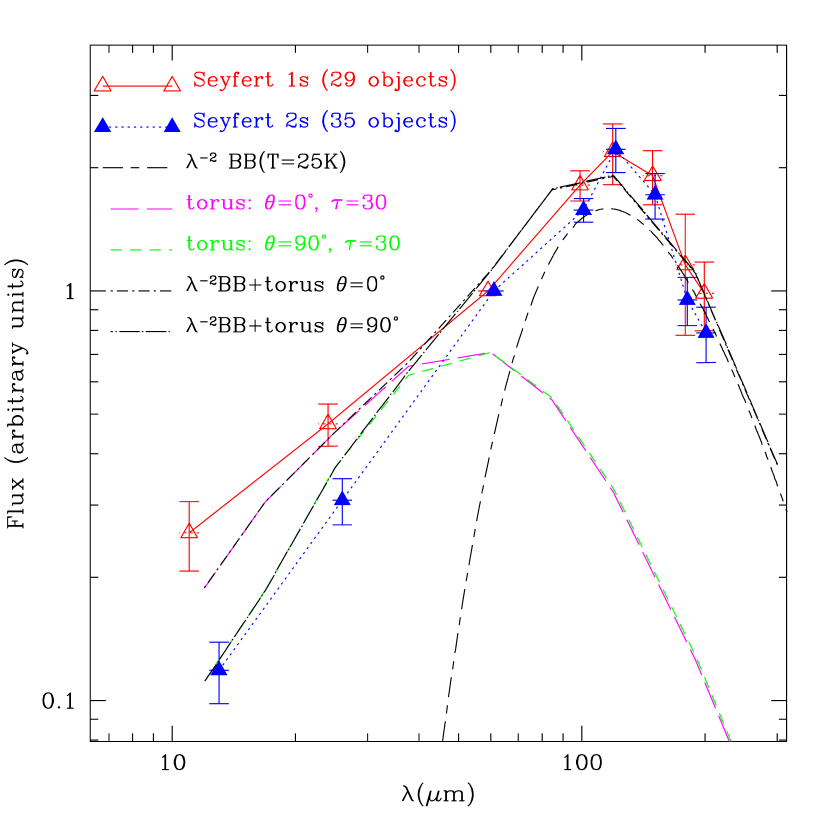
Unified models claim that the observational differences between Seyfert 1’s and 2’s can be attributed to the different orientation of a hypothetical dusty torus (e.g. Antonucci, 1993). To test this hypothesis, we have fitted in Figure 4 the average slope of the 12-200m far-infrared SEDs of Seyfert 1’s and Seyfert 2’s with the sum of an optically thick dusty torus seen face and edge on respectively, from the models by Granato & Danese (1994) and grey-body thermal emission at 25K with inverse square wavelength dependence of the dust emissivity (meant to represent the extended dust emission from the galactic disk). As shown in Figure 4, the cool component produces about 40% of the observed fluxes at 60m. Although any detailed model fitting is beyond the scope of the present paper, there is a rough qualitative consistency between the data and this simple model. However, in detail the model fails because it does not predict strong enough flux differences at 12 and 25m as the torus orientation shifts from face-on to edge-on. With a more realistic range of torus orientations in Seyfert 1’s and 2’s, the disagreement with observations would be even more significant.
3.3 Spectral Decomposition of Active and Quiescent Components
In this section we investigate if the decomposition of the observed SEDs in physically distinct spectral components that was proposed by Rowan-Robinson and Crawford (1989) (RRC) for the IRAS data can be extended to the longer wavelength ISO results.
First, we discuss the SED as defined by the IRAS data only: if we simply take the average flux ratios among the four IRAS wavelengths (: : : ) of the different types of galaxies, from our sample we obtain for Seyfert 1’s: , for Seyfert 2’s: , for starburst galaxies: and for normal spiral galaxies: . Subtracting the normal galaxies ratios from those of starburst galaxies, we are able to identify a “warm” starburst component with ratios: , peaking at 60m. As an exercise, if we add together the ratios of Seyfert 1’s with those of this warm starburst component, we can roughly reproduce the ratios of Seyfert 2’s. This suggests that there might be a difference between the two types of Seyfert nuclei in the star forming activity of their host galaxies, confirming the finding that Seyfert 2 nuclei lie preferentially in galaxies experiencing more enhanced star forming activity compared to Seyfert 1’s (Maiolino et al., 1995). It is possible that this results from a selection effect: since Seyfert 2 nuclei are relatively weaker at 12 than Seyfert 1’s, they are more likely to fall into our flux-limited sample if their brightness at this wavelength is enhanced by strong star formation.
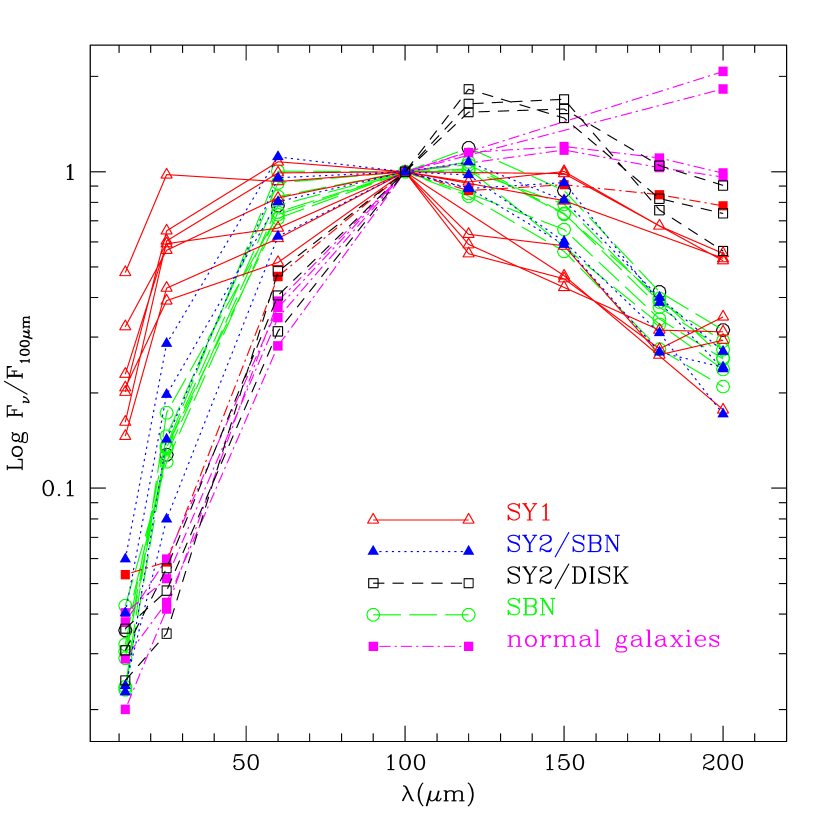
We want now to extend the analysis including the longer wavelength ISOPHOT data. Our broad-band SEDs are probably too crude a description of the complexities of galaxies to allow a full principal component decomposition into physically distinct emission components. Nonetheless, we have followed RRC in using the 12-25-60-100m colors to identify those galaxies in our sample which closely resemble the SEDs of the “quiescent cirrus” disk, the “starburst” component, and the “pure Seyfert” nucleus. For each of the three types of galaxies, the normal spirals, the starburst galaxies and the Seyfert 1’s, we have selected those objects lying in the two IRAS color-color diagrams close (i.e., within 0.2 magnitudes) to the colors of “pure disc”, “starburst” and “Seyfert” components of RRC (labeled D, B and S, respectively in Fig.1 of RRC). We have then plotted in Fig.5 the complete 12-200m SEDs of the selected galaxies individually and their average value for each class in Fig.6.
As shown in Fig.5, five normal spiral galaxies have nearly the RRC colors of the “pure cirrus disk” component: : : : = 1:1:12.7:40. These are the only normal galaxies in our sample that have the color [60 - 25]0.8 and the color [100 - 60]0.3. Similarly seven starburst galaxies have IRAS colors close to the “pure starburst” spectrum with the four IRAS fluxes scaling as 1:5:24.5:24.5. These galaxies have been selected because they are the only starburst galaxies in our sample with 0.6[60 - 25]0.9 and -0.05[100 - 60]0.25. Seven Seyfert 1’s galaxies have IRAS colors near the “pure Seyfert nucleus” and are the only Seyfert 1’s in our sample with [60 - 25]0.25 and [25 - 12]0. As also confirmed from our discussion of the two colors diagrams (see subsection 4.1), the strong distinction between quiescent disks and starbursts remains clear out to 200m. The cirrus and starburst spectra probably represent extremes of minimal and maximal recent star formation, that tend to be found in the least and most luminous galaxies, respectively. The pure Seyfert spectrum is rather similar to the pure starburst spectrum between 100 and 200m. Both show a relative lack of cold dust, and the Seyfert’s tend to be weaker at 120m.
The Seyfert 2’s are spread all around the IRAS color-color diagrams. As can be seen in Fig.5, some of them have IRAS spectra close to the pure starburst template (we have selected four in Fig.5). And indeed their ISOPHOT far-infrared spectra also match the pure starburst spectrum well, since their infrared continuum appears to be dominated from dust around star forming regions. Those Seyfert 2’s with IRAS colors like quiescent cirrus disks also resemble pure disks in the 100–200m region. Again it appears that the Seyfert 2’s nucleus contributes a minor fraction of the observed far-infrared luminosity in those objects.
4 COLOR-COLOR ANALYSIS
4.1 Far-infrared color-color diagrams
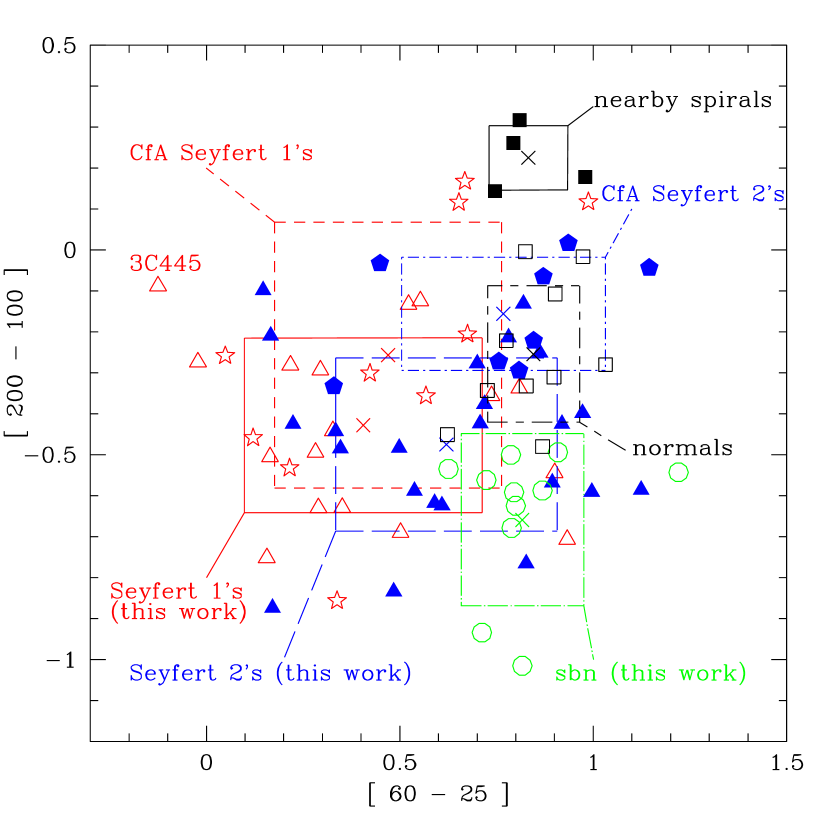
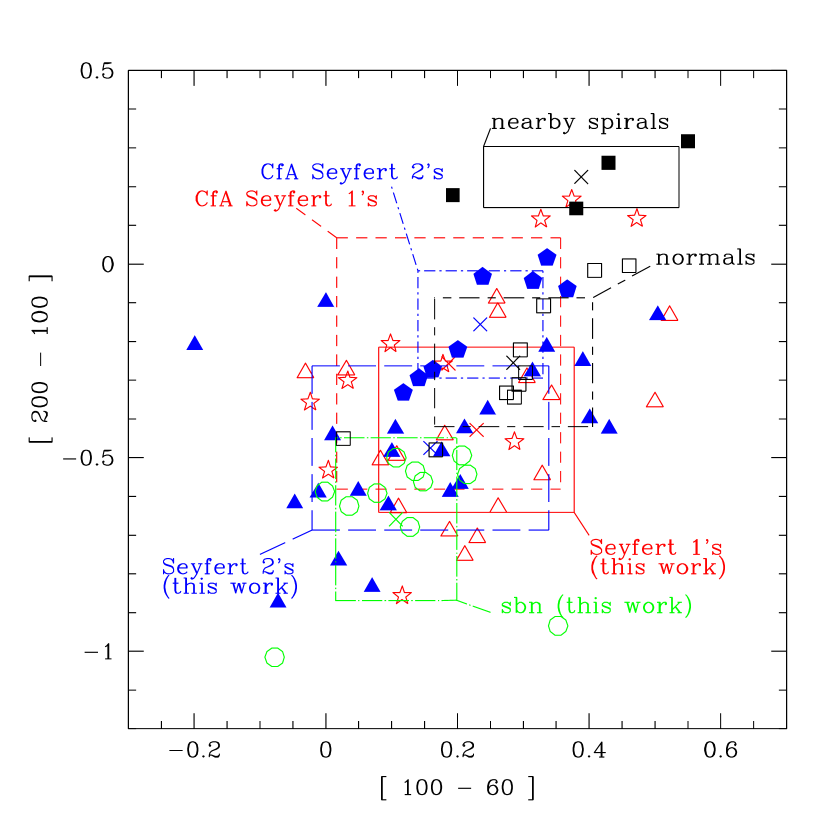
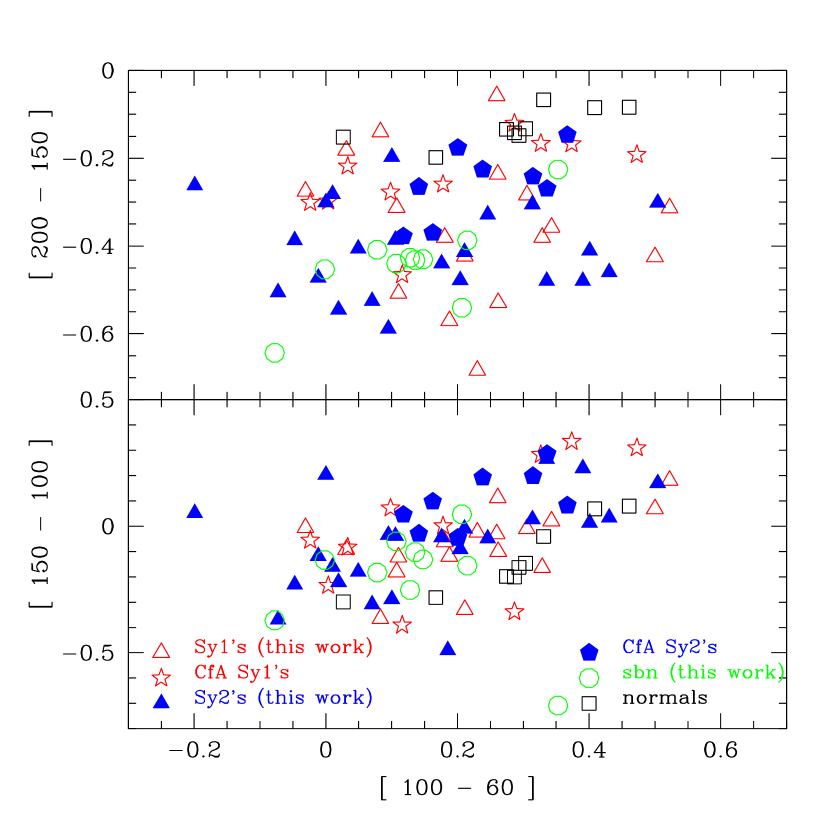
We have constructed color-color diagrams with the ISO and IRAS photometry to see how the SEDs of the different classes of galaxies differ, and if these can be used to segregate them. Fig.7 and 8 show, respectively, the [200 - 100] versus [60 - 25] and the [200 - 100] versus [100 - 60] color-color diagrams555We define color where is the flux density in Jy at . . The averaged colors for each type of galaxies are reported in Table 4.
From the two diagrams we conclude:
-
1.
For non-Seyfert galaxies, our interpretation of the different positions of the different types of galaxies in Fig.8 is that the [100 - 60] and especially the [200 - 100] colors define a correlated sequence running from galaxies with the weakest star formation up to the starbursts, in agreement with the SED behaviour as shown in Fig.3; Table 4 can be used to quantify this result: the [100 - 60] colors of starburst and nearby spiral galaxies do not overlap each other at the 1 level; even better, the [200 - 100] color is able to separate starburst from normal and normal from nearby spiral galaxies, while the colors of Seyfert’s are intermediate between starburst and normal galaxies.
-
2.
The star formation rate does not, however, influence the [60 - 25] colors; from Table 4 we note that the [60 - 25] color is virtually the same among starburst, normal and nearby spiral galaxies. The [60 - 25] color only shows a small displacement between Seyfert 1’s and 2’s, and Seyfert galaxies in general from normal and starburst galaxies; its average value decreases moving to Seyfert galaxies and becomes the lowest for Seyfert 1’s (Table 4). However, as can be seen from the Table 4, the scatter in individual galaxies is comparable to the amount of this weak shift, making it marginally significant.
-
3.
Seyfert 1’s and 2’s are not distinguishable from normal galaxies, or from each other in either [100 - 60] or [200 - 100] colors; as Table 4 shows, for both colors Seyfert and normal galaxies overlap at the 1 level.
-
4.
As can be seen from both Fig. 7 and 8 and from Table 4, all the infrared colors of the CfA Seyfert’s are more similar to those of normal inactive galaxies than are those of our 12m Seyfert’s.
The first result indicates that both [200 - 100] and [100 - 60] colors decrease when star formation activity increases. We will confirm (see subsection 4.4) that the former color also correlates with the 60m excess, that we consider a measure of the star formation activity in a galaxy. The second result was already known (e.g. S95). It comes about because recent star formation boosts both the 25 and 60m luminosities of galaxies in the same proportions found in quiescent spiral galaxies. The ratio of these two luminosities remains constant. The best explanation for the third result is that none of the Seyfert nuclei in these galaxies make a substantial contribution to the total fluxes observed at wavelengths of 60m and longward. The emission from Seyfert nuclei is relatively stronger at 25m, compared with that of normal galactic disks. This indicates that the thermally emitting dust in Seyfert nuclei has a substantially hotter temperature distribution than in normal galaxies, even those with strong starbursts. Furthermore, the dust temperatures in Seyfert 1’s tend to be even higher than those in Seyfert 2’s, as was already appreciated by Edelson & Malkan (1986) and Edelson, Malkan & Rieke (1987). The fourth empirical result illustrates a general difference between the CfA and our 12m Seyfert samples: in the former the active nuclei tend to be relatively less luminous than their host galaxies. This results in far-infrared colors in the CfA Seyfert’s which are more “normal”, i.e. similar to those of non-active spiral galaxies. One prediction is that the mid-infrared (10–25m) “compactness” [defined in Edelson & Malkan (1986) as the ratio between the flux in a small beam and the total integrated flux] of the CfA Seyfert’s is less than that of the 12m Seyfert’s, even at a given redshift.
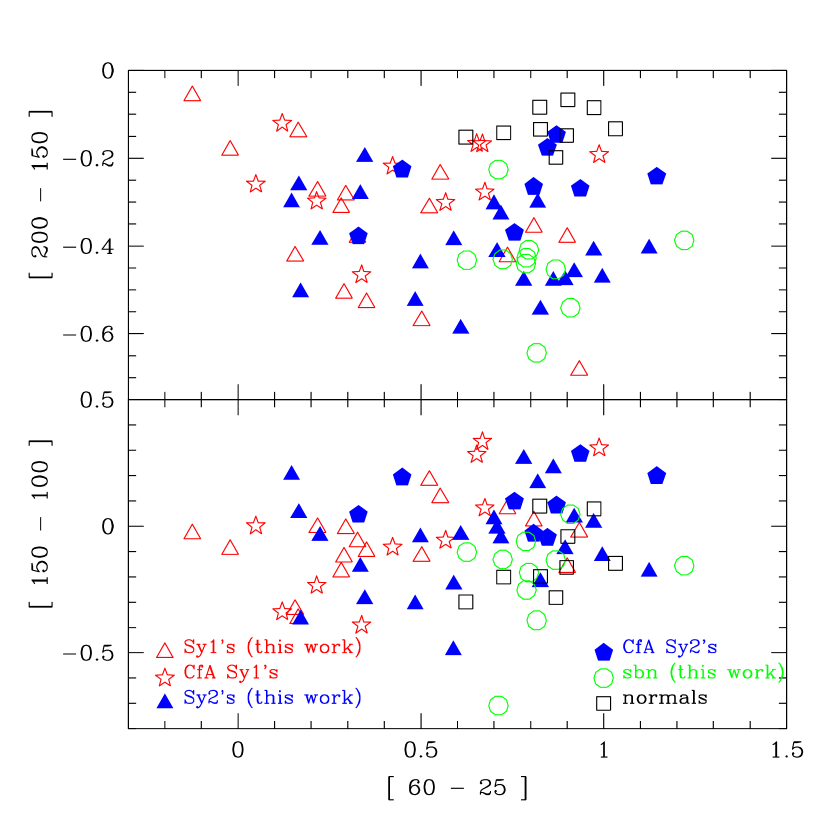
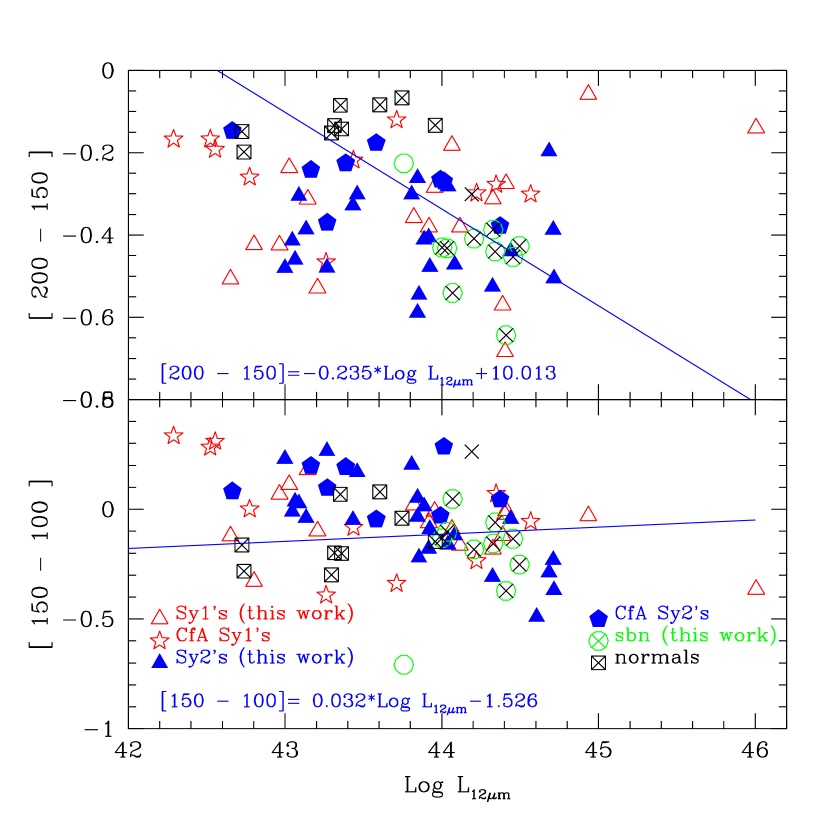
Figures 9 and 10 show the far-infrared colors [150 - 100] and [200 - 150] versus the IRAS colors [60 - 25] and [100 - 60], respectively. The [200 - 150] color is able to separate starburst from normal galaxies, as is the [200 - 100] color, while the [150 - 100] color is not. This means that the separation in mainly due
to the longer wavelength slope. Finally the separation between CfA and non-CfA Seyfert galaxies is even more apparent in the [200 - 150] color than in the [200 - 100] color. The CfA Seyfert’s lie in the upper part of the diagrams at [200 - 150] -0.4, towards the position of normal galaxies, while most of the non-CfA Seyfert’s are located at [200 - 150] -0.4.
4.2 Spectral Curvature
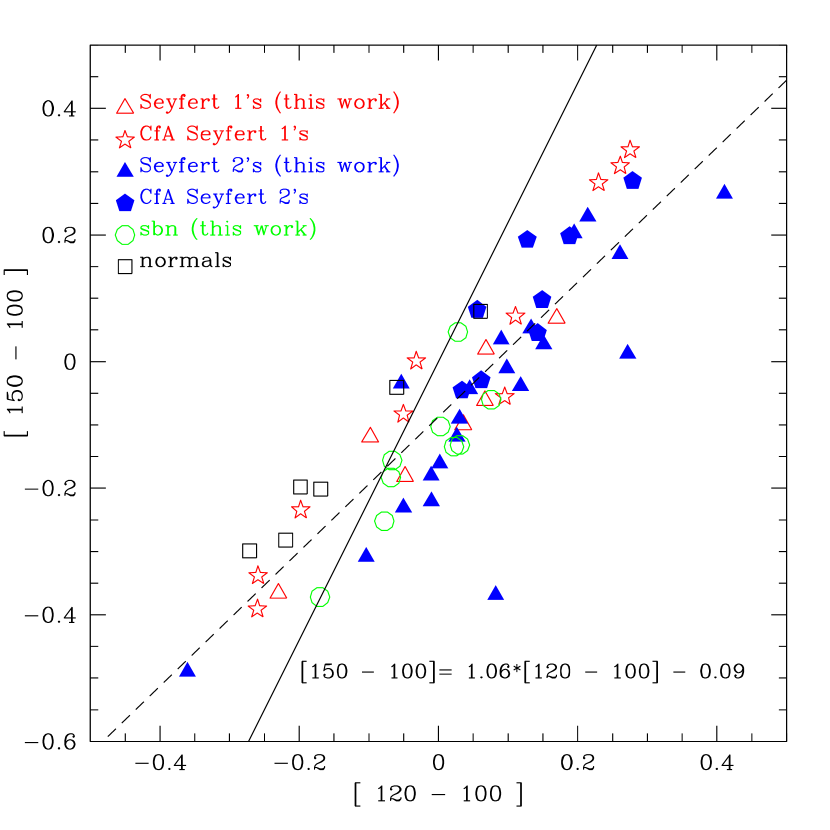
Color-color diagrams can also be used to understand if the spectra between 100–150 and 150–200 m can or cannot be described by simple power laws. In Fig. 11 we compare the 120 to 100m flux ratio with the broader wavelength baseline of 100 to 150m. The solid line shows the values that would be observed for pure power laws with:
| (2) |
where , and are three generic frequencies and the correspondent flux densities.
However, most galaxy flux ratios are better fitted with curved 100–120–150m spectra. Points lying to the right of this line show downward spectral curvature. Most of the sample — except for 4 normal galaxies and a few low-luminosity Seyfert’s — do in fact have stronger 120m emission than would be predicted by a power-law interpolation between 100 and 150m. Relative to their 100 and 150m fluxes, only a few galaxies show deficits of 120m emission. The dashed regression line (Fig.11),
| (3) |
shows relatively little scatter about it. The dispersion of 0.09 dex corresponds to random errors in each flux of 16%, not much larger than our typical uncertainties. The line correspondent to pure power law behaviour for these colors has a slope of 2.22 compared to the flatter slope of 1.06 fitting the data.
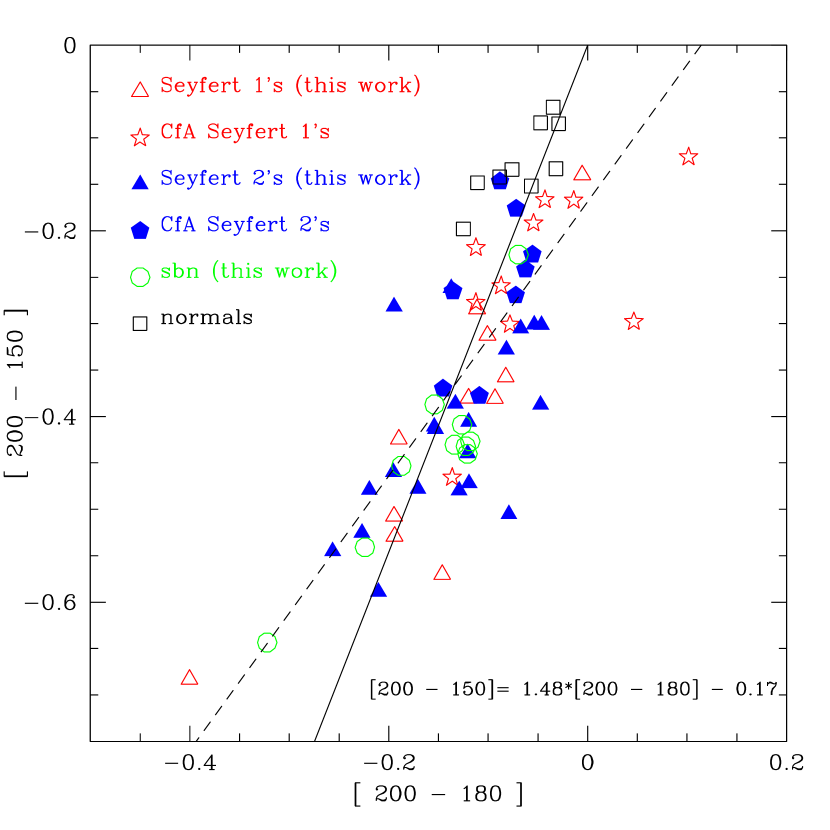
Similarly, the regression line fitting the [170 - 150] color versus the [200 - 150] color is given by:
| (4) |
The line correspondent to a pure power law for these two latter colors has a slope of 0.43 compared to the flatter slope of 0.09 fitting the data.
The situation appears even simpler for the 180m flux, which generally does fall near a power law interpolation between 150 and 200m (as shown by the solid line in Fig. 12). Thus we find that for most galaxies, measurements of 100, 150 and 200m would be sufficient to predict the 120, 170 and 180m fluxes accurately, but not with a simple power law interpolation.
4.3 Dust Color Temperatures
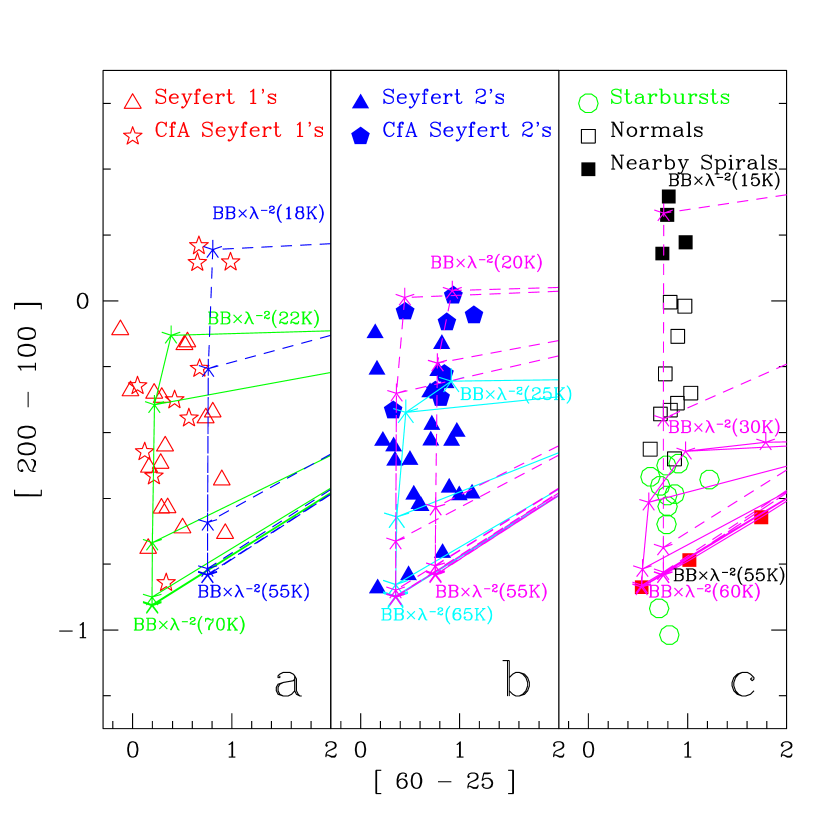
Another important outcome that can be derived from the color-color diagrams is the estimate of the temperature(s) that is (are) dominating the emission in the far-infrared. To perform this analysis we have chosen the [200 - 100] versus [60 - 25] color-color diagram and we adopted for fitting the combination of two grey-bodies, leaving to vary the dust emissivity law. We show this color-color diagram separately for the different types of galaxies in Fig. 13. The emission is broad-band: fitting it from 25 to 200m requires a range of dust temperatures. To compare the model with the observed colors, we have overplotted the combination of the two grey-bodies in Fig. 13. This introduces the minimum necessary number of fitting parameters. To fit the long-wavelength color a steep dependence of the dust emissivity law is needed,
| (5) |
A much flatter wavelength dependence would not fit most of the 200 data for any type of galaxies.
The non-Seyfert galaxies show a clear sequence of increasing average dust temperature going from the nearest spirals up to the most luminous starbursts. The correlation of the two colors is:
| (6) |
(the linear regression coefficient is 0.33 for 25 data points) or alternately, for the [100 - 60] color:
| (7) |
(the linear regression coefficient is 0.73 for 26 data points)
These correlations are essentially re-statements of the correlation first presented by S95, in their Appendix B (see their Figure 13). The corresponding shift in grey-body temperature that we find is the same as what they found, after correction for the fact that their shallower wavelength dependence of dust emissivity made their fitted temperatures systematically higher than ours for a given observed spectrum. Our interpretation is that higher rates of star formation raise the average dust temperature, shifting the peak of the thermal dust emission to higher frequencies, and tilting the entire far-infrared spectrum toward the blue. Splitting the 100–200m spectrum into two pieces, we find that most of this curvature occurs between 150 and 200m.
In the normal spirals belonging to the 12 galaxy sample and observed by Siebenmorgen, Krugel & Chini (1999) and by Alton et al. (1998), dust at even lower temperature (15 K) is detected, confirming the previous finding of these latter authors.
Most of the Seyfert 1’s far-infrared data occupy a region that can be fitted by the mixture of two grey-bodies with and . The three nearby CfA Seyfert 1’s galaxies (NGC 3227, NGC 5033, NGC 4051, with data taken from PGRE) with an average redshift of z=0.0031, show the highest value of the [200 - 100] color, requiring a lower minimum dust temperature (the fit in Fig. 13a gives ).
Almost all Seyfert 2’s far-infrared data (Fig. 13b) can be fitted by the mixture of two grey-bodies with and . They show a somewhat narrower temperature distribution compared to Seyfert 1’s, and do not extend to the higher values. Again the four reddest CfA Seyfert 2’s — NGC 4388, NGC 3982, NGC 1143/44 and NGC 3079 — (PGRE) with the coolest dust (), have an average redshift of 0.011, as opposed to 0.019 for all the other Seyfert 2’s plotted.
Comparing the three classes of galaxies, there is a trend with the most active objects (Seyfert 1’s) have the widest temperature range (22–70K); Seyfert 2’s are intermediate, while starbursts have the warmest low temperature component (30K), together with the coldest high temperature one (60K).
A similar result has been found by Klaas et al. (1997) analyzing the ISOPHOT data of the three interacting galaxies Arp 244, NGC 6240 and Arp 220: the increase of the highest dust temperature component is accompanied by the decrease of the lowest dust temperature component they detect. In four narrow-line Seyfert 1’s Polletta & Courvoisier (1999) found that the lowest dust temperature is in the range 20-40K.
We are aware that there could be an additional selection effect in nearby galaxies if there is very extended emission from the galaxy discs. Measurements not performed in mapping mode could have lost some of the long wavelength emission. The detection of very cold dust only in nearby objects could thus be explained with the very low surface brightness of its thermal emission. This dust component has been found by Alton et al. (1998) to be surprisingly extended. We cannot exclude therefore that also for our objects there might be emission from cold dust (T 15K) that escaped detection with our observations.
4.4 The far-infrared turnover versus the 60m excess
In this subsection we want to relate the strength of the star formation activity in a galaxy with the steepness of the far-infrared turnover, measured by the [200 - 100] color, with the aim to see how the different classes of galaxies behave and if there is a separation between galaxies with and without active nuclei.
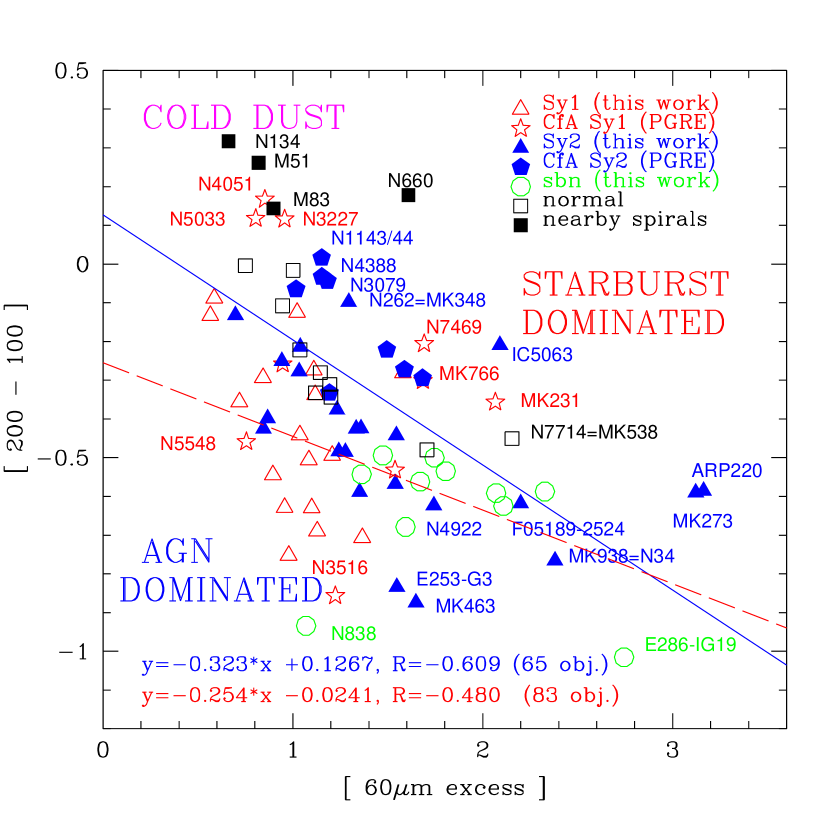
We have chosen as the indicator of enhanced recent star formation, which warms dust around HII regions, the 60m “excess” as the ratio of the observed 60m flux to the flux that a source would have at 60m from power-law interpolation of the flux between 12 and 100m. We have already seen (see subsection 4.1) that the starburst galaxies of our sample are characterized by a low value of their [200 - 100] color. In Fig.14 we plot the [200 - 100] color index as a function of the 60m excess. We find a correlation between the steepness of the far-infrared (100–200m) turnover and the strength of the 60m “excess”. While this diagram does not perfectly separate the galaxies of different classes, it nevertheless shows that they cluster preferentially in different regions of the diagram. Seyfert 1’s (excluding six objects of the CfA sample) cluster in a no-60m excess region with a color [200 - 100] 0. The starburst galaxies cluster in the central area of the diagram and have all 60m excess. Normal galaxies and nearby spirals have no 60m excess (except 2 objects) and a color . Seyfert 2’s are widely spread all over the diagram, but with a 60m excess generally higher than Seyfert 1’s. Four especially infrared-luminous galaxies — MK 273, Arp 220, MK 938 and FSC05189-2524 lie in the “starburst” zone. In fact detailed mid-infrared spectroscopy (in the range 3-30m) suggests that much of the total infrared luminosity in these extreme objects is indeed powered by star formation (Genzel et al., 1998). As we already noted, many of the CfA Seyfert galaxies have higher excess and/or higher [200 - 100] color, with respect to the other Seyfert galaxies. This is presumably because their faint Seyfert nuclei are too feeble to influence the overall far-infrared continuum emitted by their bright host galactic disks.
As stated above, the 60m excess is measured with respect to the underlying 12 and 100m fluxes, which are dominated by the “cirrus” component powered by the integrated stellar luminosity in the galaxy. When the 60m bump is especially strong, the warm dust associated with recent star formation even contributes to the observed 100m flux, making a relative excess at that wavelength compared with the emission from cold dust at longer wavelengths. The result is that the more actively star-forming galaxies, such as infrared-luminous starbursts, have the sharpest far-infrared turnover. They show the steepest drop off from 100 to 200m, with an average slope over that wavelength range of = + 2.2, compared to = + 1.4, = + 1.6 and = + 0.8 for Seyfert 1’s, 2’s and normal galaxies, respectively (see Table 4).
A simple least squares fit to the data show a correlation of the color [200 - 100] with the 60m excess with a linear regression coefficient of R=-0.48 (for 83 objects), corresponding to a probability of 99.9996%. This correlation improves by excluding the Seyfert 1’s (R=-0.61 for 65 objects).
We suggest that that the diagram shown in Fig.14 can be used to separate the starburst dominated objects from the AGN dominated ones. Objects located in the upper right part of the diagram are “more” starburst dominated, while those at the left, having a fainter excess, are the AGN dominated objects. We suggest that starburst activity in galaxies, i.e. with high rates of current star formation, results in excess emission in the 60m band accompanied by a general heating of the galactic ISM and thus a decrease of the [200 - 100] color.
We note that many of the Seyfert galaxies of the CfA sample are shifted upwards in Figure 14 with respect to the bulk of the 12m Seyfert’s. Again we interpret this as an indication that their stronger long-wavelength emission arises from the dominance of quiescent disk dust.
5 LUMINOSITY ANALYSIS
5.1 Luminosity Correlations
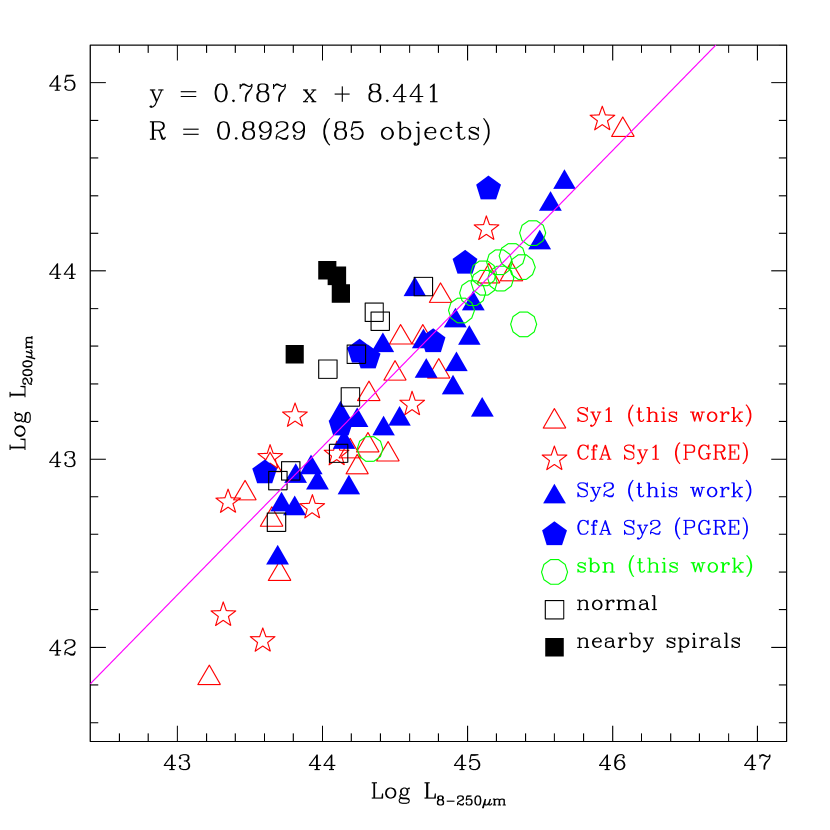
In this subsection we analyze the correlations of the 200m luminosity with the luminosity in each of the IRAS bands and the total mid- to far-infrared luminosity. Although diagrams which correlate one luminosity with another in the same object should be used with caution, we have a large sample with good selection criteria in which the luminosities span over 4 orders of magnitude. In Figures 15 and 16 we show such correlations and give the formulae for the best-fitting regression lines. As expected, the slopes in the correlations of the 200m luminosity against the 25 and 60m luminosities are flatter than those against the 12 and 100m luminosities (see also S95). This is because the 25 and 60m luminosities are preferentially elevated in those galaxies with more active recent star formation. The 100m and 200m emission, in contrast, are relatively stronger in the quiescent disk emission (see below), and correlate almost linearly with each other.
These figures are a logical extension of the findings of S95. They showed that galaxies with higher bolometric luminosity are relatively brighter in the 25 and 60m bands, due to the elevated “starburst” component in them, while they appear relatively fainter at both shorter (12m) and longer (100m) wavelengths. The “pivot points” at which the relative luminosity neither increases nor decreases, occur around 12 and 100m. This is our interpretation of why the 12 and 100m luminosities have a correlation with the bolometric luminosity with a flatter slope (1.06 and 1.13, respectively) compared to the slope of the correlations of the 25 and 60m luminosities with the bolometric luminosity ( 1.2)(see Fig.7 of S95). For wavelengths much shorter than 12m or longer than 100m we therefore expect the luminosity to track less than linearly with the bolometric luminosity. That is what these figures are showing.
It is not particularly surprising that the 200m luminosity correlates most closely with the 100m luminosity, given that these are the two closest wavelengths. The fact that the Seyfert galaxies (of both types 1 and 2) lie on the same track as the non-Seyfert’s once again indicates that the Seyfert nucleus makes a negligible contribution at these wavelengths. Since the 200m luminosity is dominated by the “quiescent cirrus” component, it does not increase as fast as the 25 or 60m luminosities, which are strongly effected by starbursts. Thus the slopes of the correlation between the 200m luminosity and those at these latter wavelengths are much flatter than 1 (0.83 and 0.86 respectively).
The 200m luminosity even decreases less rapidly than the total luminosity. This is seen by the flat slope of only 0.79 in Figure 16, where the X-axis is the “total” mid- to far-infrared luminosity, defined in equation (1) and given in Table 3. We note that a similar slope (0.87) is relating the optical blue luminosity with the bolometric luminosity (see Fig.10 of SM95), confirming the above interpretation.
5.2 Color-luminosity diagrams
As discussed above, it is believed that the more luminous non-Seyfert galaxies have higher light/mass ratios. They are luminous not so much because they are bigger or more massive, but principally because they have higher proportions of recently formed stars, which are highly luminous. A higher proportion of their total luminosity emerges in the far-infrared, and in particular from the warmed dust grains which emit strongly at 25–60m– what we describe as the “starburst” component (e.g. S95). One consequence of this is that the most actively star-forming galaxies should have the sharpest far-infrared turnovers, as shown in subsection 4.4, because their dust has a warmer temperature distribution, as seen is subsection 4.3. Thus we expect a systematic trend of infrared SEDs with total luminosity. Spinoglio et al. (1995) already showed that the higher the bolometric luminosity of a galaxy, the higher its ratio of starburst/cool dust components.
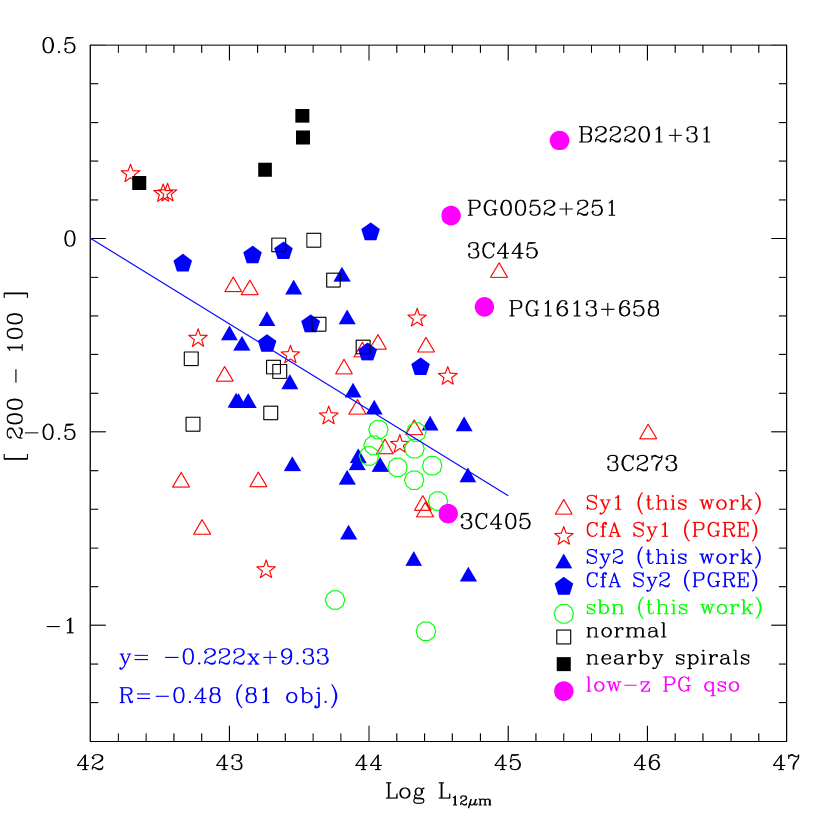
Indeed we do find that the far-infrared turnover becomes systematically sharper in the more luminous galaxies. This can be seen in the inverse correlation between the color index [200 - 100] and the 12m luminosity, shown in Fig. 17. In this figure we see that this relation holds in general, irrespective of the type of the galaxy, with a regression coefficient of R=-0.48 for 81 objects, for all the observed galaxies in the 12m sample, excluding the 3C and PG quasars. The fit to the non-Seyfert galaxies only is:
| (8) |
(the linear regression coefficient is -0.52 for 26 data points).
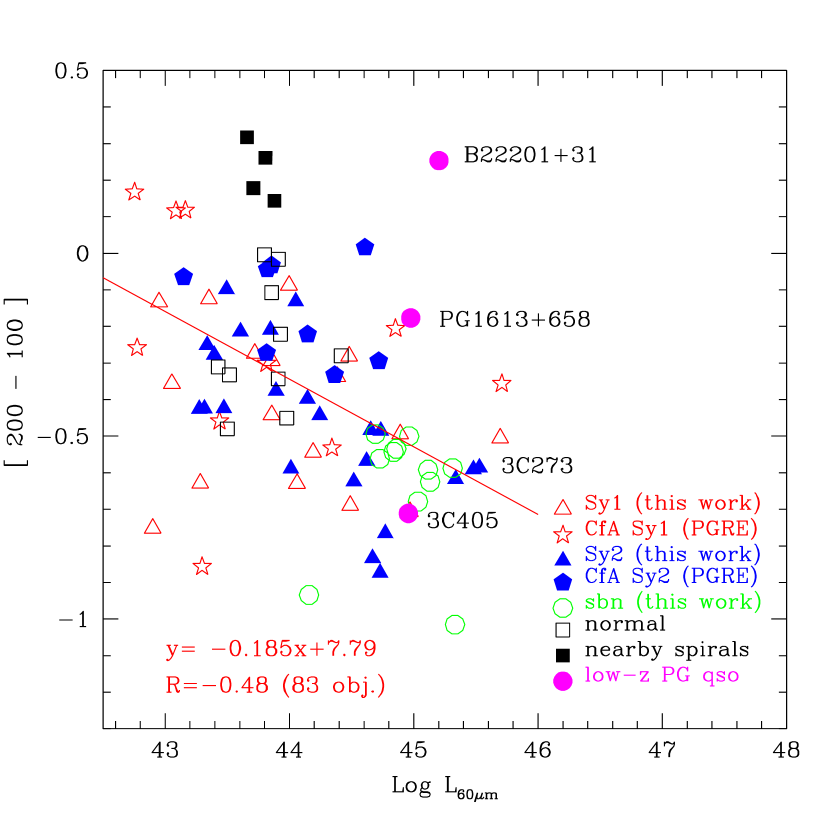
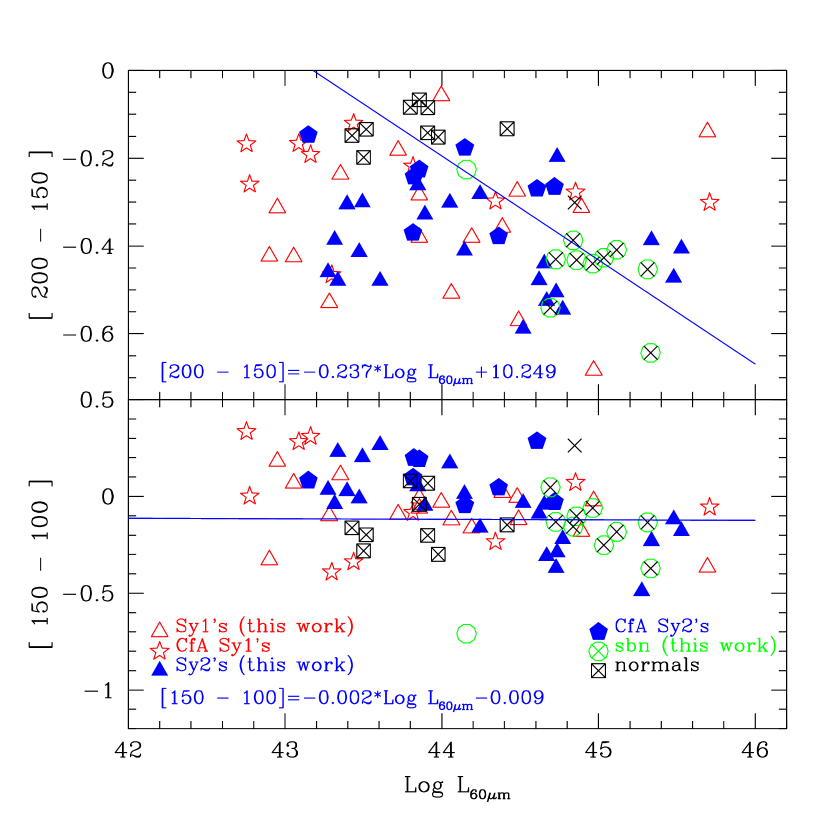
We also plot in Fig.18 the inverse correlation between the color index [200 - 100] and the 60m luminosity, which gives a regression coefficient of R=-0.48 for 83 objects, for all the galaxies in our sample, excluding the 3C and PG quasars. The fit for the non-Seyfert’s only gives:
| (9) |
(the linear regression coefficient is -0.63 for 26 data points)
The four most noticeable outliers are the two 3C objects and the two PG quasars, which have unexpectedly red [200 - 100] colors . There is therefore an indication that even at low redshift (z 0.2) quasars (either the optically selected PG and the radio selected 3C) might have an excess in cold dust emission.
In Figures 19 and 20, we separate this color-luminosity trend into the slopes between 100 and 150m and 150 to 200m. Clearly the trend is due entirely to the steepening of the 200–150m slope in the more luminous galaxies, which is the same whether the luminosity is measured at 12 or at 60m. The 100–150m slope in fact shows no significant luminosity dependence.
6 SUMMARY
New ISOPHOT photometry of a large sample of nearby active and normal galaxies shows that:
-
i)
The 60-200 SEDs of active and normal galaxies are similar. The 100 to 150 to 200m spectra have significant curvature, generally downward. The trends are sufficiently systematic that measurements at these wavelengths can give accurate predictions of the fluxes at the intermediate wavelengths of 120, 170 and 180 m.
-
ii)
In the non-Seyfert galaxies, higher luminosities (presumably generated by higher rates of recent star formation) are correlated with hotter average dust temperatures at all wavelengths from 12 to 200m. In particular, the 150 to 200m slope steepens in more luminous galaxies.
-
iii)
The decomposition of the observed SEDs into physically distinct spectral components has been extended from the IRAS data (RRC) to our ISO results: a strong distinction is apparent out to 200 between the the quiescent disk component and the starburst component. We suggest that these components represent the extremes of minimal and maximal recent star formation, found in the least and most luminous galaxies, respectively.
-
iv)
The [200 - 100] versus [100 - 60] color-color diagram is able to separate the three types of galaxies: starburst galaxies, normal galaxies and nearby spirals, while Seyfert’s are at intermediate locations. The large-aperture 60–200 m spectra of Seyfert galaxies we measured are dominated by the emission from the host galaxy. They therefore depend on the relative contributions of “starburst” and “quiescent disk” emission in the galaxy, and are independent of the presence of an active nucleus.
-
v)
The [200 - 100] vs [60 - 25] color-color diagram shows that a mixture of two black-bodies with a warm and a cold component is able to fit all the far-infrared data, only if we assume the dust emissivity law proportional to the inverse square of the wavelength. Comparing active galaxies, Seyfert 1’s show the larger range in temperature (22-70K), Seyfert 2’s are intermediate, while starburst galaxies have the narrower range in dust temperature (30-60K). Nearby normal spirals and some of the CfA Seyfert galaxies show very cold dust components (15-18K).
-
vi)
A correlation is found between the slope of the far-infrared turnover (as measured from the [200 - 100] color) and both the 60m excess and the 12 and 60m luminosities. We have confirmed and extended the finding of S95 that increasing star formation rates cause the more luminous non-Seyfert galaxies to have relatively stronger 25–60m emission, resulting in systematically bluer far-infrared colors. We suggest that the plane defined by the [200 - 100] color versus the 60m excess can be used to separate starburst dominated galaxies from AGN dominated ones.
Appendix A DATA OBTAINED WITH THE ISOPHOT C100 ARRAY CAMERA
Some C100 observations, namely for objects FSC00521-7054, NGC 7674, MCG+1-33-36, NGC 262, FSC03362-1642, ESO253-G3, NGC 1365, NGC 4501, NGC 4922A/B were performed in staring mode, however only for the latter three an adjacent empty sky position was observed to measure the sky background. In the former cases sky background was estimated as follows: we assume that the sources are point-like and therefore only the central pixel (# 5) contains the source flux. The adjacent pixels were averaged to get a background value, which was then subtracted from the signal of the central pixel. This procedure is, however, affected by large uncertainties since it requires a good flat-fielding of the array because of its unstable behavior and in two cases, for NGC 7674 and NGC 262, the values inferred are much lower than the corresponding IRAS photometry. Note that the uncertainties quoted here are only the statistical ones. The results of the C100 observations are reported in Table 5.
References
- Alexander & Aussel (1999) Alexander D.M. and Aussel, H., 1999, in ISO Surveys of a Dusty Universe, Eds. D. Lemke, M. Stickel & K. Wilke , Springer Lecture Notes of Physics Series, 548, 117.
- Alton et al. (1998) Alton, P.B., et al.1998, A&A, 335, 807
- Antonucci (1993) Antonucci, R. 1993, ARA&A, 31, 473
- Calzetti et al. (2000) Calzetti, D., Armus, L., Bohlin, R.C.,Kinney, A.L., Koornneef, J. Storchi-Bergmann, T. 2000, ApJ, 533, 682
- Edelson & Malkan (1986) Edelson, R.A. & Malkan, M.A. 1986, ApJ, 308, 59.
- Edelson, Malkan & Rieke (1987) Edelson, R.A., Malkan, M.A. & Rieke, G.H. 1987, ApJ, 321, 233
- Fang et al. (1998) Fang, F., Shupe, D.L., Xu, C., Hacking, P.B. 1998, ApJ, 500, 693
- Franceschini et al. (2001) Franceschini A., Aussel H., Cesarsky C.J., Elbaz, D., Fadda, D. 2001, A&A, 378, 1
- Gabriel et al. (1997) Gabriel, C., Acosta-Pulido, J., Heinrichsen, I., Morris, H., Tai, W.-M. 1997, in ASP Conf. Ser. 125, Astronomical Data Analysis Software and Systems VI, ed. Gareth Hunt and H. E. Payne, eds., 108
- Genzel et al. (1998) Genzel, R. et al. 1998, ApJ, 498, 579
- Genzel & Cesarsky (2000) Genzel, R. & Cesarsky, C.J. 2000, ARA&A, 38, 761
- Granato & Danese (1994) Granato, G.L., & Danese, L., 1994, MNRAS, 268, 235
- Haas et al. (2000) Haas, M., Muller, S.A.H., Chini, R., Meisenheimer, K., Klaas, U., Lemke, D., Kreysa, E., Camenzind, M. 2000, A&A, 354, 453
- Huchra & Burg (1992) Huchra, J. & Burg, R. 1992, ApJ, 393, 90
- Kessler et al. (1996) Kessler M.F., et al. 1996, A&A, 315, L27
- Klaas et al. (1997) Klaas, U., Haas, M., Heinrichsen, I., Schulz, B. 1997, A&A325, L21
- IRAS PSC (1988) IRAS Point Source Catalog, Version 2, 1988, Joint IRAS Science Working Group (Washington, DC: GPO).
- Lemke et al. (1996) Lemke D. et al. 1996, A&A315, L64
- Laureijs et al. (2001) Laureijs R.J. et al. 2001, The ISO Handbook, Vol.V, The Imaging Photo-polarimeter, SAI/99-069/Dc, Version 1.2, July 1, 2001, T. Muller & J. Blommaert Eds.(available also at http://www.iso.vilspa.esa.es/manuals/HANDBOOK/V/pht_hb/)
- Maiolino et al. (1995) Maiolino, R., Ruitz, M., Rieke, G.H., Keller, L.D. 1995, ApJ, 446, 561
- Malkan (2001) Malkan, M. 2001, preprint astro-ph/0110357, from Kyoto Cosmology Conference in honor of Prof. Tomita.
- Malkan (2000) Malkan, M. 2000, in “Birth and Evolution of the Universe”, Proceedings of Fourth RESCEU International Symposium, eds. K. Sato and M. Kawasaki (Universal Academy Press; Tokyo), p. 119 (also available as astro-ph/0005251).
- Meisenheimer et al. (2001) Meisenheimer, K., Haas, M., Müller, S.A.H., Chini, R., Klaas, U., Lemke, D. 2001, A&A, 372, 719
- Moshir et al. (1992) Moshir, M. et al. 1992, Explanatory Supplement to the IRAS Faint Source Survey, version 2, JPL D-10015 8/92 (Pasadena: JPL).
- Pérez García & Rodríguez Espinosa (2000) Pérez García, A.M. & Rodríguez Espinosa, J.M. 2000, ApJ, 557, 39 (PGRE)
- Polletta & Courvoisier (1999) Polletta, M. & Courvoisier, T.J.-L., 1999, A&A, 350, 765
- Polletta et al. (2000) Polletta, M., Courvoisier, T.J.-L.,Hooper, E.J., Wilkes, B.J. 2000, A&A, 362, 75
- Radovich et al. (1999) Radovich, M., Klaas, U., Acosta-Pulido, J., Lemke, D. 1999, A&A, 348, 705
- Rowan-Robinson and Crawford (1989) Rowan-Robinson, M., and Crawford, J. 1989, MNRAS, 238, 523 (RRC)
- Rush, Malkan & Spinoglio (1993) Rush, B., Malkan, M.A. & Spinoglio, L. 1993, ApJS, 89,1 (RMS)
- Siebenmorgen, Krugel & Chini (1999) Siebenmorgen, R., Krugel, E., Chini, R. 1999, A&A, 351, 495
- Schmidt & Green (1983) Schmidt, M. & Green, R.F. 1983, ApJ, 269, 352
- Spinoglio et al. (1995) Spinoglio, L., Malkan, M.A., Rush B., Carrasco, L., Recillas-Cruz, E. 1995, ApJ, 453, 616 (S95)
- Spinoglio & Malkan (1989) Spinoglio, L. & Malkan, M.A. 1989, ApJ, 342, 83
- Thean et al. (2000) Thean, A., Pedlar, A., Kukula, M.J., Baum, S.A., O’Dea, C.P. 2000, MNRAS, 314, 573
- Thean et al. (2001) Thean, A., Pedlar, A., Kukula, M.J., Baum, S.A., O’Dea, C.P. 2001 MNRAS, 325, 737
- Xu et al. (1998) Xu, C., et al. 1998, ApJ, 508, 576


| Name | R.A.(J2000.0) | Dec.(J2000.0) | z | typeaaThe galaxy type is coded as follows: sy1: Seyfert 1; sy2: Seyfert 2; sbn: starburst nucleus; ulirg: ultraluminous infrared galaxy. | Obs.id. | Time | ref. |
|---|---|---|---|---|---|---|---|
| h m s | deg ’ ” | (TDT No.) | (sec) | ||||
| E12-G21 | 0:40:47.3 | -79:14:20.0 | 0.0328 | sy1 | 55304297 | 1028 | (1) |
| IZW1 | 0:53:37.0 | 12:40:11.8 | 0.0604 | sy1 | 39502078 | 992 | (2) |
| MK1034 | 2:23:20.2 | 32:11:33.4 | 0.0380 | sy1 | 65600799 | 888 | (1) |
| N931=MK1040 | 2:28:14.4 | 31:18:42.1 | 0.0164 | sy1 | 65600803 | 1380 | (1) |
| NGC1365 | 3:33:36.5 | -36:08:23.1 | 0.0055 | sy1 | 80301415 | 230 | (1) |
| F03450+0055 | 3:47:40.2 | 1:05:13.8 | 0.0310 | sy1 | 79501331 | 974 | (2) |
| MK618 | 4:36:23.2 | -10:22:30.5 | 0.0347 | sy1 | 67901154 | 1302 | (1) |
| M-5-13-17 | 5:19:36.6 | -32:39:27.3 | 0.0125 | sy1 | 67802257 | 1062 | (1) |
| MK9 | 7:36:58.6 | 58:46:12.9 | 0.0399 | sy1 | 70501363 | 824 | (1) |
| MK79 | 7:42:32.0 | 49:48:35.9 | 0.0221 | sy1 | 70501666 | 818 | (1) |
| 3C273 | 12:29:04.4 | 2:01:45.1 | 0.1579 | sy1/qso | 24100607 | 928 | (2) |
| N4593 | 12:39:39.4 | -05:20:39.3 | 0.0083 | sy1 | 24600427 | 424 | (2) |
| M-6-30-15 | 13:35:50.6 | -34:19:07.8 | 0.0077 | sy1 | 25600791 | 616 | (2) |
| F13349+2438 | 13:37:15.0 | 24:21:47.9 | 0.1070 | sy1 | 58000935 | 214 | (2) |
| I4329A | 13:49:16.9 | -30:20:00.2 | 0.0161 | sy1 | 25702639 | 552 | (2) |
| F15091-2107 | 15:11:58.0 | -21:20:28.6 | 0.0446 | sy1 | 64400729 | 1082 | (2) |
| N7213 | 22:09:15.9 | -47:09:53.5 | 0.0059 | sy1 | 35401563 | 422 | (2) |
| 3C445 | 22:23:47.5 | -2:04:48.2 | 0.0562 | sy1 | 18701453 | 552 | (2) |
| N7314 | 22:35:45.8 | -26:02:59.9 | 0.0048 | sy1 | 53905190 | 448 | (1) |
| MK938 | 0:11:06.6 | -12:06:26.7 | 0.0192 | sy2 | 55903371 | 444 | (1) |
| N262=MK348 | 0:48:47.1 | 31:57:25.0 | 0.0151 | sy2 | 59900759 | 2070 | (1) |
| F00521-7054 | 0:53:56.2 | -70:38:03.4 | 0.0700 | sy2 | 54201225 | 578 | (1) |
| M-2-8-39 | 3:00:30.4 | -11:24:56.1 | 0.0301 | sy2 | 81201040 | 1784 | (1) |
| N1241 | 3:11:16.2 | -8:55:12.0 | 0.0072 | sy2 | 79601744 | 506 | (1) |
| N1320=MK607 | 3:24:48.7 | -3:02:31.7 | 0.0099 | sy2 | 79501745 | 870 | (1) |
| F03362-1642 | 3:38:33.3 | -16:32:16.9 | 0.0360 | sy2 | 79601192 | 1512 | (1) |
| N1667 | 4:48:37.6 | -6:19:11.8 | 0.0153 | sy2 | 82203176 | 464 | (1) |
| F05189-2524 | 5:21:01.4 | -25:21:45.0 | 0.0415 | sy2 | 86301930 | 196 | (2) |
| E253-G3 | 5:25:18.0 | -46:00:19.7 | 0.0407 | sy2 | 72501678 | 790 | (1) |
| N4501 | 12:31:59.5 | 14:25:16.8 | 0.0077 | sy2 | 23902627/23902607 | 474/142 | (1) |
| TOL1238-364 | 12:40:56.9 | -36:44:06.7 | 0.0109 | sy2 | 07800505 | 516 | (2) |
| N4922A/B | 13:01:25.1 | 29:18:42.2 | 0.0237 | sy2 | 24500532/24500513 | 474/392 | (1) |
| M-3-34-64 | 13:22:24.4 | -16:43:42.2 | 0.0172 | sy2 | 25701422 | 1124 | (1) |
| MK273 | 13:44:42.1 | 55:53:12.8 | 0.0373 | sy2 | 14201730 | 180 | (2) |
| MK463 | 13:56:02.7 | 18:22:19.0 | 0.0505 | sy2 | 58001035 | 196 | (2) |
| ARP220 | 15:34:57.5 | 23:30:17.5 | 0.0182 | sy2/ulirg | 47600416 | 750 | (2) |
| F19254-7245 | 19:31:21.3 | -72:39:19.9 | 0.0615 | sy2 | 10100205 | 180 | (2) |
| N6810 | 19:43:33.9 | -58:39:20.7 | 0.0066 | sy2 | 29901651/29901642 | 474/160 | (1) |
| N6890 | 20:18:18.1 | -44:48:24.5 | 0.0081 | sy2 | 33602245 | 1762 | (1) |
| I5063 | 20:52:02.8 | -57:04:13.5 | 0.0113 | sy2 | 33301248 | 1124 | (1) |
| N7130=I5135 | 21:48:19.4 | -34:57:03.2 | 0.0162 | sy2 | 53904967 | 570 | (1) |
| N7172 | 22:02:02.1 | -31:52:08.8 | 0.0086 | sy2 | 53905081 | 460 | (1) |
| F22017+0319 | 22:04:19.2 | 3:33:50.2 | 0.0660 | sy2 | 54000168 | 2488 | (1) |
| N7496 | 23:09:46.5 | -43:25:43.1 | 0.0055 | sy2 | 54201073 | 586 | (1) |
| N7590 | 23:18:55.2 | -42:14:16.9 | 0.0050 | sy2 | 54200878 | 562 | (1) |
| N7674=MK533 | 23:27:56.7 | 8:46:44.7 | 0.0290 | sy2 | 55800996 | 834 | (1) |
| MK551 | 0:29:25.1 | 30:33:33.8 | 0.0500 | sbn | 58302885 | 1574 | (1) |
| N232 | 0:42:45.8 | -23:33:37.2 | 0.0222 | sbn | 57001381 | 450 | (1) |
| IC1623 | 1:07:46.4 | -17:30:26.7 | 0.0201 | sbn | 57001288 | 376 | (1) |
| N838 | 2:09:38.4 | -10:08:48.0 | 0.0128 | sbn | 80600207 | 244 | (1) |
| U2369 | 2:54:01.7 | 14:58:15.1 | 0.0307 | sbn | 79300510 | 982 | (1) |
| M+1-33-36 | 13:01:49.9 | 4:20:01.5 | 0.0375 | sbn | 62000121 | 644 | (1) |
| IZW107 | 15:18:06.3 | 42:44:36.5 | 0.0400 | sbn | 57100715 | 610 | (1) |
| MK496=N6090 | 16:11:40.7 | 52:27:29.3 | 0.0291 | sbn | 54100719 | 886 | (1) |
| N6240 | 16:52:58.8 | 2:24:09.6 | 0.0243 | sbn | 47600512 | 752 | (2) |
| U11284 | 18:33:37.2 | 59:53:22.2 | 0.0286 | sbn | 25103948 | 419 | (1) |
| F20193-2013 | 20:22:15.4 | -20:04:03.3 | 0.0645 | sbn | 54200426 | 1370 | (1) |
| E286-IG19 | 20:58:26.6 | -42:38:57.3 | 0.0427 | sbn | 13500535 | 180 | (2) |
| E148-IG02 | 23:15:46.8 | -59:03:14.6 | 0.0446 | sbn | 13501750 | 180 | (2) |
Note. — (1): observations belonging to the ISO Open Time Program “IR energy distributions and imaging of the complete sample of 12 active galaxies”; (2): ISO archive data.
| Name | type | F(120) | F(150) | F(170) | F(180) | F(200 ) |
|---|---|---|---|---|---|---|
| (Jy) | (Jy) | (Jy) | (Jy) | (Jy) | ||
| E12-G21 | sy1 | 2.21 0.07 | 1.81 0.06 | 1.14 0.02 | 0.92 0.03 | |
| IZW1 | sy1 | 2.57 0.07 | 1.89 0.06 | 1.60 0.05 | 1.16 0.07 | 0.92 0.05 |
| MK1034 | sy1 | 10.9 0.1 | 5.68 0.05 | 2.26 0.10 | ||
| N931=MK1040 | sy1 | 5.54 0.13 | 5.25 0.07 | 3.72 0.08 | 2.88 0.03 | |
| N1365 | sy1 | 217. 0.8 | 194.0 0.4 | 167.0 0.6 | 103.0 0.4 | 85.2 0.5 |
| F03450+0055 | sy1 | 1.03 0.19 | 0.68 0.15 | |||
| MK618 | sy1 | 3.32 0.17 | 3.16 1.50 | 1.19 0.07 | 0.85 0.04 | |
| M-5-13-17 | sy1 | 2.54 0.05 | 1.86 0.09 | 0.86 0.05 | 0.55 0.03 | |
| MK9 | sy1 | 0.74 0.11 | 0.36 0.04 | 0.23 0.04 | ||
| MK79 | sy1 | 2.74 0.12 | 2.04 0.27 | 1.88 0.15 | 1.12 0.07 | 0.85 0.04 |
| 3C273 | sy1/qso | 1.49 0.13 | 1.09 0.08 | 1.10 0.05 | 0.80 0.11 | 0.79 0.11 |
| N4593 | sy1 | 8.1 0.1 | 4.7 0.1 | |||
| M-6-30-15 | sy1 | 1.06 0.04 | 0.40 0.06 | |||
| F13349+2438 | sy1 | 0.35 0.02 | ||||
| I4329A | sy1 | 1.87 0.08 | 1.2 0.2 | |||
| F15091-2107 | sy1 | 1.47 0.03 | 0.78 0.07 | |||
| N7213 | sy1 | 13.620.35 | 6.6 0.4 | |||
| 3C445 | sy1 | 0.56 0.08 | 0.49 0.16 | |||
| N7314 | sy1 | 24.5 0.5 | 19.4 0.4 | 17.4 0.3 | 11.3 0.2 | 7.3 0.2 |
| MK938=N34 | sy2 | 17.2 0.4 | 10.6 0.5 | 8.50.2 | 5.40.1 | 3.00.1 |
| N262=MK348 | sy2 | 2.24 0.08 | 2.28 0.04 | 1.890.03 | 1.290.02 | 1.140.04 |
| F00521-7054 | sy2 | 0.220.02 | 0.0870.017 | |||
| M-2-8-39 | sy2 | 1.46 0.05 | 1.26 0.03 | 0.7620.015 | ||
| N1241 | sy2 | 17.6 0.6 | 18.2 3.6 | 14.62.6 | 8.120.10 | 6.030.09 |
| N1320=MK607 | sy2 | 3.7 0.1 | 2.58 0.36 | 1.440.05 | 1.060.04 | |
| F03362-1642 | sy2 | 1.55 0.14 | 0.59 0.08 | 0.390.03 | 0.390.03 | |
| N1667 | sy2 | 29.6 8.8 | 16.3 0.5 | 17.02.8 | 9.030.15 | 6.330.17 |
| F05189-2524 | sy2 | 10.6 0.4 | 7.0 0.4 | 3.20.3 | 2.90.4 | |
| E253-G3 | sy2 | 2.74 0.17 | 1.71 0.19 | 0.860.14 | 0.510.04 | |
| N4501 | sy2 | 116 0.3 | 94.1 0.9 | 52.30.4 | 47.00.5 | |
| TOL1238-364 | sy2 | 7.420.11 | 4.600.06 | 3.620.11 | ||
| N4922A/B | sy2 | 6.80.9 | 7.1 1.8 | 2.970.03 | 1.830.08 | |
| M-3-34-64 | sy2 | 6.40.3 | 4.4 0.4 | 3.60.2 | 2.30.4 | |
| MK273 | sy2 | 23.60.52 | 16.950.22 | 7.480.20 | 5.750.30 | |
| MK463 | sy2 | 2.260.40 | 0.800.15 | 0.30 | 0.25 | |
| ARP220 | sy2/ulirg | 117.30.2 | 79.40.2 | 71.40.1 | 41.10.1 | 31.20.3 |
| F19254-7245 | sy2 | 3.50.5 | 2.60.3 | 0.70.2 | ||
| N6810 | sy2 | 29.80.1 | 16.90.2 | 14.00.2 | ||
| N6890 | sy2 | 11.70.1 | 8.80.1 | 5.090.03 | 4.360.05 | |
| I5063 | sy2 | 4.970.35 | 4.130.35 | 3.100.26 | 2.260.38 | |
| N7130=IC5135 | sy2 | 28.91.7 | 21.93.0 | 16.91.0 | 10.80.6 | 7.290.47 |
| N7172 | sy2 | 32.09.2 | 22.94.7 | 19.03.2 | 12.60.4 | 7.600.43 |
| F22017+0319 | sy2 | 0.850.13 | 0.540.02 | |||
| N7496 | sy2 | 20.80.1 | 16.20.2 | 13.90.5 | 8.890.12 | 6.250.07 |
| N7590 | sy2 | 25.90.1 | 22.82.7 | 17.60.2 | 12.40.8 | 7.910.08 |
| N7674=MK533 | sy2 | 9.380.18 | 7.650.37 | 6.020.06 | 3.670.11 | 2.780.04 |
| MK551 | sbn | 5.110.10 | 3.420.10 | 1.680.03 | 1.280.03 | |
| N232 | sbn | 18.10.4 | 18.95.2 | 15.73.9 | 9.111.5 | 5.440.09 |
| IC1623 | sbn | 36.50.3 | 26.70.3 | 23.50.4 | 12.800.07 | 9.690.09 |
| N838 | sbn | 4.070.13 | 2.840.08 | 2.420.14 | ||
| U2369 | sbn | 11.10.1 | 8.710.22 | 6.970.09 | 4.270.07 | 3.220.10 |
| M+1-33-36 | sbn | 7.250.06 | 5.900.08 | 6.481.50 | 3.450.04 | 2.420.05 |
| IZW107 | sbn | 9.840.09 | 11.34.7aaThe low value of the signal to noise is due to a large uncertainty in the internal calibrator measurements. | 9.03.8aaThe low value of the signal to noise is due to a large uncertainty in the internal calibrator measurements. | 3.180.04 | 2.290.08 |
| MK496=N6090 | sbn | 9.980.10 | 6.870.10 | 3.470.03 | 2.550.04 | |
| N6240 | sbn | 23.70.3 | 18.20.2 | 16.70.1 | 9.50.1 | 7.10.3 |
| U11284 | sbn | 35.10.3 | 27.00.2 | 14.50.2 | 13.50.3 | |
| F20193-2013 | sbn | 3.980.04 | 3.000.05 | 1.260.02 | ||
| E286-IG19 | sbn | 7.0 0.3 | 4.4 0.2 | 2.10.1 | 1.00.3 | |
| E148-IG02 | sbn | 11.40.6 | 7.950.25 | 4.310.18 | 2.80.3 |
| Name | Log(LFIR) | type | Name | Log(LFIR) | type | Name | Log(LFIR) | type |
|---|---|---|---|---|---|---|---|---|
| (erg s-1) | (erg s-1) | (erg s-1) | ||||||
| E12-G21 | 44.501 | sy1 | N262=MK348 | 43.966 | sy2 | N7496 | 43.808 | sy2 |
| IZW1 | 45.303 | sy1 | F00521-7054 | 45.005 | sy2 | N7590 | 43.718 | sy2 |
| MK1034 | 45.147 | sy1 | N1068aaISOPHOT data from Pérez García & Rodríguez Espinosa (2000) | 44.763 | sy2 | N7582bbISOPHOT data from Radovich et al. (1999) | 44.416 | sy2 |
| N931=MK1040 | 44.320 | sy1 | N1143/4aaISOPHOT data from Pérez García & Rodríguez Espinosa (2000) | 45.145 | sy2 | N7674=MK533 | 45.040 | sy2 |
| N1365 | 44.815 | sy1 | M-2-8-39 | 44.221 | sy2 | MK551 | 45.229 | sbn |
| F03450+0055 | 44.192 | sy1 | N1241 | 43.922 | sy2 | N232 | 45.035 | sbn |
| MK618 | 44.802 | sy1 | N1320=MK607 | 43.691 | sy2 | I1623 | 45.221 | sbn |
| M-5-13-17 | 43.705 | sy1 | F03362-1642 | 44.422 | sy2 | N838 | 44.328 | sbn |
| MK9 | 44.452 | sy1 | N1667 | 44.696 | sy2 | U2369 | 45.114 | sbn |
| MK79 | 44.313 | sy1 | F05189-2524 | 45.498 | sy2 | M+1-33-36 | 45.111 | sbn |
| N3227aaISOPHOT data from Pérez García & Rodríguez Espinosa (2000) | 43.640 | sy1 | E253-G3 | 44.900 | sy2 | IZW107 | 45.377 | sbn |
| N3516aaISOPHOT data from Pérez García & Rodríguez Espinosa (2000) | 43.588 | sy1 | N3079aaISOPHOT data from Pérez García & Rodríguez Espinosa (2000) | 44.256 | sy2 | MK496=N6090 | 44.958 | sbn |
| N4051aaISOPHOT data from Pérez García & Rodríguez Espinosa (2000) | 43.350 | sy1 | N3982aaISOPHOT data from Pérez García & Rodríguez Espinosa (2000) | 43.602 | sy2 | N6240 | 45.308 | sbn |
| N4151aaISOPHOT data from Pérez García & Rodríguez Espinosa (2000) | 43.317 | sy1 | N4388aaISOPHOT data from Pérez García & Rodríguez Espinosa (2000) | 44.315 | sy2 | F20193-2013 | 45.097 | sbn |
| MK766=N4253aaISOPHOT data from Pérez García & Rodríguez Espinosa (2000) | 44.098 | sy1 | N4501 | 44.637 | sy2 | E286-IG19 | 45.387 | sbn |
| 3C273 | 46.071 | sy1 | TOL1238-364 | 44.149 | sy2 | E148-IG02 | 45.450 | sbn |
| N4593 | 43.640 | sy1 | N4922A/B | 44.715 | sy2 | N245=MK555ccISOPHOT data from Siebenmorgen, Krugel & Chini (1999) | 44.037 | nor |
| MK231aaISOPHOT data from Pérez García & Rodríguez Espinosa (2000) | 45.930 | sy1 | M-3-34-64 | 44.532 | sy2 | U2936ccISOPHOT data from Siebenmorgen, Krugel & Chini (1999) | 44.357 | nor |
| N5033aaISOPHOT data from Pérez García & Rodríguez Espinosa (2000) | 43.811 | sy1 | N5256=MK266aaISOPHOT data from Pérez García & Rodríguez Espinosa (2000) | 44.983 | sy2 | U2982ccISOPHOT data from Siebenmorgen, Krugel & Chini (1999) | 44.696 | nor |
| M-6-30-15 | 43.219 | sy1 | MK273 | 45.572 | sy2 | N5430=MK799ccISOPHOT data from Siebenmorgen, Krugel & Chini (1999) | 44.194 | nor |
| F13349+2438 | 45.508 | sy1 | MK463 | 45.102 | sy2 | N5719ccISOPHOT data from Siebenmorgen, Krugel & Chini (1999) | 43.692 | nor |
| I4329A | 44.240 | sy1 | N5929aaISOPHOT data from Pérez García & Rodríguez Espinosa (2000) | 44.128 | sy2 | N6918ccISOPHOT data from Siebenmorgen, Krugel & Chini (1999) | 43.684 | nor |
| N5548aaISOPHOT data from Pérez García & Rodríguez Espinosa (2000) | 43.930 | sy1 | ARP220 | 45.669 | sy2 | N7083ccISOPHOT data from Siebenmorgen, Krugel & Chini (1999) | 44.398 | nor |
| MK817aaISOPHOT data from Pérez García & Rodríguez Espinosa (2000) | 44.619 | sy1 | F19254-7245 | 45.415 | sy2 | N7624=MK323ccISOPHOT data from Siebenmorgen, Krugel & Chini (1999) | 44.234 | nor |
| F15091-2107 | 44.693 | sy1 | N6810 | 44.125 | sy2 | N7714=MK538ccISOPHOT data from Siebenmorgen, Krugel & Chini (1999) | 44.111 | nor |
| N7213 | 43.466 | sy1 | N6890 | 43.815 | sy2 | N7798=MK332ccISOPHOT data from Siebenmorgen, Krugel & Chini (1999) | 43.781 | nor |
| 3C445 | 44.540 | sy1 | I5063 | 44.182 | sy2 | N134ddISOPHOT data from Alton et al. (1998) | 44.034 | nea |
| N7314 | 43.650 | sy1 | N7130=IC5135 | 44.916 | sy2 | N660ddISOPHOT data from Alton et al. (1998) | 43.809 | nea |
| N7469aaISOPHOT data from Pérez García & Rodríguez Espinosa (2000) | 45.131 | sy1 | N7172 | 44.239 | sy2 | N5194=M51ddISOPHOT data from Alton et al. (1998) | 44.100 | nea |
| MK938=N34 | 44.923 | sy2 | F22017+0319 | 45.013 | sy2 | N5236=M83ddISOPHOT data from Alton et al. (1998) | 44.127 | nea |
Note. — The galaxy type is coded as follows: sy1: Seyfert 1; sy2: Seyfert 2; sbn: starburst nucleus; nor: normal galaxy; nea: nearby spiral galaxy.
| Galaxy class | [60 - 25] | [100 - 60] | [200 - 100] | ||||
|---|---|---|---|---|---|---|---|
| Seyfert 1’s | 0.400.30 | 0.230.15 | -0.430.21 | -1.1 | -1.0 | 1.4 | -1.0 |
| CfA Seyfert 1’s | 0.470.29 | 0.190.17 | -0.260.32 | ||||
| Seyfert 2’s | 0.620.29 | 0.160.18 | -0.470.21 | -1.6 | -0.7 | 1.6 | -1.4 |
| CfA Seyfert 2’s | 0.770.26 | 0.230.09 | -0.160.14 | ||||
| Starburst | 0.820.16 | 0.110.09 | -0.660.21 | -2.1 | -0.5 | 2.2 | -1.7 |
| Normal galaxies | 0.840.12 | 0.280.12 | -0.250.17 | -2.2 | -1.3 | 0.8 | -1.6 |
| Nearby spirals | 0.830.10 | 0.390.15 | 0.220.08 | -2.2 | -1.7 | -0.7 | -1.6 |
| Name | F(60) | F(65) | F(80) | F(90) | F(100) | F(105) | notes |
|---|---|---|---|---|---|---|---|
| (Jy) | (Jy) | (Jy) | (Jy) | (Jy) | (Jy) | ||
| F00521-7054 | 1.260.04 | 1.100.08 | 1.100.04 | 0.630.03 | 0.830.04 | ||
| N7674 | 3.50.1 | 4.60.1 | 4.00.1 | 2.990.06 | 3.70.1 | ||
| F03362-1642 | 1.100.05 | 1.100.04 | 1.010.03 | 1.100.04 | |||
| M+1-33-36 | 5.51.0 | 5.71.0 | 7.81.0 | 5.21.0 | (1) | ||
| N262 | 0.740.07 | 0.670.07 | 0.870.05 | 0.730.03 | 0.930.04 | (1) | |
| N1365 | 81.91.0 | 121.01.0 | 114.01.0 | ||||
| N4501 | 18.00.2 | 35.00.4 | (1) | ||||
| N4922AB | 5.200.1 | 6.100.1 | |||||
| N6890 | 8.40.6 | 15.80.9 |
Note. — (1): extended emission detected