The Chandra Deep Field-North Survey and the Cosmic X-ray Background
Abstract
diffuse radiation; surveys; cosmology: observations; galaxies: active; X-rays: galaxies; X-rays: general Chandra has performed a 1.4 Ms survey centred on the Hubble Deep Field-North (HDF-N), probing the X-ray Universe 55–550 times deeper than was possible with pre-Chandra missions. We describe the detected point and extended X-ray sources and discuss their overall multiwavelength (optical, infrared, submillimeter, and radio) properties. Special attention is paid to the HDF-N X-ray sources, luminous infrared starburst galaxies, optically faint X-ray sources, and high-to-extreme redshift AGN. We also describe how stacking analyses have been used to probe the average X-ray emission properties of normal and starburst galaxies at cosmologically interesting distances. Finally, we discuss plans to extend the survey and argue that a 5–10 Ms Chandra survey would lay key groundwork for future missions such as XEUS and Generation-X.
1 Introduction
1.1 The Cosmic X-ray Background
The cosmic X-ray background was the first cosmic background radiation discovered (Giacconi et al. 1962) and has % of the energy density of the cosmic microwave background (see, e.g., Fabian & Barcons 1992 and Hasinger 2000 for reviews). In contrast to the cosmic microwave background, the cosmic X-ray background is comprised of the integrated contributions from a large number of discrete sources. The X-ray background thus represents the summed emission from all X-ray sources since the Universe was less than a billion years old, and by surveying it we can learn about the nature and evolution of X-ray emitting objects over most of the history of the Universe.
The X-ray background is detected over a broad energy band from 0.1–200 keV, peaking in energy density from 20–40 keV; the logarithmic frequency/energy coverage is comparable to that of the far-infrared to extreme ultraviolet bandpass. Current deep imaging surveys of the X-ray background, however, have been primarily conducted in the narrower 0.1–12 keV band due largely to technological limitations.
Observations with the new generation of X-ray observatories, Chandra (Weisskopf et al. 2000) and XMM-Newton (Jansen et al. 2001), have revolutionised studies of the X-ray background and the sources that comprise it. Early observations with Chandra resolved most of the 2–8 keV background into point sources (e.g., Brandt et al. 2000; Mushotzky et al. 2000; Giacconi et al. 2001); most of the 0.5–2 keV background had already been resolved by ROSAT (e.g., Hasinger et al. 1998). The accurate positions from the new observatories, particularly Chandra, also allow X-ray sources to be matched unambiguously to (often faint) multiwavelength counterparts. X-ray surveys have finally reached the depths needed to complement the most sensitive surveys in the radio, submillimeter, infrared, and optical bands. The focus has now shifted from simply resolving the X-ray background to understanding in detail the sources that comprise it at all X-ray fluxes. While it is clear that massive, accreting black holes produce the bulk of the X-ray background, the deepest X-ray surveys are now allowing the study of other source classes, including starburst and normal galaxies.
In this article, we will review some of the current results from the ongoing Chandra Deep Field-North (CDF-N) survey. Other ongoing deep X-ray surveys that have published results at present include the Chandra Deep Field South Survey (e.g., Giacconi et al. 2002; Rosati et al. 2002), the Lockman Hole Survey (e.g., Hasinger et al. 2001; Lehmann et al. 2001), and the SSA13 Survey (e.g., Mushotzky et al. 2000; Barger et al. 2001a). Many other important X-ray surveys are being performed over larger solid angles to shallower depths.
Throughout this article we adopt km s-1 Mpc-1, , and .
1.2 The Chandra Deep Field-North Survey
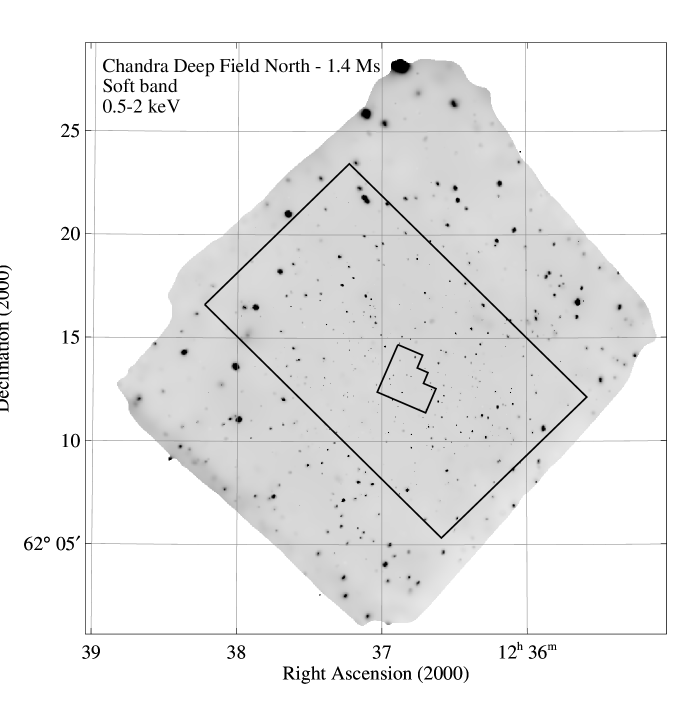
The CDF-N survey is currently the deepest X-ray survey ever performed. It is comprised of 1.4 Ms (16.2 days) of exposure with the Chandra Advanced CCD Imaging Spectrometer (ACIS) covering an field (see Fig. 1) centred on the Hubble Deep Field-North (HDF-N; see Ferguson et al. 2000); these observations are publicly available. This is an excellent field for study, since it already has intensive coverage at optical, infrared, submillimeter and radio wavelengths (see Ferguson et al. 2000 for a review). More than 800 spectroscopic redshifts have been obtained in the field (e.g., Cohen et al. 2000). In the soft (0.5–2 keV) and hard (2–8 keV) X-ray bands, the Chandra data reach fluxes and times fainter than surveys by previous X-ray missions (see Fig. 2). Near the centre of the field, sources with count rates as low as count per 2 days can be detected. Source densities near the soft-band and hard-band flux limits are deg-2 and deg-2 (e.g., Brandt et al. 2001b; Cowie et al. 2002); the fraction of the X-ray background resolved in the soft and hard bands is % and %, respectively (the main uncertainty in the resolved fraction is the absolute normalisation of the background itself). Source positions are typically accurate to better than over the entire field, allowing multiwavelength counterparts to be identified reliably.
The CDF-N team includes researchers from The Pennsylvania State University, The University of Hawaii, The University of Wisconsin, The Massachusetts Institute of Technology, The California Institute of Technology, and Carnegie Mellon University. To see all the contributors to the various CDF-N projects, please refer to the author lists of the cited CDF-N publications.

2 Some Key Results from the Survey
2.1 Detected Point and Extended Sources
The CDF-N data have been searched intensively for point sources using the Chandra X-ray Center’s wavdetect algorithm (Freeman et al. 2002). At a wavdetect false-positive probability threshold of , independent sources are detected in the 1.4 Ms exposure. In addition, a substantial number of sources have been found at lower significance levels that are spatially correlated with objects found at other wavelengths (e.g., optically bright galaxies). Many of these sources are real, but it is more difficult to define a complete X-ray flux-limited sample of these sources. In the full band (0.5–8 keV), the typical source has counts which is too small for detailed X-ray spectral analysis. Assessment of spectral hardness is possible, however, and X-ray spectral analysis can be performed for the brighter sources in the field. Catalogs of the detected sources and related analysis products have been made publicly available for the 1 Ms exposure (see Brandt et al. 2001b).111http://www.astro.psu.edu/users/niel/hdf/hdf-chandra.html
Six extended X-ray sources have also been detected in the CDF-N (Bauer et al. 2002). Their X-ray spectral properties, angular sizes, and likely luminosities ( erg s-1) are generally consistent with those found for nearby groups of galaxies. Two extended X-ray sources of note are (1) a group in the HDF-N associated with the FR I radio galaxy VLA J123644.3+621133, and (2) a likely poor-to-moderate cluster at that is coincident with an overdensity of Very Red Objects (VROs; ), optically faint () radio sources, and optically faint X-ray sources. The surface density of extended X-ray sources is deg-2 at a limiting soft-band flux of erg cm-2 s-1. No evolution in the X-ray luminosity function of clusters is needed to explain this value.
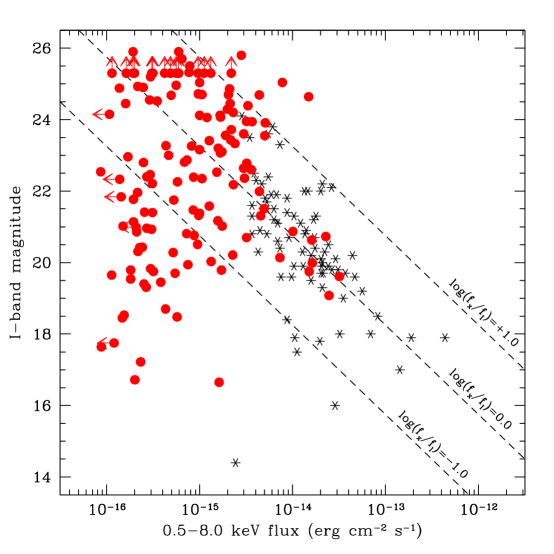

Fig. 3 shows the -band magnitudes of the X-ray point sources near the centre of the CDF-N field. There is a wide spread of -band magnitudes at faint X-ray fluxes, corresponding to a range of source types. The faint X-ray sources with 15–22 counterparts are normal galaxies, starburst galaxies, low-luminosity AGN, and stars. The faint X-ray sources with counterparts appear to be mostly luminous AGN; these often show evidence for X-ray absorption via large hardness ratios.
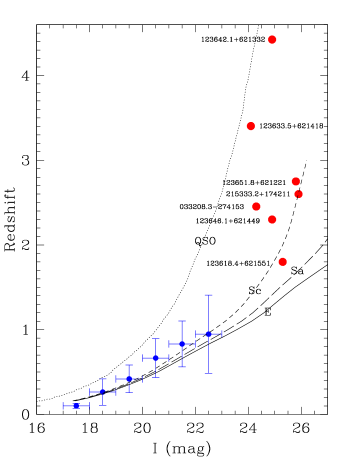
Optical spectra are presently available for CDF-N objects. The majority of the sources with spectroscopic redshifts lie at (see Fig. 4). This result is at least partially due to a selection effect: as implied by Fig. 4, the X-ray sources at will frequently be too optically faint for spectroscopy (with ). These sources are discussed further in §2d. Even after making plausible corrections for selection effects, however, it appears likely that more X-ray power originates from than predicted by some X-ray background synthesis models; these models will require revision.

2.2 Results for the Hubble Deep Field-North
Fig. 5 shows the 27 HDF-N X-ray point sources detected thus far (Hornschemeier et al. 2000; Brandt et al. 2001a; W.N. Brandt et al., in preparation); 16 are found with a false-source probability threshold of while the other 11 are found with lower significance but align spatially with optical galaxies (see §2a). As expected from Figs. 3 and 4, most sources are at , and their optical counterparts have a wide range of brightness. In at least one HDF-N object (CXOHDFN J123641.7+621131 at ) the X-ray source is offset from the nucleus; the X-ray emission may arise from a starburst region in the host galaxy as it is coincident with a bright, blue “knot.”
We have been able to find likely optical or near-infrared counterparts for all of the X-ray sources in the HDF-N; this contrasts with the case in the radio where some truly “blank-field” sources have been found (e.g., Richards et al. 1999). We find a good correspondence between our brighter X-ray sources and micro-Jy radio (1.4 GHz and 8.5 GHz) sources, but this trend does not continue for our faintest X-ray sources. For instance, 10 of the 16 brightest Chandra sources have radio matches, but only 12 of the 27 total Chandra sources have radio matches. The properties of the X-ray/radio sources suggest a broad range of emission mechanisms (e.g., Richards et al. 1998; Brandt et al. 2001a). We also find a good correspondence between Chandra and ISO (6.7 m and 15 m; Aussel et al. 1999) sources in the HDF-N. Ten of the 16 brightest Chandra sources have ISO matches, and 14 of the 27 total Chandra sources have ISO matches. This good X-ray/IR correspondence bodes well for future IR follow-up of X-ray sources with SIRTF (see §3b). In this field with both exceptionally sensitive X-ray and IR coverage, we find a broad range of X-ray/IR source types including starburst galaxies, obscured AGN, and normal elliptical galaxies. In the majority of the sources, the IR emission appears to be from dust re-emission of primary X-ray and ultraviolet radiation.
2.3 X-ray Connections with Infrared, Radio and Submillimeter Sources
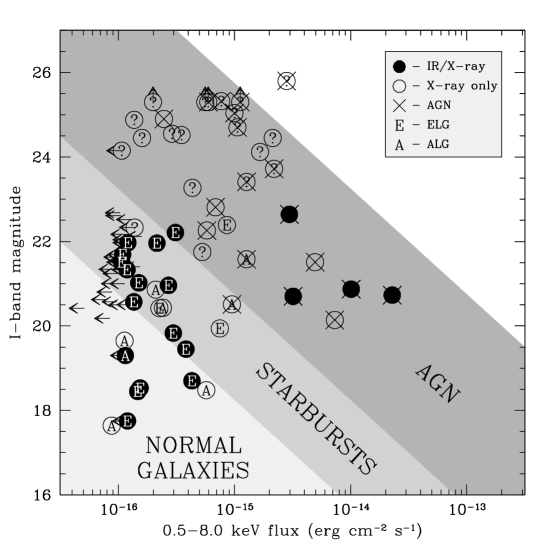
More detailed studies of the X-ray/IR sources in the CDF-N have recently been completed by Alexander et al. (2002b) and Fadda et al. (2002). These use the 21.5 arcmin2 region with uniform ISO coverage at 15 m rather than just the HDF-N (5.3 arcmin2). Only % of the X-ray/IR sources are likely AGN. The majority rather appear to be 0.4–1.3 starburst galaxies and normal galaxies (see Fig. 6). A notable finding is that up to 100% of the X-ray detected emission-line galaxies (see Cohen et al. 2000 for the optical spectral classification) have 15 m counterparts (Alexander et al. 2002b); the majority of these are luminous IR starburst galaxies representative of the population making the bulk of the IR background. The X-ray/radio matched galaxies trace the same star-forming population as the X-ray/IR sources with nearly 100% of the matched galaxies in common (F.E. Bauer et al., in preparation). In addition, the X-ray/radio matches appear to trace a population of optically faint AGN.
Barger et al. (2001b) have shown that the ensemble of CDF-N X-ray sources contribute about 15% of the extragalactic submillimeter background light at 850 m, with the strongest submillimeter emission being seen from optically faint X-ray sources that are also detected at 1.4 GHz. At the current CDF-N flux limit, % of the submillimeter sources have X-ray counterparts.
2.4 Optically Faint and High-Redshift X-ray Sources
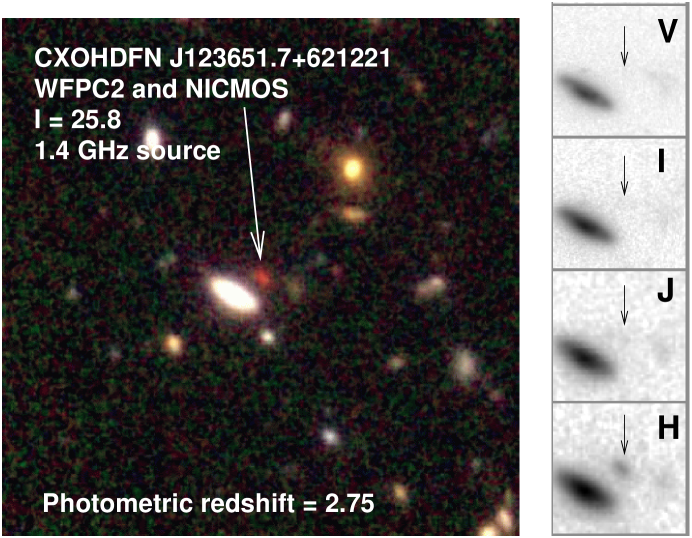
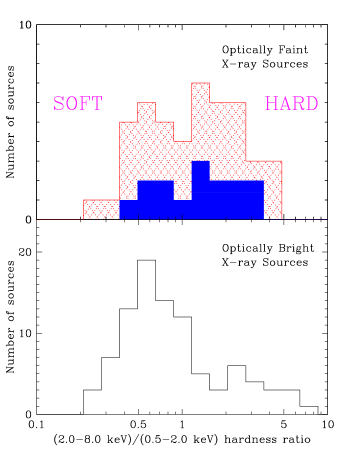
As mentioned in §2a, a significant fraction of the CDF-N X-ray sources are too optically faint for easy spectroscopic follow-up studies. One notable example from the HDF-N is shown in Fig. 7. Alexander et al. (2001) present a detailed study of the 47 optically faint X-ray sources (defined as having ) in an region centred on the HDF-N. The number of optically faint X-ray sources increases at faint X-ray fluxes. However, the fraction of optically faint sources within the X-ray source population stays roughly constant at % for full-band fluxes from – erg cm-2 s-1 due to the emergence of a population of optically bright sources (see §2a and Fig. 3). Many of the optically faint X-ray sources have red optical-to-near-IR colours, and a significant fraction are classified as VROs (see also Alexander et al. 2002a for a detailed X-ray study of CDF-N VROs). They also have harder X-ray spectra on average than the sources with (see Fig. 8a). Roughly half of the optically faint sources with enough X-ray counts to allow an effective search for X-ray variability show it, and the redshifts of the majority of the optically faint X-ray sources are estimated to be 1–3 (see Fig. 8b). All of these facts support an interpretation where most of the optically faint X-ray sources are luminous, obscured AGN (e.g., Seyfert 2 galaxies and type 2 quasars) at intermediate redshifts.
A minority of the optically faint X-ray sources, however, may be AGN at high-to-extreme redshifts ( 4–10). One notable example is CXOHDFN J123642.0+621331 (Brandt et al. 2001a; ) which lies just outside the HDF-N and is a micro-Jy radio source at a likely redshift of (Waddington et al. 1999). With an X-ray luminosity of erg s-1, this is by far the lowest luminosity X-ray source known at . Its detection directly demonstrates that Chandra is achieving the sensitivity needed to study Seyfert-luminosity AGN at high redshift.
A large population of Seyfert-luminosity AGN at 4–10 has been postulated by Haiman & Loeb (1999). These objects would represent the first massive black holes to form in the Universe. At an AGN should appear not only optically faint but optically blank; the Lyman forest and Gunn-Peterson trough will absorb essentially all flux through the band. Thus, an upper limit on the space density of extreme redshift AGN can be set simply by counting the number of X-ray sources that lack any optical counterpart.222Of course, this method requires the plausible assumption that extreme redshift AGN be X-ray luminous. The best available data suggest that this should be the case (e.g., Vignali et al. 2001; Brandt et al. 2002). Note also that at Chandra provides rest-frame sensitivity up to keV; such high-energy X-rays can penetrate a substantial amount of obscuration. Unfortunately, however, confusion between truly optically blank sources at extreme redshift and very optically faint sources at moderate redshift (e.g., objects like that in Fig. 7) occurs without exceptionally deep optical imaging. At present, the CDF-N data suggest that there is AGN detected at per arcmin2 (Alexander et al.. 2001). This limit should soon be tightened substantially via the GOODS project (see §3b).

The highest redshift AGN discovered in CDF-N follow-up studies has (A.J. Barger et al., in preparation). This is the highest redshift X-ray selected AGN, and it has relatively narrow emission lines. This source is not optically faint () and has an X-ray luminosity of erg s-1; it could have been detected by Chandra out to .
2.5 Stacking Studies of Galaxies at Cosmologically Interesting Distances
At the fainter X-ray fluxes of the CDF-N, a significant number of “normal” galaxies are detected at where the observed emission appears to originate from X-ray binaries, ultraluminous X-ray sources, supernova remnants, and perhaps low-luminosity AGN (e.g., Hornschemeier et al. 2001; A.E. Hornschemeier et al., in preparation). For example, in the HDF-N Chandra has detected all optically luminous galaxies out to (Brandt et al. 2001a).
X-ray studies of normal galaxies at cosmological distances are of importance since normal galaxies are expected to be the most numerous extragalactic X-ray sources at the faintest X-ray fluxes; in Fig. 5 there are galaxies but only 27 X-ray sources, so “there’s plenty of room at the bottom” (cf. Feynman 1960). Normal galaxies are expected to dominate the number counts at soft-band fluxes of erg cm-2 s-1 (e.g., Ptak et al. 2001; Hornschemeier et al. 2002; Miyaji & Griffiths 2002), and they should be one of the main source types detected by missions such as XEUS and Generation-X. Furthermore, the X-ray properties of galaxies might well have changed in response to the substantial change in the cosmic star formation rate over the history of the Universe; changes in the star formation rate should affect the production of X-ray binaries and supernovae (e.g., Ghosh & White 2001).
Most normal galaxies at cannot be individually detected in the current CDF-N data, but their average properties can be probed using stacking techniques where the X-ray emission from many individually undetected galaxies is added together. Using stacking techniques, Hornschemeier et al. (2002) have measured the average X-ray luminosities of spiral galaxies out to , corresponding to a look-back time of Gyr. These measurements allow the first reliable predictions of the number of normal galaxies that should be seen in deeper X-ray exposures; typical observed soft-band fluxes are (3–7) erg cm-2 s-1. There is evidence for a factor of 2–3 increase in X-ray luminosity (per unit -band luminosity) with redshift (see Fig. 9), although this is weaker than some theoretical models have predicted.
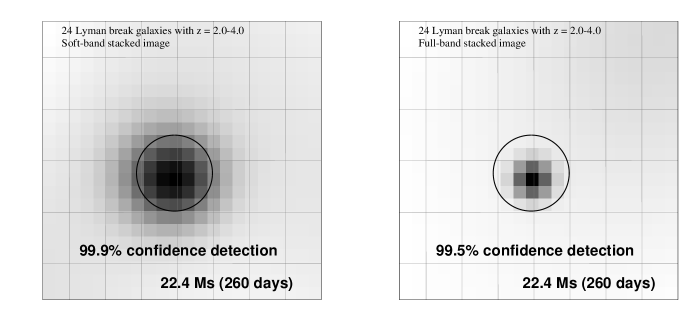
At higher redshifts ( 2–4), X-ray stacking analyses have allowed an average detection of the Lyman break galaxies in the HDF-N (see Fig. 10; Brandt et al. 2001c). In the rest-frame ultraviolet and optical bands these galaxies share many of the properties of local starburst galaxies and have estimated star formation rates of 20–50 M⊙ yr-1. We find their average X-ray luminosity ( erg s-1 in the rest-frame 2–8 keV band) to be similar to those of the most luminous local starburst galaxies (these have star formation rates comparable to those estimated for the Lyman break galaxies). For Lyman break galaxies, the observed ratio of X-ray to -band luminosity is somewhat, but not greatly, higher than that seen from local starburst galaxies.
3 The Future
3.1 Additional X-ray Coverage

The current CDF-N survey is far from the limit of Chandra’s capability. The full-band detector background is so low that, with appropriate grade screening, Chandra will not fully enter the background-limited regime near the aim point for exposure times of Ms. In the soft band the situation is even better due to the lower background, and Chandra should remain photon limited to Ms. At present, Chandra observation time is allocated to extend the survey to 2 Ms, and additional observations will be proposed.
Fig. 11 shows that with sufficient exposure (5–10 Ms), Chandra surveys can reach depths comparable to those discussed for missions such as XEUS. They would thereby bolster the science cases for missions such as XEUS and Generation-X, providing key information on the existence and nature of the sources to be targeted by these missions. Important targets would include the first massive black holes at high redshift as well as normal and starburst galaxies at intermediate redshift. Detailed spectral, temporal, and spatial constraints would be obtained for all the sources currently detected. Furthermore, Fig. 11 shows that Chandra positions are likely to be the best available for 15–20 years; these will be essential for the reliable identification of optically faint sources at high redshift.
3.2 Observations at Other Wavelengths
Multiwavelength follow-up studies of the CDF-N sources continue, and a catalog presenting the current optical photometric and spectroscopic results will be completed shortly (A.J. Barger et al., in preparation). The Great Observatories Origins Deep Survey (GOODS) project will soon obtain deep, public HST Advanced Camera for Surveys and SIRTF coverage over the deepest of the CDF-N (see Fig. 1).333http://www.stsci.edu/science/goods/ These projects, along with others already completed and in progress, will provide a panchromatic data set with the sensitivity and angular resolution needed to complement fully the CDF-N.
Acknowledgements.
We thank all the members of the CDF-N team. This work would not have been possible without the efforts of the entire Chandra and ACIS teams. We gratefully acknowledge the financial support of NASA grant NAS 8-38252 (Gordon P. Garmire, PI), NSF CAREER award AST-9983783 (WNB, DMA, FEB), and NASA GSRP grant NGT 5-50247 and the Pennsylvania Space Grant Consortium (AEH).References
- [1]
- [2] Alexander, D.M., Brandt, W.N., Hornschemeier, A.E., Garmire, G.P., Schneider, D.P., Bauer, F.E. & Griffiths, R.E. 2001 The Chandra Deep Field-North survey. VI. The nature of the optically faint X-ray source population. The Astronomical Journal, 122, 2156–2176.
- [3]
- [4] Alexander, D.M., Vignali, C., Bauer, F.E., Brandt, W.N., Hornschemeier, A.E., Garmire, G.P. & Schneider, D.P. 2002a The Chandra Deep Field-North survey. X. X-ray emission from Very Red Objects. The Astronomical Journal, in press (astro-ph/0111397).
- [5]
- [6] Alexander, D.M., Aussel, H., Bauer, F.E., Brandt, W.N., Hornschemeier, A.E., Vignali, C., Garmire, G.P. & Schneider, D.P. 2002b The Chandra Deep Field-North survey. XI. X-ray emission from luminous infrared starburst galaxies. The Astrophysical Journal, submitted.
- [7]
- [8] Aussel, H., Cesarsky, C.J., Elbaz, D. & Starck, J.L. 1999 ISOCAM observations of the Hubble Deep Field reduced with the PRETI method. Astronomy & Astrophysics, 342, 313–336.
- [9]
- [10] Barger, A.J., Cowie, L.L., Mushotzky, R.F. & Richards, E.A. 2001a The nature of the hard X-ray background sources: Optical, near-infrared, submillimeter, and radio properties. The Astronomical Journal, 121, 662–682.
- [11]
- [12] Barger, A.J., Cowie, L.L., Steffen, A.T., Hornschemeier, A.E., Brandt, W.N., & Garmire, G.P., 2001b Submillimeter properties of the 1 Ms Chandra Deep Field-North X-ray sample. The Astrophysical Journal, 560, L23–L28.
- [13]
- [14] Bauer, F.E., et al. 2002 The Chandra Deep Field-North survey. IX. Extended X-ray sources. The Astronomical Journal, in press (astro-ph/0112002).
- [15]
- [16] Brandt, W.N., et al. 2000 Observations of faint, hard-band X-ray sources in the field of CRSS J0030.5+2618 with the Chandra X-ray Observatory and the Hobby-Eberly Telescope. The Astronomical Journal, 119, 2349–2359.
- [17]
- [18] Brandt, W.N., et al. 2001a The Chandra deep survey of the Hubble Deep Field-North area. IV. An ultradeep image of the Hubble Deep Field-North. The Astronomical Journal, 122, 1–20.
- [19]
- [20] Brandt, W.N., et al. 2001b The Chandra Deep Field-North survey. V. 1 Ms source catalogs. The Astronomical Journal, 122, 2810–2832.
- [21]
- [22] Brandt, W.N., Hornschemeier, A.E., Schneider, D.P., Alexander, D.M., Bauer, F.E., Garmire, G.P. & Vignali, C. 2001c The Chandra Deep Field-North survey. VII. X-ray emission from Lyman break galaxies. The Astrophysical Journal, 558, L5–L9.
- [23]
- [24] Brandt, W.N., et al. 2002 Exploratory Chandra observations of the three highest redshift quasars. The Astrophysical Journal, submitted (astro-ph/0202235).
- [25]
- [26] Cohen, J.G., Hogg, D.W., Blandford, R., Cowie, L.L., Hu, E., Songaila, A., Shopbell, P., & Richberg, K. 2000 Caltech faint galaxy redshift survey. X. A redshift survey in the region of the Hubble Deep Field-North. The Astrophysical Journal, 538, 29–52.
- [27]
- [28] Cowie, L.L., Garmire, G.P., Bautz, M.W., Barger, A.J., Brandt, W.N. & Hornschemeier, A.E. 2002 2–8 keV X-ray number counts determined from Chandra blank field observations. The Astrophysical Journal, 566, L5–L8.
- [29]
- [30] Dickinson, M., et al. 2000 The unusual infrared object HDF-N J123656.3+621322. The Astrophysical Journal, 531, 624–634.
- [31]
- [32] Ebeling, H., White, D.A. & Rangarajan, F.V.N. 2002 ASMOOTH: A simple and efficient algorithm for adaptive kernel smoothing of two-dimensional imaging data. Monthly Notices of the Royal Astronomical Society, submitted.
- [33]
- [34] Fabian, A.C. & Barcons, X. 1992 The origin of the X-ray background. Annual Reviews of Astronomy and Astrophysics, 30, 429–456.
- [35]
- [36] Fadda, D., Flores, H., Hasinger, G., Franceschini, A., Altieri, B., Cesarsky, C.J., Elbaz, D. & Ferrando, Ph. 2002 The AGN contribution to mid-infrared surveys: X-ray counterparts of the mid-infrared sources in the Lockman Hole and HDF. Astronomy & Astrophysics, in press (astro-ph/0111412).
- [37]
- [38] Ferguson, H.C., Dickinson, M. & Williams, R. 2000 The Hubble Deep Fields. Annual Reviews of Astronomy & Astrophysics, 38, 667–715.
- [39]
- [40] Feynman, R.P. 1960 There’s Plenty of Room at the Bottom. Engineering and Science, February 1960 issue, California Institute of Technology, USA.
- [41]
- [42] Freeman, P.E., Kashyap, V., Rosner, R. & Lamb, D.Q. 2002 A wavelet-based algorithm for the spatial analysis of Poisson data. The Astrophysical Journal Supplements, 138, 185–218.
- [43]
- [44] Ghosh, P. & White, N.E. 2001 X-ray probes of cosmic star-formation history. The Astrophysical Journal, 559, L97–L100.
- [45]
- [46] Giacconi, R., Gursky, H., Paolini, F.R. & Rossi, B.B. 1962 Evidence for X-rays from sources outside the solar system. Physical Review Letters, 9, 439–443.
- [47]
- [48] Giacconi, R., et al. 2001 First results from the X-ray and optical survey of the Chandra Deep Field South. The Astrophysical Journal, 551, 624–634.
- [49]
- [50] Giacconi, R., et al. 2002 Chandra Deep Field South: The 1 Ms source catalog. The Astrophysical Journal Supplements, in press (astro-ph/0110452).
- [51]
- [52] Haiman, Z. & Loeb, A. 1999 X-ray emission from the first quasars. The Astrophysical Journal, 521, L9–L12.
- [53]
- [54] Hasinger, G., Burg, R., Giacconi, R., Schmidt, M., Trümper, J. & Zamorani, G. 1998 The ROSAT deep survey: I. X-ray sources in the Lockman field. Astronomy & Astrophysics, 329, 482–494.
- [55]
- [56] Hasinger, G. 2000 X-ray surveys of the obscured Universe. In ISO Surveys of a Dusty Universe (ed. D. Lemke, M. Stickel & K. Wilke). Springer Lecture Notes in Physics, no. 548, 423–431.
- [57]
- [58] Hasinger, G., et al. 2001 XMM-Newton observations of the Lockman Hole. I. The X-ray data. Astronomy & Astrophysics, 365, L45–L50.
- [59]
- [60] Hornschemeier, A.E., et al. 2000 X-ray sources in the Hubble Deep Field-North detected by Chandra. The Astrophysical Journal, 541, 49–53.
- [61]
- [62] Hornschemeier, A.E., et al. 2001 The Chandra deep survey of the Hubble Deep Field-North area. II. Results from the Caltech Faint Field Galaxy Redshift Survey area. The Astrophysical Journal, 554, 742–777.
- [63]
- [64] Hornschemeier, A.E., Brandt, W.N., Alexander, D.M., Bauer, F.E., Garmire, G.P., Schneider, D.P., Bautz, M.W. & Chartas, G. 2002 The Chandra Deep Field-North survey. VIII. X-ray constraints on spiral galaxies from . The Astrophysical Journal, in press (astro-ph/0110094).
- [65]
- [66] Jansen, F., et al. 2001 XMM-Newton observatory: I. The spacecraft and operations. Astronomy & Astrophysics, 365, L1–L6.
- [67]
- [68] Lehmann, I., et al. 2001 The ROSAT deep survey. VI. X-ray sources and optical identifications of the ultra deep survey. Astronomy & Astrophysics, 371, 833–857.
- [69]
- [70] Miyaji, T. & Griffiths, R.E. 2002 Faint-source counts from off-source fluctuation analysis on Chandra observations of the Hubble Deep Field-North. The Astrophysical Journal, 564, L5–L8.
- [71]
- [72] Mushotzky, R.F., Cowie, L.L., Barger, A.J. & Arnaud, K.A. 2000 Resolving the extragalactic hard X-ray background. Nature, 404, 459–464.
- [73]
- [74] Muxlow, T.W.B., Wilkinson, P.N., Richards, A.M.S., Kellermann, K.I., Richards, E.A. & Garrett, M.A. 1999 High-resolution imaging of the Hubble Deep and flanking fields. New Astronomy Reviews, 43, 623–627.
- [75]
- [76] Ptak, A., Griffiths, R., White, N. & Ghosh, P. 2001 The consequences of the cosmic star-formation rate: X-ray number counts. The Astrophysical Journal, 559, L91–L95.
- [77]
- [78] Richards, E.A., Kellermann, K.I., Fomalont, E.B., Windhorst, R.A. & Partridge, R.B. 1998 Radio emission from galaxies in the Hubble Deep Field. The Astronomical Journal, AJ, 116, 1039–1054.
- [79]
- [80] Richards, E.A., Fomalont, E.B., Kellermann, K.I., Windhorst, R.A., Partridge, R.B., Cowie, L.L. & Barger, A.J. 1999 Optically faint microjansky radio sources. The Astrophysical Journal, 526, L73–L76.
- [81]
- [82] Rosati, P., et al. 2002 The Chandra Deep Field South: The 1 million second exposure. The Astrophysical Journal, in press (astro-ph/0110452).
- [83]
- [84] Shapley, A., Fabbiano, G. & Eskridge, P.B. 2001 A multivariate statistical analysis of spiral galaxy luminosities. I. Data and results. The Astrophysical Journal Supplements, 137, 139–199.
- [85]
- [86] Vignali, C., Brandt, W.N., Fan, X., Gunn, J.E., Kaspi, S., Schneider, D.P. & Strauss, M.A. 2001 Exploratory Chandra observations of the highest-redshift quasars: X-rays from the dawn of the modern Universe. The Astronomical Journal, 122, 2143–2155.
- [87]
- [88] Waddington, I., Windhorst, R.A., Cohen, S.H., Partridge, R.B., Spinrad, H. & Stern, D. 1999 NICMOS imaging of the dusty microJanky radio source VLA J123642+621331 at . The Astrophysical Journal, 526, L77–L80.
- [89]
- [90] Weisskopf, M.C., Tananbaum, H.D., Van Speybroeck, L.P. & O’Dell, S.L. 2000 Chandra X-ray Observatory (CXO): overview. Proc. SPIE, 4012, 2–16.
- [91]