Spectroscopic Evidence for Starspots on the Secondary Star of SS Cygni
Abstract
Cataclysmic variables (CVs) are interacting binary systems where a cool, rapidly rotating secondary star passes material to a white dwarf. If this mass loss is to continue then there must be continuous angular momentum loss from the system. By analogy with the Sun and other cool stars, it has been assumed that magnetic braking is responsible, angular momentum being carried away by an ionised wind from the secondary star, threading a dynamo-generated magnetic field. We have discovered TiO absorption in the spectrum of SS Cyg, whose secondary star should be too hot to show such features. The most likely explanation of its presence is cool star spots caused by the strong (0.1T) fields required by the magnetic braking theories.
1 Introduction
Cool stars with a spectral type later than F5 (cooler than about 6500K) have convective outer layers, which when coupled with rotation, create a dynamo that amplifies magnetic fields and brings them to the stellar surface. Radial magnetic field lines trap the stellar wind, forcing it to co-rotate with the star out to large radii and removing angular momentum from the star. Weber & Davies (1967) first applied such a model to the solar angular momentum loss, and variants of their model can successfully explain the observed rotational spin-down of cool stars in open clusters of increasing age (Krishnamurthi et al., 1997; Bouvier et al., 1997; Tinker et al., 2000; Sills et al., 2000).
Low-mass secondary stars in cataclysmic variables (CVs) should exhibit strong (0.1-0.3T) magnetic fields since they have deep convection zones and are rapidly rotating as a result of being tidally locked with their companion. (Tidal interaction ensures that the secondary star is brought into synchronous rotation with the orbit.) The currently accepted hypothesis is that magnetic braking by the secondary star is responsible for removing angular momentum from the system, perpetuating the mass transfer (Verbunt & Zwaan, 1981; Rappaport et al., 1983). Magnetic braking is also crucial in the standard explanation for the dearth of CVs with orbital periods between 2 and 3 hours (the “period gap”). As CVs evolve towards shorter orbital periods the secondary star becomes less massive, until finally, at masses of 0.25M⊙ and periods around 3 hours, it should be fully convective (Robinson et al., 1981). At this point it is said that either magnetic activity may cease (Spruit & Ritter, 1983; Rappaport et al., 1983), or perhaps the magnetic field changes topology (Taam & Spruit, 1989), and thus magnetic braking becomes ineffectual. In turn, mass transfer will cease, and the secondary star, which is slightly bloated due to the effect of mass loss, shrinks to within its Roche-lobe. Gravitational radiation is now the only angular momentum loss mechanism, and only when the binary reaches a period of two hours does mass transfer begin again.
There are two worrying problems with this scenario. First that it relies on applying single star models to semi-detached binaries at somewhat shorter rotation periods. The danger of this assumption is underlined by the case of the W UMa binaries, whose magnetic fields are a factor of order four or five below those for analogous single stars (Stȩpień et al., 2001). The second problem is the lack of good observational evidence for magnetic fields in CV secondaries. Strong (0.1-0.3T) magnetic fields covering a large fraction of the stellar surface are well established in rapidly rotating single and binary G to M-type stars (e.g. Saar & Linsky, 1985). These fields can be detected directly by Zeeman splitting (Johns-Krull & Valenti, 1996) and inferred indirectly from the presence of cool starspots on the stellar surface, or from the non-radiative magnetic heating in outer atmospheres diagnosed by coronal X-ray emission (O’Neal et al., 1996; Haisch & Schmitt, 1996; Strassmeier & Rice, 1998). Applying these techniques to CVs is difficult, due in part to the variability of the accretion disc masking that of the secondary star, and in part due to their intrinsic faintness. There are, however, other indications that spots and/or magnetic activity may be present in CVs. Magnetic activity cycles are a plausible explanation for changes seen on timescales of decades in the overall brightness, inter-outburst periods and orbital periods of CVs. A critical account of these is given in Richman et al. (1994), and given that other explanations are possible, they do not amount to a strong case for magnetic activity. More convincing is to use starspots as an explanation for subtle differences in secondary star line strengths, either in comparison with single stars of similar spectral type, or as a function of orbital phase (e.g. Howell et al., 2000; Dhillon et al., 2002). However, there are always other possible explanations for these effects, including light from the accretion disc, or the peculiar evolutionary history of the secondary star. In summary, the evidence to date for magnetic activity in CV secondary stars amounts to using them as possible post-facto explanations of extant observational data. What is required is an observational test of a prediction based on the idea that the secondary stars have strong magnetic fields.
2 The technique
Starspots are the key to the technique we present here. Their presence can be deduced from rotational modulation of stellar brightness or more directly from Doppler imaging of the surfaces of rapidly rotating stars (e.g. Barnes et al., 2001). Donati & Collier Cameron (1997) have used Zeeman Doppler imaging to show that starspots do indeed coincide with regions of strong magnetic field, and starspots are now known to exist in both single cool stars and non-interacting binaries which have rotation periods from about 12 hours to a few weeks.
O’Neal et al. (1996) and O’Neal et al. (1998) have developed a new way to measure the spot area and temperature, which relies on a typical starspot being approximately 1000K cooler than the unspotted photosphere. The total spectrum from the star is then the flux-weighted mean from the spotted and unspotted areas. In particular, when one observes magnetically active K stars, molecular absorption features due to TiO are seen, which can only come from much cooler M-type atmospheres. By modeling the total spectrum as the sum of template K-type and M-type stars, an estimate of the spot area and temperature is recovered, assuming that the star is uniformly covered by spots. In this letter we present the first results using a similar method for a CV secondary star.
Although the application of this technique to CVs is straightforward in principle, there are observational complications which make it difficult in practice. First, unlike O’Neal et al. (1996), we cannot normalise the spectra such that the continuum flux is unity, as the presence of non-stellar components (e.g. the accretion disc) whose flux varies with wavelength, would make the relative fluxes in the lines incorrect. Thus we must flux our spectra, ensuring that the relative levels across the spectra are accurate to approximately one percent. It is well known that normal techniques can introduce problems at this level, and worse still the TiO bands are contaminated by absorption from the Earth’s atmosphere. However, preserving this flux information means that our fitting technique can utilize the overall continuum shape of the template spectra, in addition to the strengths and widths of the absorption lines. For the latter information to be useful, very high signal-to-noise spectra are required.
3 Observations and Results
We chose to investigate the 6.6 hour orbital period CV, SS Cygni. Since the secondary star in SS Cyg is an early K star (Harrison et al. (2000) and references therein), the mere detection of M-type TiO features would be a positive indication of spot activity on its surface. Four SS Cyg spectra totaling 24 mins exposure time were taken within 0.3 in phase of superior conjunction of the white dwarf (i.e. when the secondary star is at its closest to the Earth), using the Intermediate Dispersion Spectrograph on the 2.5m Isaac Newton Telescope. With the 1.6 arcsec slit used, the spectrograph yielded a resolution of 2.5Å. The spectra covered the wavelength range 6820-8190Å at a dispersion of 1.22Å per pixel. However, we only used the region 7000-7590Å, since this was well corrected for telluric absorption, and contains the TiO band of interest. The reduced spectra were shifted so that the spectral lines lay at their rest wavelength and added, using a weighted mean, to give a spectrum with a signal-to-noise of about 200. We also observed 35 single K and M stars to use as template spectra, which were also shifted so that the spectral lines lay at their rest wavelength positions. We ensured good relative flux calibration by observing an O or B-star close to each target, after the target had been observed. This hot star was itself fluxed (using data from flux standards), and the resulting spectrum (excluding telluric absorption bands) was fitted with a quadratic (a good approximation to the flux distribution of hot stars in this region of the spectrum), which removed any residual fluxing errors on scales of less than 300Å. We next divided the unfluxed spectrum of the target by the unfluxed spectrum of the O-star, thus removing the telluric absorption lines. Finally we multiplied this spectrum by the quadratic fit to the hot star spectrum to obtain a fluxed spectrum of the target.
Our mean SS Cyg spectrum is shown in Figure 1. There are two strong emission lines at 7065Å and 7280Å (both HeI), whose broadness implies they originate in the accretion disc. (They are broadened both by the rotation of the disc, and our shifting of the spectra into the rest frame of the secondary star.) The rest of the spectrum is a host of weak, rotationally broadened absorption lines from the secondary star. It is immediately evident, even without modeling, that there is a broad absorption trough between 7100Å and 7200Å, which is normally associated with TiO (although the bandhead itself, at 7055Å is obscured by an emission line). However, the secondary star in this CV is of spectral type early K (4800-5300K), and is thus too hot for TiO to exist in significant quantity. Indeed TiO only appears in stars of spectral type K7 and later, where the temperature is below 4300K. It would appear, therefore, that we are observing a K-type star, with cooler, M-type regions, which are presumably starspots.
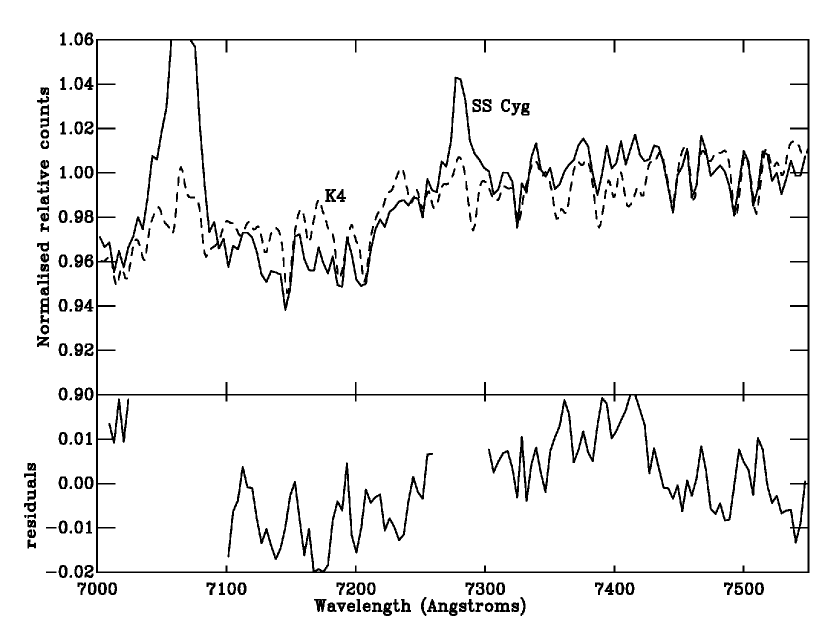
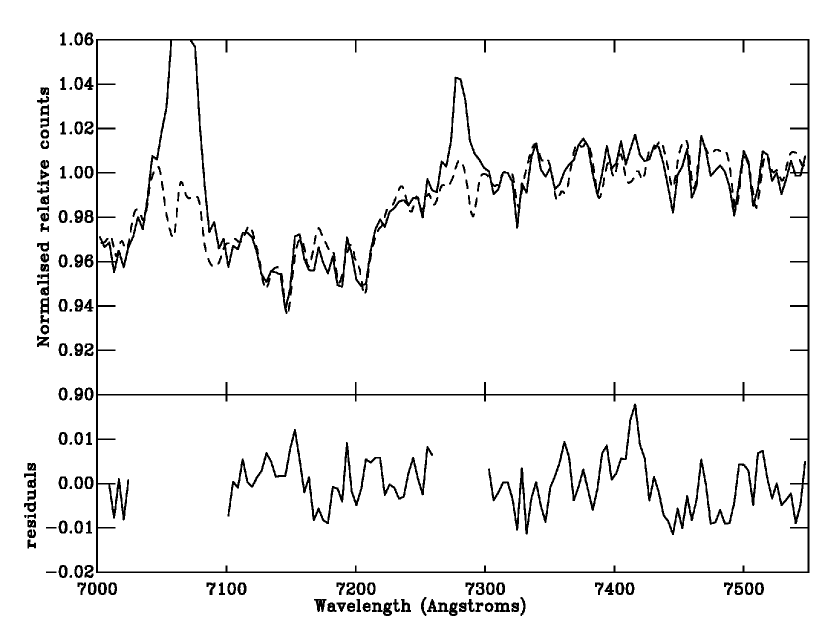
We modeled the mean SS Cyg spectrum using varying proportions of our template K and M, giant and dwarf stars, with the addition of a shallow quadratic to represent the non-stellar components. The spectral lines of the template stars were broadened to match the lines of SS Cyg which are rotationally broadened to about 90km s-1 (Martinez-Pias et al., 1994). We restricted the fit to the region 7000-7590Å, since it contained one TiO band and was well corrected for telluric absorption. To begin with we tried a fit which contained just one template star, and the quadratic (Figure 1). The best fitting spectral type was K4V. When we added a second star (Figure 2) fell by a factor of 2.6. (There were 126 degrees of freedom for the two star fit, which returned a of 3.9.) The two star model not only fits the area around TiO well, it also fits the region around 7400Å better than the single star model. This second fit gave spectral type of K4V (4800K) for the unspotted parts of the photosphere, and a spot spectral type M2V (3900K). The hemisphere we observed had approximately 22% of its area covered in spots. To assess the errors in these figures we fitted a two star model to the individual spectra which had been combined to create our mean SS Cyg spectrum. The resulting scatter implied our error is about a sub-type for both the “normal” and spotted spectral types. About 50% of the light was calculated to come from the secondary star. Surprisingly there was little variation in the implied spot coverage with changes in either the normal or spotted spectral type. This is because the fall in flux (as opposed to equivalent width) across the TiO bandhead changes very little with spectral type, when calculated per unit area of atmosphere. The fall in continuum flux being matched almost exactly by the increasing depth of the absorption. Using the data of Jones et al (1994) and Reid et al. (1995) we find a 10 percent change in the flux drop across the TiO bandhead between M2 and M4.
To prove the method does not have any propensity to introduce TiO features where there should not be any, we performed the same experiment on the known spotted star HD 82443. In this star the temperature of the unspotted areas is known to be 4925K, with a spot temperature of 4300K (Messina et al., 1999); thus this object should not show detectable TiO. We fitted the spectrum of this star in an identical fashion to SS Cyg, allowing both spectral types to run free. We found no evidence for TiO, and the fit returned a figure of less than 5% for the non-stellar contribution.
4 Caveats
The simplest explanation of our observations is that we have observed starspots on the surface of the secondary star in SS Cyg. However, there are three other obvious possibilities which should be considered: gravity darkening of the secondary star; a peculiar abundance pattern, or an effect caused by the non-stellar component.
To examine the possibility that gravity darkening may be responsible for the cooler region(s), we modeled a star with a pole temperature of 4800K, observed at an inclination of 60 degrees (probable for SS Cyg), using the code of Shahbaz et al (1993). Gravity darkening will have its greatest effect at phase 0.5, when the inner Lagrangian point is facing the observer. This was our reason for preferring to observe phases close to zero, but to ensure our modeling is conservative, we modeled phase 0.3, the closest that we observed to 0.5. We found that only four percent of the flux weighted area lay below the temperature of 4500K where TiO first becomes visible. Only if the TiO band depth at this and lower temperatures were 100 percent, could our observed depth of 4 percent be explained. In fact the depth at these temperatures is only a few percent.
Peculiar abundances are also unlikely to cause the observed effect. The problem is not merely changing the relative strengths of certain lines, but producing simultaneously the features of an early K star and TiO, which only occurs in cooler atmospheres. Modeling a range of abundance possibilities to prove this lies outside the scope of this letter, but to be credible, such modeling would have to be backed with an explanation as to why the star has the implied abundances.
Finally, could the subtraction of the non-stellar component cause the TiO features? Although the exact nature of the non-stellar component is controversial, it does seem to be smooth on scales of 1000Å and more (Harrison et al., 2000). Given that our residuals are also smooth, it seems that only if the non-stellar component itself has TiO could it explain our results.
5 Conclusions
Our conclusion is therefore that the most convincing explanation of our data is that starspots do exist on the surfaces of CV secondary stars. These are likely to be associated with equipartition magnetic fields of strength 0.1-0.3T. This puts the idea that magnetically controlled wind braking is responsible for CV evolution on a much firmer footing and opens the way for further studies of these magnetic fields in ways similar to those being pursued in rapidly rotating single stars. It also shows that magnetic fields and spot activity do not disappear at extremely high rotation rates, that are an order of magnitude faster than the claimed dynamo or angular momentum saturation threshold seen in the K stars of young open clusters (Stauffer et al., 1994). However, much crucial work still needs to be done, including establishing whether spots disappear at rotation periods of 2-3 hours, thus providing a natural explanation for the CV period-gap. CV secondaries at these periods are themselves M-type stars and so the mere detection of TiO bands will not be sufficient to prove the presence of starspots.
References
- Barnes et al. (2001) Barnes J.R., Collier-Cameron A., James D.J., Donati J.-F., 2001, MNRAS, 324, 231
- Bouvier et al. (1997) Bouvier J., Forestini M., Allain S., 1997, A&A, 326, 1023
- Dhillon et al. (2002) Dhillon V.S., Littlefair S.P., Marsh T.R., Sarna M., Boakes E., 2002, ApJ, accepted
- Donati & Collier Cameron (1997) Donati J-F., Collier Cameron A., 1997, MNRAS, 291, 1
- Haisch & Schmitt (1996) Haisch B.M., Schmitt J.H.M.M., 1996, PASP, 108, 113
- Howell et al. (2000) Howell S.B., Ciardi D.R., Dhillon V.S., Skidmore, W., 2000, ApJ530, 904
- Johns-Krull & Valenti (1996) Johns-Krull C.M., Valenti, J.A., 1996, ApJ, L95
- Jones et al (1994) Jones H.R.A., Longmore A.J., Jameson R.F., Mountain C.M., 1994, MNRAS, 267, 413
- Krishnamurthi et al. (1997) Krishnamurthi A., Pinsonneault M.H., Barnes S., Sofia S., 1997, ApJ, 480, 303
- Harrison et al. (2000) Harrison T.E., McNamara B.J., Szkody P., Gilliland R.L., 2000, AJ, 120, 2649
- Martinez-Pias et al. (1994) Martez-Pias I.G., Giovannelli F., Rossi, C., Gaudenzi S., 1994, A&A, 291, 455
- Messina et al. (1999) Messina S., Guinan E.F., Lanza A.F., Ambruster C., 1999, A&A, 347, 249
- O’Neal et al. (1996) O’Neal D., Saar S.H., Neff J.E., 1996, ApJ, 463, 766
- O’Neal et al. (1998) O’Neal D., Saar S.H., Neff J.E., 1998, ApJ, 501, L73
- Rappaport et al. (1983) Rappaport S., Joss P.C., Verbunt, F., 1983, ApJ, 275, 713
- Reid et al. (1995) Reid I.N., Hawley S.L., Gizis J.E., 1995, AJ, 110, 1838
- Richman et al. (1994) Richman H.R., Applegate J.H., Patterson J., 1994, ApJ, 106, 1075
- Robinson et al. (1981) Robinson E.L., Barker E.S., Cochran A.L., Cochran W.D., Nather R.E., 1981, ApJ, 251, 611
- Saar & Linsky (1985) Saar S.H., Linsky J.L., 1985, ApJ, 299, L47
- Shahbaz et al (1993) Shahbaz T., Naylor T., Charles P.A., 1993, MNRAS, 265, 655
- Sills et al. (2000) Sills A., Pinsonneault M.H., Terndrup D.M., 2000, ApJ, 534 335
- Spruit & Ritter (1983) Spruit H.C., Ritter H., 1983, A&A, 124, 267
- Stauffer et al. (1994) Stauffer J.R., Caillault J-P., Gange M., Prosser C.F., Hartmann L.W., 1994, ApJSS, 91, 625
- Stȩpień et al. (2001) Stȩpień K., Schmidtt J.H.M.M., Voges W., 2001, A&A, 370, 157
- Strassmeier & Rice (1998) Strassmeier K.G., Rice J.B., 1998, A&A, 330, 685
- Taam & Spruit (1989) Taam R.E., Spruit H.C., 1989, ApJ, 345, 972
- Tinker et al. (2000) Tinker J., Pinsonneault M., Terndrup D., 2002, ApJ, 564, 877
- Verbunt & Zwaan (1981) Verbunt F., Zwaan C., 1981, 100, L7
- Weber & Davies (1967) Weber E., Davis L.D., 1967, ApJ, 148, 217