email: gianni@na.astro.it 22institutetext: Università Federico II, Department of Physics, Napoli
Optical (VRI) Photometry in the Field of
the Galaxy Cluster AC 118 at z=0.31††thanks: Based on
observations collected at European Southern Observatory
(ESO n. 62.O-0369, 63.O-0257, 64.O-0236)
We present new photometric V-, R- and I-band data for the rich galaxy cluster AC 118 at . The new photometry covers an area of 8.68.6 arcmin2, corresponding to 2.92.9 Mpc2 (H km s-1 Mpc-1, q and ). The data have been collected for a project aimed at studying galaxy evolution through the color-magnitude relation and the fundamental plane. We provide a catalogue including all the sources () detected in the cluster field. The galaxy sample is complete to mag (), mag () and mag (). We give aperture magnitudes within a fixed aperture of 4.4 arcsec and Kron magnitudes. We also give photometric redshifts for 459 sources for which additional U- and K-band photometry is available. We derive and discuss the V- and R-band luminosity functions. The catalogue, which is distributed in electronic form, is intended as a tool for studies in galaxy evolution.
Key Words.:
Galaxies: clusters: individual: AC 118 – Galaxies: photometry – Galaxies: fundamental parameters (magnitudes, colors) – Galaxies: luminosity function1 Introduction
Rich galaxy clusters are the optimal laboratory to study the evolution of galaxies because they can be identified over a wide range of redshifts, thus allowing to study the properties of homogeneous classes of galaxies as a function of cosmic time. Rich clusters are also the tracers of the evolution of cosmic structures and serve to set constraints on the initial spectrum of density fluctuation.
AC 118 (also Abell 2744) is a rich (‘Coma-like’) galaxy cluster at redshift and is one of the most widely studied clusters at intermediate redshifts. The first photometric (Couch & Newell 1984) and spectroscopic (Couch & Sharples 1987) data collected for this cluster exhibited a significant excess of blue galaxies with respect to local clusters (the Butcher-Oelmer effect, Butcher & Oelmer 1978a, 1978b, 1984). Couch & Sharples (1987) compared the distribution of the galaxy population of AC 118 with the morphological segregation in the Coma cluster, and suggested that the blue galaxies in AC 118 likely represent the progenitors of the local S0 galaxies.
The star formation in AC 118 was studied by Barger et al. (BAE96 (1996)) who found that a significant fraction of galaxies experimented secondary bursts of star formation in the last Gyr. Furthermore, since the HST image indicates that a high portion of the star forming galaxies show signs of interaction, they suggested that merging phenomena of individual galaxies are responsible of these recent hints of star formation and that this may be consistent with the hierarchical merging scenario.
AC 118 was also included in the sample of high-redshift clusters of Stanford et al. (SED98 (1998)) who have shown that the color-magnitude relations for AC 118 as well as for all the other clusters is consistent with a passive evolution of stellar populations formed at early cosmic epochs. This result, however, is not in contrast with the findings of Barger et al. (BAE96 (1996)), because of the different sample selections. It has to be noticed, in this respect, that samples constituted of morphologically selected early-type galaxies (as in Stanford et al. 1998) are affected by the ‘progenitor bias’ (see van Dokkum & Franx 2001), and always lead to conclude that early-type galaxies are old. The passive evolution scenario is also supported by the trend with the redshift of the K-band luminosity function, as was shown by de Propris et al. (1999). Couch et al. (CBS98 (1998)) pointed out that the facts may be much more involved than in the above schemes. From a detailed morphological and spectroscopic study of three clusters at z=0.31 (AC 118, AC 103 and AC 114), they draw the conclusion that several different processes drive galaxy evolution and that a significant fraction of galaxies in a rich cluster undergo morphological changes. The same conclusion was reached by Jones et al. (2000), who claimed that the S0 galaxies at the redshift of AC 118 are remnants of early-type spirals that had star formation truncated by interaction with the cluster environment (see also Adami et al. 1998; Poggianti et al. 1999).
AC 118 has been the subject of several studies at different wavelengths, from radio to X-ray (see for instance Andreani et al. 1996; Smail et al. 1997; Allen 1998, 2000; Govoni et al. 2001). The general picture describes this cluster as an assembling of different systems, with a dynamical activity suggested by a peculiar velocity distribution with two different peaks (Girardi & Mezzetti 2001), and by the strong discrepancy between the masses derived from X-ray observations and from gravitational lensing (Allen 1998). Finally, AC 118 will be one main target in the first operations of the Advanced Camera for Surveys of HST.
This paper presents new photometric data for AC 118 based on ESO-NTT imaging in the R, V and I wavebands. These data were collected in the framework of a project aimed at studying the structural properties of the cluster galaxies (Busarello et al. 2002; La Barbera et al. 2002), the color-magnitude relation (Merluzzi et al. 2002) and at deriving the fundamental plane. In this paper we also determine the photometric redshifts and briefly discuss the V and R luminosity functions. The paper is organized as follows. Sect. 2 includes a description of the data and of the data reduction and photometric calibration. In Sect. 3 we describe the aperture photometry. Sect. 4 deals with the determination of the photometric redshifts. The photometric catalogue is presented in Sect. 5, while the catalogue itself is available in electronic form only. In Sect. 6 we shortly discuss the V and R luminosity functions, and in Sect. 7 we give a summary of the paper. In this work we assume H km s-1 Mpc-1, q and .
2 Observations, Data Reduction and Photometric Calibration
The observations were carried out at the ESO New Technology Telescope with the EMMI instrument during three runs (October 1998, October 1999 and September 2000). A field of (2.92.9 Mpc) was observed in V-, R- and I-bands towards the galaxy cluster AC 118. The total integration time, the pixel scale, and the average seeing for each band are given in Table 1.
The data reduction was performed with the MIDAS and IRAF packages. Bias and flat-field corrections were achieved by the standard procedures. For the V- and R-bands the flat-field was obtained by combining twilight and dome flats, while for the I-band only the dome flat was used. In order to add the different exposures and to reject cosmic rays we used the IRAF task IMCOMBINE with the CRREJECT algorithm. The final images presented a uniform background with fluctuations smaller than 2% of the mean value.
The photometric calibration was performed into the Johnson–Kron–Cousins photometric system. Since the sky conditions were not photometric during the observations, we could not use comparison standard fields, but we proceeded as follows.
For the R-band, we used the aperture photometry for sources in the cluster area provided to us by A. Stanford (see Stanford et al. SED98 (1998), hereafter SED98). Instrumental magnitudes within an aperture of the same diameter ( ) as in SED98 were derived from our image by using the SExtractor software (Bertin Arnouts 1996) and were compared with the magnitudes of SED98. Since the FWHM of the SED98 images was , no seeing correction was applied for the matching with our data. The accuracy on the zero point was derived by adding in quadrature the uncertainty on the offset between the two sets of magnitudes with the uncertainty on the photometric calibration of SED98. The total uncertainty on the zero point amounts to 0.03 mag (1 standard interval).
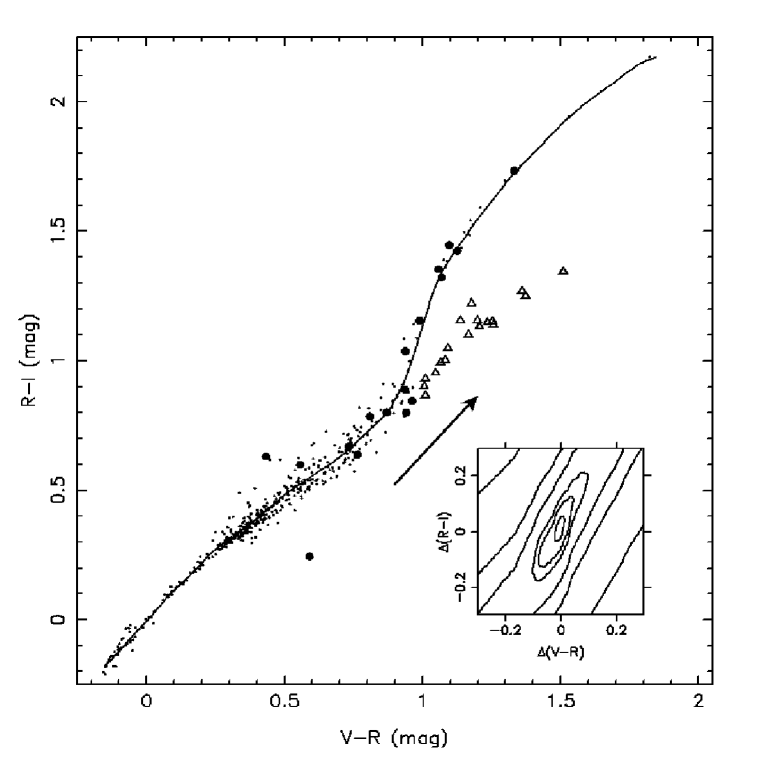
For the V- and I-bands, the photometric calibration was performed by matching the colors of stars in the NTT images with the colors of the stars from the catalogue of Landolt (1992). We proceeded as illustrated in Fig. 1. The distribution of the Landolt stars in the (V-R, R-I) diagram was described by a smooth curve. Some stars were not considered since they do not lie in the same locus of the other Landolt stars due to their high galactic extinction (, see Schlegel et al. 1998). We verified that our curve agrees with the curve of Caldwell et al. (1993). The and colors of the stars in the NTT images, where and are the instrumental magnitudes, were fitted to the smooth curve and the computed shifts were added to the zero point of the R-band image.
The accuracies on the zero points were estimated by taking into account 1) the presence of a possible color term in the calibration, 2) the uncertainty on the fitting solution and 3) the uncertainty on the R-band photometric calibration. To estimate the first source of uncertainty, we subtracted to the colors of the Landolt stars the color term in the equations of the EMMI Calibration Plan 111See http://www.ls.eso.org/lasilla/Telescopes/NEWNTT/EMMI/ and estimated the change of the fitting solution. The second source of uncertainty was estimated by the bootstrap technique taking into account the uncertainties on the instrumental magnitudes. The uncertainties on the colors of the Landolt stars were not considered, since their effect on the computation of the smooth curve turned out to be negligible. The uncertainties on the zero points are summarized in Table 2. Since the uncertainty on the R-band zero point turned out to be the major source of error, we neglected the correlation between and introduced by the fitting procedure.
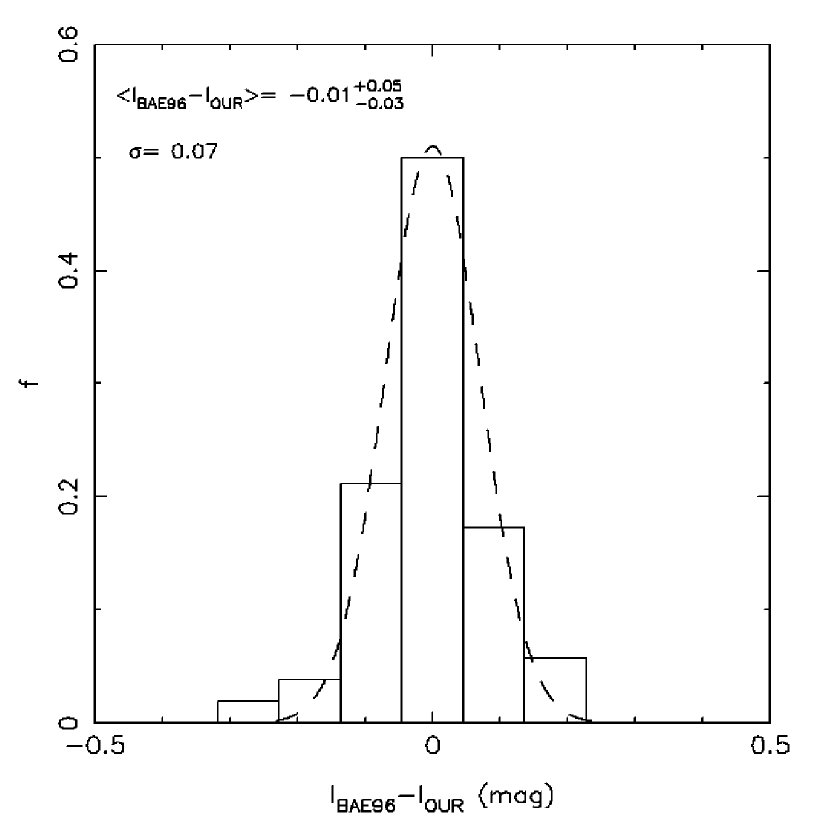
To check the method used for the photometric calibration, we compared our photometry with the magnitudes in the I-band of Barger et al. BAE96 (1996) (hereafter BAE96). The comparison is shown in Fig. 2. The difference between the two sets of magnitudes is fully consistent with zero within the estimated uncertainty on the I-band zero point. The dispersion amounts to 0.07 mag, in agreement with the various sources of uncertainty.
3 Aperture Photometry
A photometric catalogue was derived for each image by the software SExtractor (Bertin Arnouts BER96 (1996)). For each object we measured the magnitude within a fixed aperture of diameter , corresponding to 25 kpc at , and the Kron magnitude (Kron 1980), for which an adaptive aperture is used with diameter equal to , where is the Kron radius and is a constant. Following Bertin Arnouts (BER96 (1996)), we chose , for which it is expected that the Kron magnitude encloses of the total flux of the source. The uncertainties on the magnitudes were obtained by adding in quadrature the uncertainties estimated by SExtractor with the uncertainties on the zero points.
The completeness of the optical catalogues was estimated following the method of Garilli et al. (GAR99 (1999)) that consists in the determination of the magnitude at which the objects start to be lost since they are below the brightness threshold in the detection cell. To estimate the completeness limit, the magnitudes in the detection cell were computed and compared to the magnitudes in the fixed aperture. The comparisons are shown in Fig. 3, where the vertical lines correspond to the detection threshold and the horizontal lines mark the completeness limit which takes into account the scatter of the relation. The completeness magnitudes are reported in Table 2.

4 The photometric redshifts
The optical V-, R- and I-band photometry, together with available data in the U- and K-band was used to determine the cluster membership of the sources in the photometric catalogue by the photometric redshift technique. AC 118 was observed in the U-band by BAE96 at the ESO-NTT on August 1993. The images were retrieved from the ESO NTT Science Archive and reduced following the standard procedures. For the photometric calibration we used the aperture magnitudes given in BAE96 (see their Table 4). The K-band observations have been performed at ESO-NTT with the SOFI instrument. The K-band photometry consists of a total integration of 4 hours over a single SOFI pointing of which, because of the jittering, covers a field of (the reduction of the SOFI image is described in Andreon 2001). The UVRIK catalogues were cross-correlated, resulting in a final list of sources detected in at least one optical band. The photometric redshifts were derived for the objects with photometry available in all the wavebands.
We estimated the photometric redshifts according to the Spectral Energy Distribution fitting method (see Massarotti et al. 2001a, b, and references therein). Redshifts are obtained by comparing observed galaxy fluxes, at the –th photometric band, with a library of reference fluxes, , depending on redshift and on a suitable set of parameters , that account for galaxy morphological type, age, metallicity, etc.
We looked for redshifts in the range with a step of 0.01, and introduced a further constraint in the fit by imposing that the age of the best template cannot be older than the age of the universe at the selected redshift according to the adopted cosmology. Model galaxy spectra are provided by the code of Bruzual & Charlot (BRC93 (1993)). The adopted templates consist of models with a Scalo (1986) IMF and with SFR histories of the form to match different Hubble type colors as a function of time. Choosing Gyr, we obtain at Gyr colors of , , and that match those of nearby galaxies. Template spectra evolution is followed in the time interval Gyr. To allow for different metallicities of early-type galaxies we introduced templates for with 0.2, 0.4, 1 and 2.5.
The distribution of photometric redshifts is shown in Fig. 4. The distribution is dominated by the peak around the cluster redshift , indicating that most of the galaxies in the field are actually members of AC 118. The FWHM of the peak is determined by the intrinsic redshift distribution of the cluster members and on the errors on photometric redshifts.

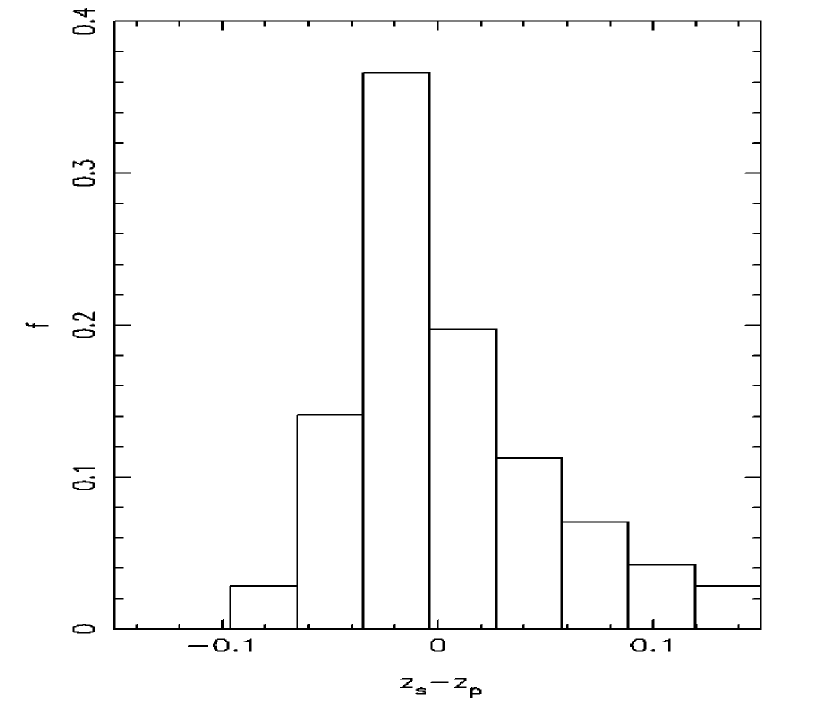
To gain insight on the precision of the redshift estimates, we compare in Fig. 5 photometric () and spectroscopic () redshifts for galaxies in a bright sub–sample of the cross-correlated catalogue (see Couch & Sharples 1987; Busarello et al. 2002, in preparation). We found that the mean difference of photometric and spectroscopic redshifts is consistent with zero and that the dispersion amounts to 0.04. We notice that of the spectroscopically confirmed cluster members are found in the range . On the other hand, since galaxies in the spectroscopic sample represent the bright tail of the cross-correlated catalogue, the comparison of and does not inform on the amplitude of the error due to photometric uncertainties for the intermediate and faint galaxy population. In order to analyze the role of measurement errors on the redshift estimates, we performed numerical simulations to generate N=500 copies of the cross-correlated catalogue, obtained by adding to each galaxy flux a number randomly extracted from the gaussian function of the photometric uncertainty In this way, we associated to each galaxy a distribution of N=500 simulated redshifts () and calculated the 68% percentile interval () around the median value of the distribution. Finally we defined a galaxy as a cluster member if the interval overlaps the range . In the cross-correlated catalogue N= 329 galaxies (i.e. 72% of the total) turned out to satisfy this selection criterion.
5 Description of the Catalogue
The photometric quantities relative to the sources in the
V-, R- and I-band images are included in the catalogue, a portion of which
is shown in Table 3222
The whole catalogue will be available in electronic form at the Centre de
Données astronomiques de Strasbourg: http://cdsweb.u-strasbg.fr/
. The sample consists in all the objects
detected in at least band, that are brighter than the detection limit.
When an object is not detected, the corresponding
columns in the table are filled with dots. The table is organized as follows.
Column 1: running number in the present catalogue.
Columns 2, 3: right ascension and declination (2000).
The astrometric solution was computed by using a list of stars
from the USNO catalogue. The root mean square of the residuals to
the astrometric solution amounts to 0.18 arcsec.
Columns 4, 5: V-band magnitude within the aperture of
diameter and corresponding uncertainty.
Columns 6, 7: the same quantities as in columns 4, 5 for the R-band.
Columns 8, 9: the same quantities as in columns 4, 5 for the I-band.
Columns 10, 11: Kron magnitude in the V-band and corresponding
uncertainty.
Columns 12, 13: the same quantities as in columns 10, 11 for the R-band.
Columns 14, 15: the same quantities as in columns 10, 11 for the I-band.
Columns 16, 17, 18: Kron radius in arcsec for the V-, R- and I-band
respectively. When the Kron radius is smaller than 3.5 pixels, an aperture
with this diameter, that correspond to , is adopted.
Column 19: stellar index. When available for more than one image, we report
the value relative to the image with the best seeing.
Column 20: photometric redshift. The upper and lower values correspond
to percentile intervals of (see Sect. 4.3).
6 R- and V-band Luminosity Functions
To obtain the cluster R and V luminosity functions (LFs) we did not make use of the cluster membership information derived from the photometric redshifts, but instead we statistically subtracted the background contribution in each band. In this way all the photometric data up to the magnitude limit can be used in each band. We did not derive the LF in the I-band because the relative data are not deep enough to estimate the slope of the LF faint end. The background counts were provided to us by S. Arnouts in R- and V-band from the ESO–Sculptor Survey (Arnouts et al. 1997). This survey, 1.53∘(R.A.)0.24∘(Dec) wide, was carried out in a region of sky close to the AC 118 field and with the same instrument. The reduction of those data was performed by using the same software packages and following an analogue procedure as in the present work. In particular, in both works the photometric catalogues were obtained by means of the SExtractor software and the total magnitudes, considered for the galaxy counts, were estimated with the Kron magnitude defined by adopting the same adaptive aperture.
The errors on the cluster LFs were computed by taking into account Poissonian fluctuations of counts along the cluster line of sight and of the background counts. Since the field of view of our observation is times smaller than the area covered by the ESO–Sculptor Survey, the errors on the cluster LFs are dominated by Poissonian errors of counts along the cluster line of sight. For this reason we did not include in the error budget the term of the background fluctuations due to the galaxy correlation function.
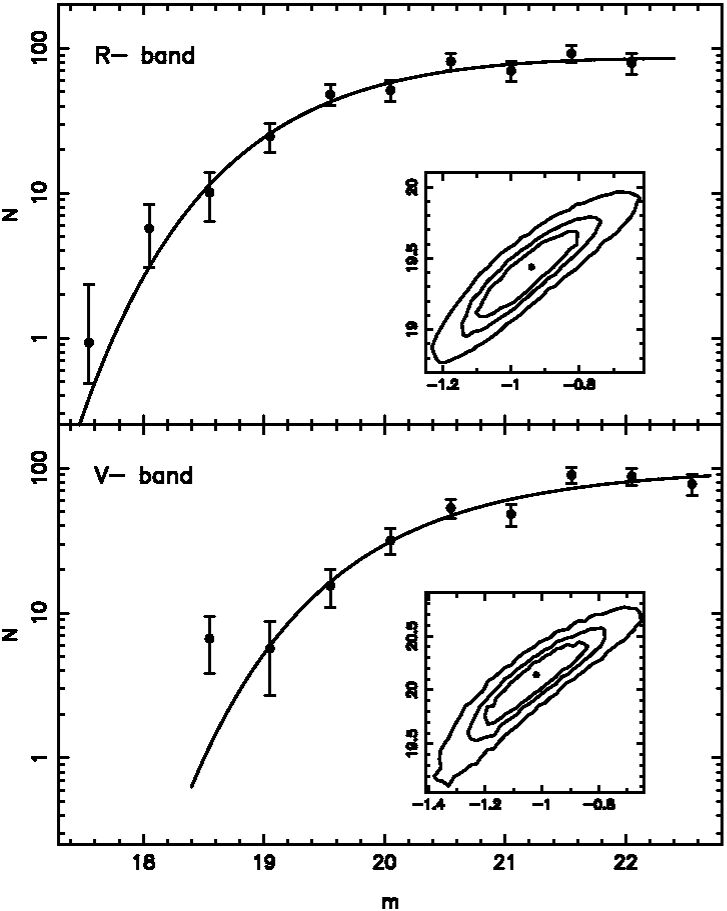
We modeled the cluster LFs with a weighted parametric fit of the Schechter function, obtaining as best–fit parameters: and , and (the errors correspond to 1 interval). Fig. 6 shows the cluster LFs respectively in R-band (upper panel) and V-band (lower panel), with the confidence levels of the best–fit parameters. The best–fitting Schechter functions are also plotted.
Andreon (2001) derived the K-band LF in AC 118. On the whole K-band field of , he found: and . Taking into account the uncertainties on the parameter (see our Fig. 6 and Fig. 9 of Andreon 2001), we conclude that , and are in agreement (within the errors), that is the faint end slope of the AC 118 LF does not depend significantly on the waveband. Choosing we obtain and , in agreement with the position of the bright tail of the galaxy population in the relative colour–magnitude planes (Merluzzi et al. 2002; Merluzzi et al. 2002, in preparation).
7 Summary
New accurate photometry has been presented for the galaxy cluster AC 118 at redshift . The new data cover an area of 8.68.6 arcmin2, corresponding to 2.92.9 Mpc2. The data reduction and the method used for the photometric calibration are described in detail. For the R-band, the image zero-point is derived by using aperture photometry by SED98, while for the V- and I-band the photometric calibration is performed by matching the colors of the stars in the cluster field with those of the stars from the catalogue by Landolt (1992). The accuracies on the zero-points amount to mag.
For each band, we derive magnitudes within a fixed aperture of diameter 4.4′′ and Kron (adaptive) magnitudes. The catalogue is complete up to mag, mag and mag, and includes, respectively, 574, 649 and 419 galaxies brighter than these limits.
The cross-correlated catalogue includes celestial coordinates, fixed aperture and Kron magnitudes, and Kron radii of sources detected in at least one band. The catalogue is available in electronic form. For the sources with additional U- and K-band photometry, we also obtain a redshift estimate by applying the photometric redshift technique.
The V- and R-band photometry have been used to derive the optical luminosity function of the cluster AC 118. The best-fit Schechter parameters are and , and . Comparing these values with the results obtained by Andreon (2001) for the K-band LF of AC 118, we conclude that the faint end slope of the cluster LF does not depend on the waveband, while the waveband dependence of is consistent with pure passive evolution of the stellar populations of the bright cluster galaxies.
Acknowledgements.
We are grateful to Adam Stanford who provided us with his own photometry of AC 118, that was used for the calibration of our R-band data and to Stephane Arnouts who provided us with the galaxy counts used to derive the cluster LFs. We thank S. Zaggia for helpful discussions. We thank the referee A. Mazure for his helpful comments. The observations at ESO were collected during the NTT guaranteed time of the Osservatorio Astronomico di Capodimonte. The U-band photometry is based on data from the ESO NTT Science Archive. Michele Massarotti is partly supported by a MURST-COFIN grant.References
- (1) Allen, S.W., 1998, MNRAS 296, 362
- (2) Allen, S.W., 2000, MNRAS 315, 269
- (3) Adami, C., Biviano, & A., Mazure, A., 1998, A&A 331, 439
- (4) Andreani, P., Pizzo, L., Dall’Oglio, G., et al., 1996, ApJ 459, L49
- (5) Andreon, S., 2001, ApJ 547, 623
- (6) Arnouts, S., de Lapparent, V., Mathez, G., et al., 1997, A&AS 124, 163
- (7) Barger, A.J., Aragón-Salamaca, A., Ellis, R.S., et al., 1996, MNRAS 279, 1 (BAE96)
- (8) Bertin, E., & Arnouts, S., 1996, A&AS 117, 393
- (9) Busarello, G., Merluzzi, P., Massarotti, M., La Barbera, F., & Theureau, 2002, in ASP Conf. Ser., in press (astro-ph/0110329)
- (10) Bruzual, G.A., & Charlot, S., 1993, ApJ 405, 538
- (11) Butcher, H., & Oemler, A., 1978a, ApJ 219, 18
- (12) Butcher, H., & Oemler, A., 1978b, ApJ 226, 559
- (13) Butcher, H., & Oemler, A., 1984, ApJ 285, 426
- (14) Caldwell, J.A.R., Cousins, A.W.J., Ahlers, C.C., van Wamelen,P., & Maritz, E.J., 1993, S.A.A.O. Circulars 15, 1
- (15) Couch, W.J., & Newell, E.B., 1984, ApJS 56, 143
- (16) Couch, W.J., & Sharples, R.M., 1987, MNRAS 229, 423
- (17) Couch, W.J., Barger, A. J., Smail, I., Ellis, R.S., & Sharples, R.M., 1998, ApJ 497, 188
- (18) de Propris, R., Stanford, S.A., Eisenhardt, P.R., Dickinson, M., & Elston, R., 1999, AJ 118, 719
- (19) Garilli, B., Maccagni, D., & Andreon, S., 1999, A&A 342, 408
- (20) Girardi, M., & Mezzetti, M., 2001, ApJ 548, 79
- (21) Govoni, F., Enßlin. T.A., Feretti, L., & Giovannini, G., 2001, A&A 369, 441
- (22) Jones, L., Smail, I., & Couch, W.J., 2000, ApJ 528, 118
- (23) Kron, R.G., 1980, ApJS 43, 305
- (24) La Barbera, F., Busarello, G., Merluzzi, P., Massarotti, M., & Capaccioli, M., 2002, ApJ in press, (astro-ph/0112040)
- (25) Landolt, A.U., 1992, AJ 104, 340
- (26) Massarotti, M., Iovino, A., & Buzzoni, A., 2001a, A&A 368, 74
- (27) Massarotti, M., Iovino, A., Buzzoni, A., & Valls-Gabaud, D., 2001b, A&A 380, 425
- (28) Merluzzi, P., Busarello, G., Massarotti, M., & La Barbera, F., 2002, in ASP Conf. Ser., in press (astro-ph/0110328)
- (29) Poggianti, B.M., Dresseler, A., Couch, W.J., et al., 1999, ApJ 518, 576
- (30) Scalo, J.M., 1986, Fundamentals of Cosmic Physics 11, 1
- (31) Schlegel, D. J., Finkbeiner, D. P., & Davis, M., 1998, ApJ 500, 525
- (32) Smail, I., Ellis, R.S., Dressler, A., et al., 1997, ApJ 479, 70
- (33) Stanford, S.A., Eisenhardt, P.R.M., & Dickinson, M., 1998, ApJ 492, 461 (SED98)
- (34) van Dokkum, P.G., & Franx, M., 2001, ApJ 553, 90