Modeling Stellar Populations in Star Clusters and Galaxies
Abstract
Combining population synthesis models with simple Montecarlo simulations of stochastic effects in the number of stars occupying sparsely populated stellar evolutionary phases in the HRD, I show that the scatter observed in the photometric magnitudes and colors of LMC and NGC 7252 star clusters can be understood in the framework of current stellar evolution theory. The use of a high resolution stellar spectral atlas in population synthesis models improves considerably the quality of the fits to observed galaxy SEDs, making the assignment of a spectroscopic age to stellar populations more reliable than with low spectral resolution models.
Combinando modelos de síntesis de poblaciones estelares con simulaciones Montecarlo de los efectos estocásticos en el número de estrellas que ocupan estadios evolutivos escasamente poblados en el DHR, se concluye que la dispersión observada en la magnitud y colores fotométricos de cúmulos estelares en la NGM y NGC 7252 pueden entenderse en el marco de la teoría actual de evolución estelar. El uso de bibliotecas de espectros estelares de alta resolución en los modelos de síntesis de poblaciones mejora considerablemente la calidad de los ajustes a las distribuciones espectrales de energía observadas, y permite asignar edades espectroscópicas a poblaciones estelares con mayor confiabilidad que con los modelos de baja resolución espectral.
keywords:
galaxies: evolution, galaxies: stellar populations0.1 Introduction
Evolutionary population synthesis has become an important tool to study the stellar population content and its evolution over cosmological time scales in star cluster and galaxies. Bruzual (2001, 2002a) has presented a detailed description of the population synthesis technique, including main results, comparison with observations, and sources of uncertainties. For reasons of space, in this paper I include a very brief summary of population synthesis and an update on recent developments since the previous papers. References to complementary work are provided.
0.2 Population Synthesis
The current theory of stellar evolution makes detailed predictions concerning the time dependence of the bolometric luminosity and effective temperature of a star of a given mass and chemical composition. Complete sets of evolutionary tracks for stars of a wide mass range and various initial metal contents covering all significant stellar phases are available in the literature (e.g. Fagotto et al. 1994a, b, c; Girardi et al. 2000). Assuming an initial mass function (IMF, e.g. Salpeter 1955), we can compute the number of stars of a given mass born at time zero, and then follow the evolution of this population in the HRD using a specific set of evolutionary tracks. Knowledge of the spectral energy distribution (SED) at each position in the HRD visited by the stars during their evolution, allows us to compute the integrated SED for this initial-burst or simple stellar population (SSP) as a function of time. By means of a convolution integral (Bruzual & Charlot 1993) the evolution of the SED can be computed for an arbitrary star formation rate (SFR) and a chemical enrichment law.
0.3 Stellar Libraries
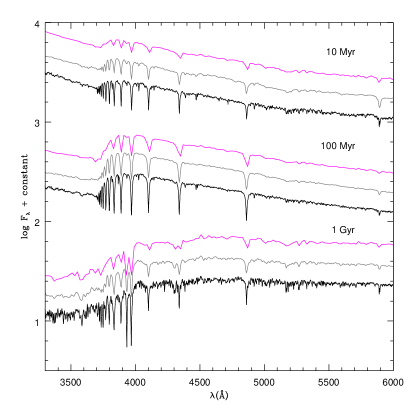
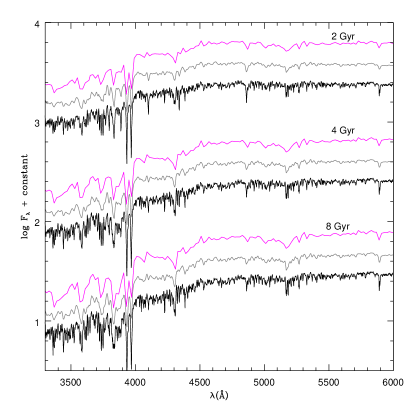
Several stellar spectral libraries for solar metallicity () stars are currently available. The Pickles (1998) atlas provides good coverage of the HRD for stars of this metallicity at medium spectral resolution. Le Borgne et al. (2002) have compiled an equally comprehensive atlas at 3Å spectral resolution (1Å sampling) which is complete for stars of solar metallicity, but includes a large number of spectra of non-solar metallicity stars. On the theoretical side, the compilations by Lejeune et al. (1997, 1998) and Westera et al. (2002) provide libraries of model atmospheres for stars of various metallicities but at 20Å spectral resolution. The last two libraries are largely based on the Kurucz (1995) series of model stellar atmospheres. Figs 1 and 2 show the time evolution of the SED for a SSP model computed for these three stellar libraries in increasing order of spectral resolution. Throughout this paper I use the Salpeter (1955) IMF, and for the lower and upper mass limits of star formation, I assume and M⊙, respectively. The set of population synthesis models that use the Le Borgne et al. (2002) high resolution stellar spectral library will be discussed by Bruzual & Charlot (2002, BC02 hereafter). All the models shown in Figs 1 and 2 have the same behavior in what respects to integrated photometric properties of the stellar population, e.g. luminosity and color evolution. The highest resolution model reproduces in much greater detail the spectral features of integrated stellar populations, observed, for instance, with the high resolution spectrograph available in HST and in the new generation of ground based high performance large optical telescopes (Keck, VLT, Sloan). See for example Figs 1 and 2 of Bruzual (2002c) and §5 below.
0.4 Star Cluster Colors
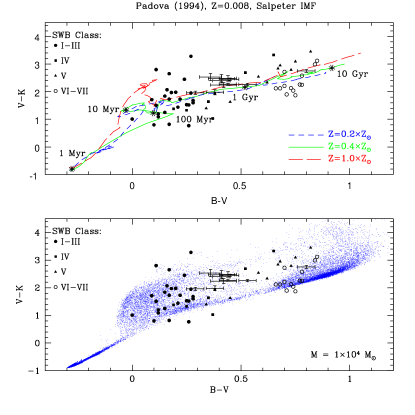
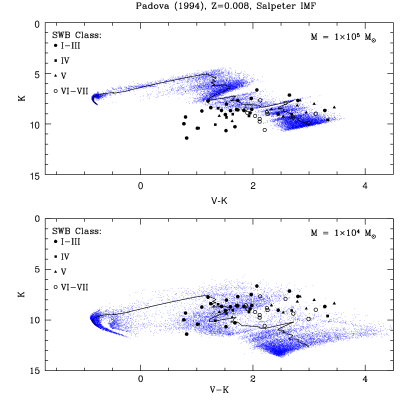
The differences between the observed integrated colors of star clusters and the colors predicted for simple stellar populations by population synthesis models are, in general, larger than allowed by observational errors. This is particularly true for intermediate age clusters in optical-IR colors, like , but to a lesser extent the scatter is also large in . In Fig 3 I compare the observed and colors of LMC globular cluster (van den Bergh 1981; Persson et al. 1983, respectively) and the star clusters in NGC 7252 (Maraston et al. 2001) with model predictions. The lines in the top frame represent the evolution in this plane of BC02 SSP models computed using the Padova evolutionary tracks for , and (Fagotto et al. 1994a,b,c), the Salpeter (1955) IMF, and the Lejeune et al. (1997) stellar atlas. The * symbols along the line mark the model colors at the age indicated by the labels, and can be used to roughly date the clusters. The small dots in the bottom frame of Fig 3 indicate the and colors resulting from different simulations by Bruzual (2002b), who has followed the Santos & Frogel (1997) Montecarlo technique to show that these cluster colors are consistent with model colors, if stochastic fluctuations in the number of stars in sparsely populated evolutionary stages are properly included into the models. 100 simulations were run at each of 220 time steps or isochrones, obtained from the SSP model shown in the top frame of the figure. Each simulation was stopped when the total cluster mass (including dead stars) reached M⊙. The fluctuations in the colors become larger as the cluster mass decreases. The model with no fluctuations is equivalent to an infinite number of stars populating the IMF. The expected fluctuations in for a M⊙ cluster amount to almost 2 magnitudes, in close agreement with the range of colors observed at a given age, and is considerably broader than for the M⊙ case. At the intermediate ages the models are redder in than the analytic IMF model because of a larger number of AGB stars, which appear naturally as a consequence of stochastic fluctuations in the IMF. The region in this plane occupied by the observations and the cluster simulations overlap quite well. This comparison seems to favor a not very large mass for these clusters, if stochastic fluctuations are responsible of the color variations. This conclusion is supported by Fig 4 in which I plot (at the distance of the LMC) vs. . The region covered by the M⊙ cluster simulations matches the region covered by the observations very well. See Bruzual (2002b) and references therein for details and Cerviño et al. (2000) for another approach to this problem.
0.5 Modeling Galaxy SEDs
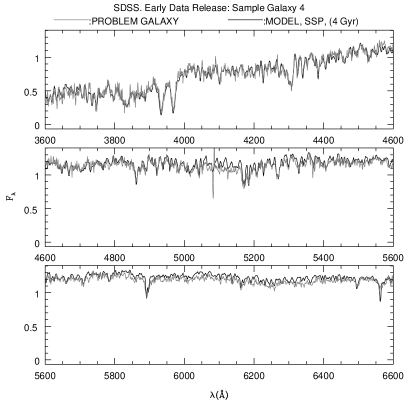
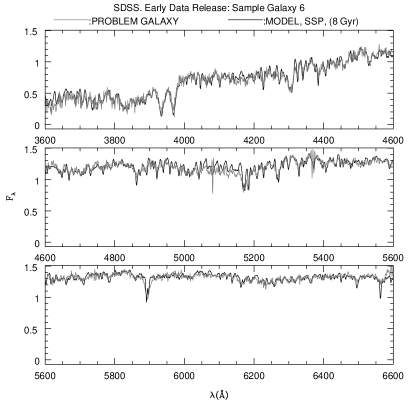
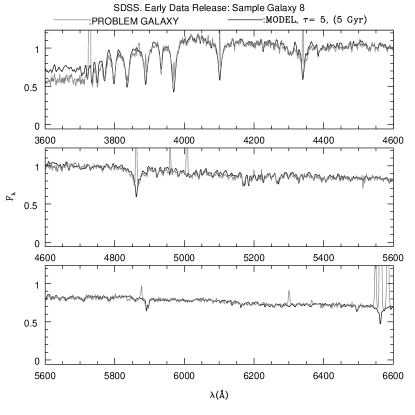
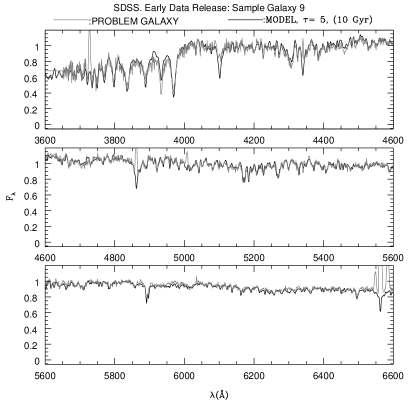
Using the BC02 models we can derive the spectroscopic age that characterizes a given observed SED. A model consists of a spectrum which evolves in time from age zero to 20 Gyr in 221 time steps. By minimizing , we derive for each problem SED the (spectroscopic) age at which the model matches more closely the observed spectrum. Figs 5 to 8 compare the observed SEDs of 4 galaxies in the SDSS early data release with the best fitting BC02 model SED. Figs 5 and 6 correspond to relatively old stellar populations, which are reproduced remarkably well by a SSP at age 4 and 8 Gyr, respectively. On the other hand, Figs 7 and 8 correspond to galaxies which are actively forming stars, as indicated by the emission lines seen in their SEDs. The nebular lines emitted by ionized gas surrounding hot stars are not included in the BC02 models (see Charlot & Longhetti 2001; Magris et al. 2002) but the fit to the continuum and the absorption lines in the observed spectra is otherwise excellent. By extending this analysis to intermediate and high redshift galaxies, Bruzual (2002c) has shown how the SEDs and/or multi band photometry of galaxies from to can be ordered in a plausible sequence, along which the spectra of galaxies may evolve when passive evolution dominates the evolution of simple stellar populations.
0.6 Discussion
In this paper I have briefly summarized the results of simple numerical simulations which show clearly how the range of colors observed in intermediate age star clusters can be understood on the basis of current stellar evolution theory, if we take into account properly the stochastic fluctuations expected in the number of stars occupying sparsely populated evolutionary stages in the HRD. There does not seem to be any need to introduce ad-hoc assumptions in population synthesis models, which translate into a departure from our current understanding of stellar evolution theory, in order to explain the observed range of values of cluster colors and magnitudes, as suggested by Maraston et al. (2001). The conclusion that cluster masses in the range around M⊙ are preferred, as well as the dependence of the amplitude of the fluctuations in the photometric magnitude and colors on this value of the cluster mass, should be explored in detail.
The use of a high resolution stellar spectral atlas in population synthesis models improves considerably the quality of the fits to observed galaxy SEDs, making the assignment of a spectroscopic age to stellar populations more reliable than with low spectral resolution models. The error in the age determination depends on the quality of the observational data and on the uncertainties in the population synthesis models. In general, the relative error in the spectroscopic age increases with decreasing galaxy age. As shown by Bruzual (2002c), it is possible to establish a plausible sequence along which the spectra of galaxies may evolve when passive evolution dominates the evolution of simple stellar populations, at a rate that is consistent with that expected in the most accepted cosmological model describing our universe, km s-1 Mpc-1, , , Gyr.
Work in progress suggests that the use of high resolution libraries for various metallicities will allow us to break the age-metallicity degeneracy and to derive a reliable star formation history from a galaxy SED (Mateu et al. 2002).
References
- [1] Bruzual A., G. 2001, Astrophys. & Space Science, 277 (Suppl.), 221
- [2] ———. 2002a, in Proceedings of the XI Canary Islands Winter School of Astrophysics on Galaxies at High Redshift, eds. I. Pérez-Fournon and F. Sánchez, Cambridge Contemporary Astrophysics, (in press). astro-ph/0011094
- [3] ———. 2002b, in Proceedings of the IAU Symposium No. 207 “Extragalactic Star Clusters”, eds. D. Geisler and E. Grebel, Astr. Soc. Pac. Conference Series, (in press). astro-ph/0110245
- [4] ———. 2002c, Rev. Mex. Física (in press). astro-ph/0202178
- [5] Bruzual A., G. & Charlot, S. 1993, ApJ, 405, 538
- [6] ———. 2002, ApJ, in preparation (BC02)
- [7] Cerviño, M., Luridiana, V. & Castander, F.J. 2000, A&A, 360, L5
- [8] Charlot, S., and Longhetti, M. 2001, MNRAS, 323, 887
- [9] Fagotto, F., Bressan, A., Bertelli, G., & Chiosi, C. 1994a, A&AS, 100, 647
- [10] ———. 1994b, A&AS, 104, 365
- [11] ———. 1994c, A&AS, 105, 29
- [12] Girardi, L., Bressan, A., Bertelli, G., & Chiosi, C. 2000, A&AS, 141, 371
- [13] Kurucz, R. 1995, private communication
- [14] Le Borgne, J.-F., et al. 2002, A&A, (in preparation)
- [15] Lejeune, T., Cuisinier, F., & Buser, R. 1997, A&AS, 125, 229
- [16] ———. 1998, A&AS, 130, 65
- [17] Magris C., G., Bruzual A., G., and Binette, L. 2002, ApJ, submitted
- [18] Maraston, C., Kissler-Patig, M., Brodie, J.P., Barmby, P., & Huchra, J.P. 2001, A&A, 370, 176
- [19] Mateu, J., Bruzual A., G., and Magris C., G. 2002, ApJ, in preparation
- [20] Persson, S.E., Aaronson, M., Cohen, J.G., Frogel, J.A. & Mathews, K. 1983, ApJ, 266, 105
- [21] Pickles, A.J. 1998, PASP, 110, 863
- [22] Salpeter, E.E. 1955, ApJ, 121, 161
- [23] Santos, Jr, J.F.C. & Frogel, J.A. 1997, ApJ, 479, 764
- [24] van den Bergh, S. 1981, A&AS, 46, 79
- [25] Westera, P., Lejeune, T., Buser, R., Cuisinier, F., & Bruzual A., G. 2002, A&A, 384, 524