Gas Dynamics in NGC 5248: Fueling a Circumnuclear Starburst Ring of Super Star Clusters
Abstract
Through observations and modeling, we demonstrate how the recently discovered large-scale bar in NGC 5248 generates spiral structure which extends from 10 kpc down to 100 pc, fuels star formation on progressively smaller scales, and drives disk evolution. Deep inside the bar, two massive molecular spirals cover nearly in azimuth, show streaming motions of 20–40 km s-1, and feed a starburst ring of super star clusters at 375 pc. They also connect to two narrow -band spirals which delineate the UV-bright star clusters in the ring. The data suggest that the -band spirals are young, and the starburst has been triggered by a bar-driven spiral density wave (SDW). The latter may even have propagated closer to the center where a second H ring and a dust spiral are found. The molecular and HST data support a scenario where stellar winds and supernovae efficiently clear out gas from dense star-forming regions on timescales less than a few Myrs. We have investigated the properties of massive CO spirals within the framework of bar-driven SDWs, incorporating the effect of gas self-gravity. We find good agreement between the model predictions and the observed morphology, kinematics, and pitch angle of the spirals. This combination of observations and modeling provides the best evidence to date for a strong dynamical coupling between the nuclear region and the surrounding disk. It also confirms that a low central mass concentration, which may be common in late-type galaxies, is particularly favorable to the propagation of a bar-driven gaseous SDW deep into the central region of the galaxy, whereas a large central mass concentration favors other processes, such as the formation and decoupling of nuclear bars.
1 Introduction
The level of activity and the rate of evolution in the circumnuclear region of galaxies depend to a large degree on dynamical processes which transport molecular gas. Stellar bars and other non-axisymmetries are destined to drive the gas towards the central kpc (Simkin, Su, & Schwarz 1980; Shlosman, Frank, & Begelman 1989; Athanassoula 1992). In some cases, stellar bars can be induced by tidal interactions (e.g., Noguchi 1988). The secular evolution of disk galaxies, therefore, proceeds in the direction of increasing central mass concentration in the baryonic material (e.g., Pfenniger 1996).
The dynamical and secular evolution in the central kpc, including stellar and non-stellar activities, depend on the degree of non-axisymmetry in this region. Strongly non-axisymmetric structures will increase the rate of evolution by facilitating the transfer of angular momentum and mass (e.g., Shlosman 2001). Observations of the central regions in barred galaxies provide clear evidence for non-axisymmetries such as nuclear spiral structure, triaxial bulges, and nuclear (secondary) bars (e.g., Laine et al. 1999a; Jogee, Kenney, & Smith 1999; Regan & Mulchaey 1999; Martini & Pogge 1999; Bureau 2002; Laine et al. 2002). Numerical simulations do reproduce much of this morphology, but fundamental issues remain, such as the state of the molecular gas in the central kpc, the formation and dynamical decoupling of nested bars, the stellar and gas dynamics in decoupled systems, and the interactions of bars with dark matter halos (e.g., Friedli & Martinet 1993; Jogee, Kenney, & Smith 1999; Maciejewski & Sparke 2000; Hüttemeister & Aalto 2001; Shlosman & Heller 2002; Athanassoula 2002; Shlosman 2002).
Both theory and observations reveal the importance of inner Lindblad resonances (ILRs) in slowing down the radial gas inflow within the inner kpc of barred galaxies (e.g., Schwarz 1984; Combes & Gerin 1985; Shlosman et al. 1989; Athanassoula 1992; Sofue 1991; Kenney et al. 1992; Knapen 1995a,b; Jogee 2001; Jogee et al. 2001). The resulting concentration of molecular gas leads to the formation of nuclear rings on scales of a few hundred pc (e.g., review by Buta & Combes 1996). These rings exhibit elevated rates of star formation (SF) due to the gas becoming gravitationally unstable (e.g., Elmegreen 1994; Knapen et al.1995b; Jogee 1999; Jogee et al. 2001), and are dynamically important (Heller & Shlosman 1996).
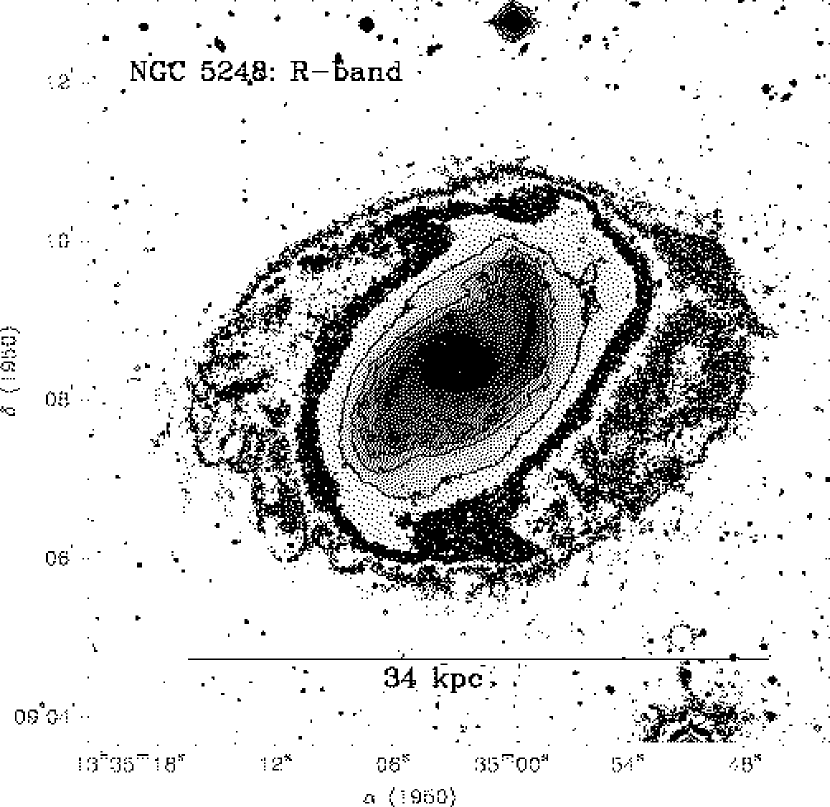
The nearby ( Mpc) grand-design spiral galaxy NGC 5248 is a great laboratory for investigating gas dynamics, barred and spiral morphologies, and their impact on circumnuclear SF. It shows spectacular grand-design spiral structure which extends over a large dynamic range in radius, from kpc to 100 pc, and winds through a large angle () in azimuth. NGC 5248, with a revised Hubble type SAB(rs)bc (de Vaucouleurs et al. 1991), was until recently considered to host a short bar with a semi-major axis of (1.6 kpc; Martin 1995), or even treated as unbarred (e.g., Patsis et al. 1997). However, Jogee et al. (2002, hereafter Paper I) have shown from a deep -band image (Fig. 1), as well as from dynamical and photometric analyses, that the spiral structure is being driven by an extended, moderately strong stellar bar which has a deprojected ellipticity of 0.44 and a semi-major axis of (7.1 kpc). The bar is embedded within a fainter outer disk which is visible out to a radius of (17.2 kpc). Previous optical and near-infrared (NIR) images did not have the sensitivity and/or field of view to clearly detect the outer disk, and therefore the outer region of the bar was mistaken for an inclined outer disk. The corotation radius () of the bar lies at (8.6 kpc), assuming the empirical relationship (Athanassoula 1992). Table 1 summarizes the parameters adopted for NGC 5248 in this paper. The inner kpc of the bar hosts a well known ring of “hot spots” (e.g., Buta & Crocker 1993; Kennicutt, Keel, & Blaha 1989; Elmegreen et al. 1997) which has been resolved into bright Hii regions and young super star clusters (SSCs) by HST broad-band, H, and Pa images (Maoz et al. 2001). Inside this ring resides a second nuclear H ring with a radius of (Laine et al. 2001; Maoz et al. 2001), and a nuclear dust spiral (Laine et al. 1999a) between (75 pc) and (300 pc).
High resolution observations of molecular gas can provide important constraints on the dynamics and evolution of the central regions in disk galaxies. Not only does the molecular gas fuel the ongoing SF, but its morphology and kinematics can also be a powerful tracer of non-axisymmetric features in the underlying galactic potential (e.g., Knapen et al. 1995b; Sakamoto et al. 1995; Jogee, Kenney, & Smith 1999; Knapen et al. 2000). We present new high resolution ( or pc) Owens Valley Radio Observatory (OVRO) CO (=1–0) observations of NGC 5248, and compare the data with Fabry-Perot H observations (Laine et al. 2001), optical and NIR broad-band images, archival HST images (Maoz et al. 2001), and theoretical models. The main sections in this paper are organized as follows. 2 outlines the observations and data reduction. 3 describes the stellar, dust, and gaseous grand-design spirals in NGC 5248. In 4, we present the CO and -band data, showing the striking molecular and young stellar spirals. We describe the CO kinematics and present the rotation curve of NGC 5248 in 5. In 6, we discuss evolution in the inner kpc of NGC 5248, addressing in particular the feeding of the starburst ring with cold molecular fuel, the local SF properties based on different tracers, and the interplay of the SSCs with the interstellar medium. In 7.1, estimates of the number and locations of the ILRs in NGC 5248 are presented. To account for the observed properties, the data are compared to new revised theoretical models in 7.2. In 8, we discuss the implications of this work for ISM redistribution and galaxy evolution.
2 Observations
2.1 CO interferometric observations
The central of NGC 5248 were observed in the redshifted CO (=1–0) transition at 114.83 GHz with the OVRO millimeter-wave array (Padin et al. 1991) between March 1999 and Feb. 2001. The array consists of six 10.4 m telescopes with a primary half power beam width of at 115 GHz. The galaxy was observed in five array configurations which range from compact to ultra-wide, and include projected baselines from 12 to 483 m. Data were obtained simultaneously with an analog continuum correlator of bandwidth 1 GHz and a digital spectrometer set-up which produced four independent modules that each have 32 channels with a velocity resolution of 5.2 km s-1. For our observations, the modules were partially overlapping and covered a total bandwidth of 240 MHz (600 km s-1) with 116 frequency channels. We corrected for temporal phase variations by interspersing integrations on the galaxy with observations of a phase calibrator, typically a quasar, every 20–25 minutes. Passbands were calibrated on the bright quasars 3C273, 3C84, and 3C345. The absolute flux scale was determined from observations of Uranus, Neptune, and 3C273, and has an accuracy of 20%. The passband and flux calibration of the data were carried out using the Owens Valley millimeter array software (Scoville et al. 1993). We used the NRAO AIPS software to map the calibrated data and to deconvolve the channel maps with the CLEAN algorithm and robust weighting as implemented in the AIPS task IMAGR. Primary beam correction was applied. The parameters of the channel maps are summarized in Table 2. Emission above the level is detected in 55 channels in the velocity range of 1012 to 1293 km s-1. We combined the cleaned channel maps showing emission to make moment 0, 1, and 2 maps which represent the total intensity, the intensity-weighted velocity field, and the velocity dispersion field, respectively. Maps with different Briggs robustness parameters ranging from -7 to 4 were made to allow for different weighting schemes that compromise between resolution and signal-to-noise. The maps discussed here contain a total flux of 385 20 Jy km s-1 over the central , corresponding to 85% of the single dish flux in the central (Young et al. 1995).
2.2 Near-infrared and optical data
We complement the CO observations with optical and NIR data which are summarized in Table 3. These include published archival HST broad-band and H+[Nii] images, TAURUS Fabry-Perot H data (Laine et al. 2001), and color maps. We also obtained images of NGC 5248 through the , , and filters.
NGC 5248 was imaged through the Harris -band filter for a total exposure time of 30 minutes using the Wide Field Camera on the 2.5 m Isaac Newton Telescope (INT) in La Palma in August 2001. The data frames had a plate scale of /pix, a field of view of , and an average seeing of . Bias-subtracted and flat-fielded frames were obtained from the INT data reduction pipeline. Sky-fringing at the 1% level is present, an effect known for the thinned EEV chip CCD4. We used the IRAF package for fixing bad pixels, cleaning cosmic rays, and convolving the frames to a common seeing before combining them into a final image. After masking out stars and faint background galaxies in the outer parts of the final image, isophotal analysis of the -band light was performed with the “isophote” package in IRAF. Details are presented in Paper I.
A -band image of NGC 5248, taken with the Prime Focus Camera on the 2.5 m Isaac Newton Telescope with a total exposure time of 20 minutes, was retrieved from the Isaac Newton Group archive. The image has pixels and a field of view of . We used the IRAF package in the standard way for data reduction. NGC 5248 was also imaged through the -short () filter for a total on-source exposure time of 12 minutes using the INGRID camera on the 4.2 m William Herschel Telescope. Seeing was . On-source frames were interspersed with off-source frames pointed on a nearby blank area of the sky for reliable sky subtraction. The final reduced images have pixels and a field of view. The data acquisition and reduction are described in more detail in Knapen et al. (in preparation).
3 The grand-design spirals in NGC 5248
NGC 5248 exhibits spectacular grand-design spiral structure in all disk components, namely gas, dust, and young stars. Spiral arms exist from 10 kpc to 100 pc and cover more than in azimuth, as illustrated by Figs. 1-7. The -band (Fig. 1) and -band (Fig. 2) images show two bright, relatively symmetric spirals which are particularly prominent on the leading edge of the large-scale stellar bar between and . These stellar spiral arms exhibit dust lanes on their inner (concave) side out to at least (Fig. 2 and Paper I), as expected inside the corotation resonance (CR). The offset between the dust and young stars is consistent with the view that shocks, seen as dust lanes along the leading edges of a moderately strong bar, compress gas to form massive young stars. SF in the bar of NGC 5248 is exceptionally strong, even in the NIR (Paper I). Patchy -band spirals (Fig. 3) accompany the -band spirals on the leading edge of the bar, and peaks in -band emission coincide with Hii regions in the large-scale H image. The strong SF along the moderately strong bar in NGC 5248 is consistent with the current understanding of gas flows and SF in bars. Namely, in strong bars which exhibit almost straight offset dust lanes believed to trace strong shocks, the strong shear in the postshock flow can inhibit SF (e.g., Athanassoula 1992). However, in weaker bars with curved offset dust lanes, the weaker shocks and shear can induce SF rather than inhibit it. For instance, the collapse of gas cores to form stars can be induced by weak shocks with speeds of order 20–30 km s-1 (e.g., Vanhala & Cameron 1998). M100 (e.g., Elmegreen et al. 1989; Knapen & Beckman 1996), NGC 2903 (e.g., Sheth 2001), NGC 4254, and NGC 4303 (e.g., Koopmann 1997) are but a few examples of systems with significant SF along a weak bar. While in many strongly barred galaxies optical spiral arms are prominent outside the bar but not within it, NGC 5248 illustrates how intense SF along a fairly weak bar can lead to conspicuous open spiral arms within the bar itself.
The -band spirals cross the bar major-axis around where the bar ends. This radius likely denotes the location of the ultraharmonic resonance where large-scale bars tend to end due to the onset of chaos and orbital instabilities. Secondary faint spirals stem off the bar and become particularly prominent from to . These may be related to secondary compression zones which arise near CR (e.g., Buta 1984). Between and , very faint spirals extend away from the bar end and cover – in azimuth (Fig. 1) in the faint outer disk. The outer Lindblad resonance (OLR), where spiral arms are expected to end, is probably around .
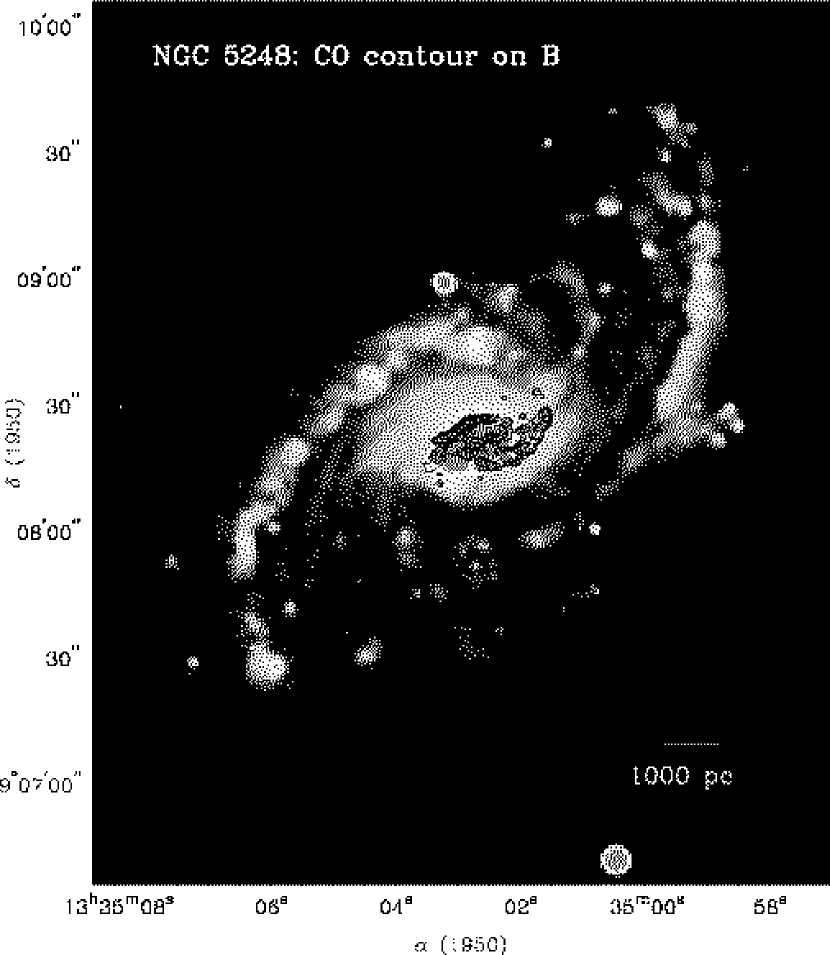
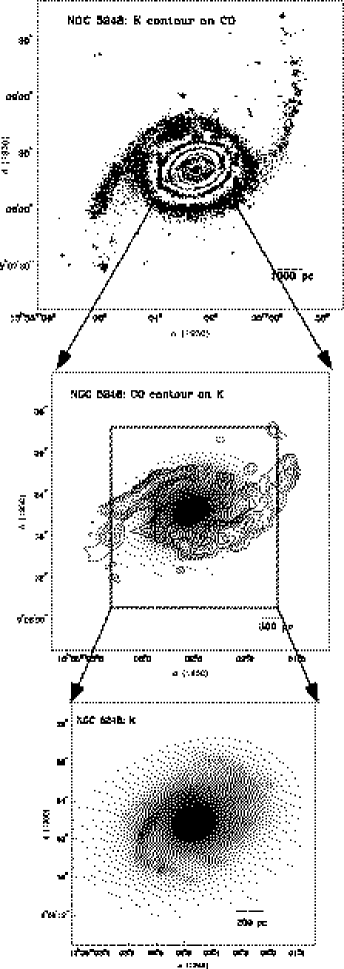
The spiral structure in NGC 5248 not only extends out to large radii, but also continues towards the central regions of the bar in three components, namely gas, dust, and young stars. The -band (Fig. 1), -band (Fig. 2), -band (Fig. 3), and (Fig. 4a) spirals can be readily followed from to where they cross the bar major axis. Interior to this point, the continuity in spiral structure is especially noticeable in the dust spirals revealed by the (Fig. 4a) and (Fig. 4b; see also Pérez-Ramírez et al. 2000) color maps. The dust spirals appear continuous from to , and cover nearly another in azimuth between and before they join a circumnuclear starburst ring. The CO (1–0) maps described in 4 show that the dust spirals are associated with two massive molecular spiral arms which cover at least in azimuth between and (Fig. 5) and then connect to the starburst ring of Hii regions (Fig. 6) and UV-bright SSCs (Fig. 7). It is not entirely clear if the -band spirals extend continuously from to as do the dust spirals: faint patches of -band emission can be seen along the western molecular spiral between and , and at two striking bright inner -band spirals (Fig. 8) connect to the molecular spirals. The narrow southern -band spiral is particularly conspicuous. The -band spirals continue from 600 pc to (225 pc), and delineate the UV-bright SSCs as they cross the starburst ring (Figs. 7 and 8). Interior to the starburst ring an adaptive optics color map reveals a grand-design nuclear dust spiral (Fig. 9) which can be traced from (300 pc) down to about (75 pc; Laine et al. 1999a). This dust spiral appears to bridge the -band spirals and the second nuclear H ring of radius 95 pc where double peaks of CO emission can be seen ( 4). To account for the observed morphology, the data will be compared to theoretical models in 7, after a closer look at the molecular gas and SF properties in 4–6.
4 The circumnuclear CO and -band morphology
The OVRO CO (1–0) total intensity map (Fig. 4) has a significantly better resolution ( or pc) than the previously published ( or pc) Nobeyama Millimeter Array (NMA) map (Sakamoto et al. 1999). This high resolution map emphasizes the strongest features and may miss some of the fainter diffuse emission. Several striking features can be identified. Two relatively bisymmetric trailing CO spiral arms can be followed from a radius of (1.5 kpc) to (375 pc). The arms, also visible in the NMA map, are now resolved into multiple clumps with sizes of to (150–300 pc) and masses in the range of several times 106–107 M☉, comparable to giant molecular associations (e.g, Vogel, Kulkarni, & Scoville 1988). The CO arms connect to the circumnuclear starburst ring of Hii regions (Fig. 6) and SSCs (Fig. 7) at a radius of . Inside this ring resides a double-peaked CO feature labeled F1 in Fig. 5. Its two CO peaks lie partially on the inner nuclear H ring of radius (95 pc) and are crossed by the arms of the grand-design nuclear dust spiral (Fig. 9; Laine et al. 1999a). Fainter CO emission is present in the starburst ring, northwest and southeast of the CO peaks. It is unclear if the apparent bridges between the faint CO emission and the two massive CO arms or the CO feature F1 are real or simply the result of beam-smearing.
The massive CO arms are associated with prominent dust spirals (Fig. 4b) delineating shocks. These dust spirals form part of a continuous grand-design spiral which can be followed from to at least and crosses the bar major-axis at . The image of resolution (Fig. 8) shows some faint patches of emission along the western CO arm between and and two bright inner spirals which connect to the CO arms around . The -band arms cross the starburst ring while delineating the UV-bright SSCs (Fig. 8). The association between the southern -band arm and the SSCs labeled SC11, SC12, SC13, and SC14 in Fig. 7 is particularly striking. The emission peaks in the -band arms are likely to be dominated by very young supergiants, 8–10 Myr old, which are often present in young star-forming regions (e.g., Leitherer & Heckman 1995). The presence of such a young stellar population in the -band arms is consistent with the study of Maoz et al. (2001) who estimate, from spectral synthesis, an age of 10–40 Myr for most of the bright SSCs. A young age for the -band arms is also suggested by the narrow width of (110 pc) of the eastern -band arm. For an assumed stellar velocity dispersion of 10 km s-1, this width suggests an age of order 10–20 Myr for the arms. Taken together, the morphology of the CO arms, dust spirals, young -band arms, and SSCs suggests that SF in the starburst ring has been triggered by a bar-driven density wave.
The -band arms are located just outside a very weak oval feature of radius (Fig. 8). This feature has a deprojected ellipticity of 0.1–0.2 at a position angle (PA) of –, slightly offset from the estimated PA of the line of nodes (Fig. 10a and Paper I). This feature could be a disk-like component, a late-type bulge, or an unresolved nuclear bar. Interestingly, the grand-design nuclear dust spiral (Fig. 9) which continues from to appears to bridge the end of the -band arms around and the nuclear H ring of radius . The dust spiral also crosses the two CO peaks of feature F1. At the current resolution, it is not clear whether the CO peaks of F1 are part of a molecular spiral associated with the dust spiral or whether they are associated with a molecular ring coincident with the inner H ring.
We computed the mass of molecular hydrogen in our CO (1–0) maps using the relation (Kenney & Young 1989; Scoville & Sanders 1987):
| (1) |
where D is the distance in Mpc, is the integrated line flux in Jy km s-1 and is the CO–H2 conversion factor. The value of in the inner Galaxy, namely H2 cm-2 K (km s-1)-1 (Bloemen et al. 1986), is generally referred to as the “standard” value. For an assumed standard value of the conversion factor, the two CO spiral arms host a total of M☉ of molecular hydrogen, while the CO feature F1 hosts M☉. Including the contribution of helium and heavier elements for a solar metallicity (Z=0.02, X=0.72, Y=0.26), gives a molecular gas content of M☉ and M☉, respectively. We estimate the enclosed dynamical mass using the circular rotation curve described in 5. In the central (1.5 kpc) radius molecular gas makes up 11% of the enclosed dynamical mass ( M☉). Within the central (375 pc) radius, the CO feature F1 makes up 7% of the dynamical mass ( M☉). Our mass estimates suffer from the usual caveats of assuming a standard value for the conversion factor. One may justifiably question this assumption since the conversion factor may depend on many parameters such as the dust column density, the ambient radiation field, the physical conditions in the gas, the optical thickness of the line, and the metallicity of the gas. These parameters could potentially show significant variations between different regions of galaxies. Furthermore, multiple-line studies and radiative transfer models (Wall & Jaffe 1990; Wild et al. 1992; Helfer & Blitz 1993; Aalto et al. 1995) have suggested lower values of in the centers of some starburst galaxies. However, several mitigating factors may help reduce deviations of the conversion factor from the standard value in the central region of NGC 5248. While circumnuclear star-forming regions very likely have higher temperatures and densities than Milky Way clouds, the effects of elevated temperatures and densities may partially cancel each other since depends on (/) for clouds in virial equilibrium (e.g., Scoville & Sanders 1987; Solomon et al. 1987), where is the CO brightness temperature averaged over the cloud and is the density. Furthermore, most of the CO emission in NGC 5248 is not associated with the ring of Hii regions and SSCs ( 6) where the radiation field from young stars might heat up the gas significantly. As far as metallicity is concerned, the circumnuclear region of an Sbc spiral such as NGC 5248 is likely to have a metallicity of at least solar, like most massive spirals (e.g., Vila-Costas & Edmunds 1992). Over this regime of metallicity, the CO line is likely optically thick, and we expect at most a weak dependence of the CO–H2 conversion factor on metallicity (e.g., Elmegreen 1989).
5 The molecular gas kinematics
Fig. 11a shows the intensity-weighted CO velocity field of NGC 5248. The spectral resolution is 5.2 km s-1. The position angle of the line of nodes () determined from the outer disk in the -band image (Paper I) is marked. The isovelocity contours deviate from a typical “spider diagram” which characterizes purely circular velocity fields. Non-circular streaming motions are especially visible in the CO arms where the isovelocity contours show significant curvatures. Non-circular motions are also apparent in the faint CO emission which lies around the two CO peaks of feature F1, near the ring of SF. In fact, the regions of non-circular motions are intersected by the inner -band spiral arms as they extend from to , crossing the starburst ring.
At any general point, the line of sight velocity is a superposition of circular motions (), azimuthal streaming motions (), and radial streaming motions () in the plane, as well as velocities () out of the plane. It is particularly instructive to look at position–velocity (p–v) cuts along the kinematic minor and major axes of the galaxy, where the components and , respectively, tend to zero. The p–v cut along the optical minor () axis is shown in Fig. 11b. At a distance of to along the minor axis, where the p–v cut crosses the CO arms, the velocities to the NE and SW show, respectively, blueshifts and redshifts of 15–25 km s-1 with respect to the systemic velocity (1153 km s-1). These velocities correspond to local radial streaming motions () of (15–25/sin ) km s-1 or 25–40 km s-1, if we assume the optical minor axis is close to the kinematic minor axis, and the out-of-plane component of velocity is negligible. The radial streaming motions correspond to inflow if we assume the NE side of the galactic disk is the far side – an orientation justified at the end of this section. We caution, however, that local radial inflow motions do not directly translate into a net inflow rate (see 6).
The p–v cut (Fig. 11c) along the galaxy major axis or line of nodes () first crosses the innermost part of the double peaked CO feature F1, and then intersects the two CO arms. In the inner regions where we expect the rotation curve to be steeply rising, the p–v diagram shows a turnover velocity of (115/sin ) km s-1 at a radius. This corresponds to 179 km s-1 for a revised inclination of adopted from Paper I. Between and along the major axis, there is a dip in the mean CO velocity and an increase in the CO linewidth. This happens when the p–v cut first intersects the CO arms (Fig. 11a). The curvatures in the isovelocity contours at that location suggest that the kinematic behavior in Fig. 11c results from non-circular azimuthal streaming motions. Further out, from to along the major axis the p–v cut crosses the two CO arms, and the line-of-sight velocity rises by about 40 km s-1. Again, the strong curvatures in the isovelocity contours (Fig. 11b) suggest this rise is in large part due to non-circular streaming motions.
Fabry-Perot H observations of NGC 5248 with a spectral resolution of 20.0 km s-1 have been presented by Laine et al. (2001). They derive a best-fit model “circular” velocity in the central by minimizing the residual velocity difference between the observed Fabry-Perot H velocity field and the model velocities. In the presence of strong non-circular motions, the best-fit circular velocity derived using this method is still contaminated by non-circular components. Their best-fit circular rotation curve derived assuming a line of nodes of and an inclination of is shown on Fig. 12. The Fabry-Perot H circular velocity of (117/sin ) km s-1 at a radius is consistent with the CO velocity of (115/sin ) km s-1 at that location. Around –, the H velocity field shows residual non-circular motions of 30 km s-1 to the northeast, and 15 to 20 km s-1 to the south and west. These non-circular motions occur near the intersection point of the -band arms and CO arms with the starburst ring.
CO (1–0) observations with a lower resolution (–) but a larger field of view () have been carried out with the Berkeley Illinois Maryland Array (BIMA), as part of the Survey of Nearby Galaxies (SONG; Regan et al. 2001). The data (Das et al. in prep.) show molecular gas along the large-scale bar out to , as well as in the circumnuclear regions. A best-fit “circular” rotation curve derived from the BIMA data was kindly provided to us by M. Das prior to publication. It was derived with a technique of minimizing residuals, similar to the method applied by Laine et al. (2001) to the Fabry-Perot H data. It suffers, therefore, from the same caveats of possible contamination by non-circular motions. We used the high resolution Fabry-Perot H and OVRO CO (1–0) “circular” rotation curve from 0 to , and the BIMA data of lower resolution from to to derive an overall rotation curve from the center to . This is shown in Fig. 12 where values are already corrected for an assumed inclination of . We did a cubic spline fit to interpolate between data points. The turnover velocity of (117/sin ) or 182 km s-1 at a radius is visible. Based on the above discussions of Fig. 11c, we suspect that the dip in velocity from to , as well as the 40 km s-1 rise in velocity from to , are largely caused by non-circular motions.
Finally, we justify the assumption made earlier that the NE side of the disk is the far side. The stars in the disk must be rotating in a clockwise sense if the large-scale stellar spiral arms are trailing, as is commonly the case with large-scale spirals. We can also infer a clockwise sense of rotation for the stars from the following line of arguments. If we start on the bar major axis and move in a clockwise sense, we first cross the dust lanes on the leading edge of the bar, then the quasi-coincident H, -band, and -band spirals (Paper I). This suggests that shocks, which we see as dust lanes along the leading edges of the bar, compress the gas to form massive young stars which move clockwise faster than the pattern speed, and lead to the spirals made of young stars a little further away. Such offsets between dust, gas, and stars have also been seen in observations of spiral arms in disks (e.g., Allen, Atherton, & Tilanus 1986; Tilanus & Allen 1989; Tilanus & Allen 1991). If the gas in the central region is rotating clockwise like the stars, then the blueshifts and redshifts on the NW and SE side of the major axis, respectively (Fig. 11a) imply that the NE side of the disk is the far side. This orientation is consistent with the dust lanes in the map (Fig. 4b) being redder on the western side than on the eastern side.
6 Evolution in the inner kpc of NGC 5248
We now take a closer look at evolution in the inner kpc of NGC 5248 using the information synthesized from our high resolution CO (1–0), , and observations, along with published images (Maoz et al. 2001). In particular, we focus here on the question of feeding the starburst ring with cold molecular fuel, the local SF properties, and the interplay of the SSCs with the interstellar medium.
The integrated H+[Nii] luminosity in the inner kpc radius of NGC 5248, after an extinction correction based on a dust screen model, is ergs s-1 (Maoz et al. 2001). It corresponds to a current SFR of 2.1 yr-1, assuming an extended Miller-Scalo IMF, stellar masses from 0.1 to 100 , and a case B recombination. The true SFR could be higher if there is heavy internal extinction within the Hii regions, but its upper limit is constrained by the global SFR of 3.2 yr-1, estimated for the entire galaxy. The latter rate is derived from the total far infrared luminosity and low resolution radio continuum data, following the prescription of Condon (1992). Table 4 summarizes SFR estimates based on different tracers. Our estimate of 2.1 yr-1 is also consistent with other circumnuclear properties. An average massive SFR of order 0.5 yr-1 or a total average SFR of 1.5 yr-1 is suggested by the young age (10–40 Myr; Maoz et al. 2001) and total mass (several times 106 ; Maoz et al. 2001) of the optically-visible stellar clusters. The cluster ages are consistent with the age (8–10 Myr) of the -band arms delineating the brightest SSCs ( 4). A similar average circumnuclear SFR of 1.5 yr-1 was derived by Elmegreen et al. (1997) based on the ages and masses of “hot spots” estimated from lower resolution NIR data.
The H (Fig. 6) image shows that most of the H emission originates from the circumnuclear ring of Hii regions at a radius of and the nuclear H ring at a radius of . Although the CO arms contain most ( M☉) of the circumnuclear molecular gas, they show only patchy H (Fig. 5) and Pa (Maoz et al. 2001) emission. In fact, less than 10 % of the H flux within the inner kpc radius originates in the CO arms. In the western CO arm, H emission exists from to and from to , in the same regions where very faint -band emission is present ( 4). It is unlikely that the lack of optically-visible SF along the CO arms is caused only by extinction, since the Pa and images do not reveal significantly more emission. High resolution radio continuum observations, being relatively unaffected by dust, would have helped to address the question of obscured SF further. Unfortunately, the only existing high resolution () observations do not have enough sensitivity to detect any emission in the central (J. Wrobel & J. Condon; private communication). Thus, we have to consider the possibility that SF may be truly inhibited in the CO arms. One factor leading to this inhibition may be the shear induced by the non-circular kinematics in the CO arms ( 5). The situation is reminiscent of the inner few kpc of M100 where two massive trailing CO arms with strong streaming motions (e.g., Sakamoto et al. 1995) host a large amount ( ) of molecular gas, but have comparatively little star formation, below 1 yr-1 (e.g., Knapen et al. 1995b). A low SFR per unit mass of molecular gas is also seen in the extended gas with non-circular kinematics along the bar in NGC 4569 (Jogee 1999) and NGC 7479 (Laine et al. 1999b). Another possibility is that the local gas surface density in the CO arms of NGC 5248, though high ( pc-2), is still below the critical density required to trigger widespread SF along the arms (see 7.2 for a dynamical argument related to this point).
A more detailed look at the properties of the Hii regions and SSCs in relation to the molecular gas shows an interesting evolutionary effect. Table 5 lists several properties of emission-line complexes in NGC 5248, as derived by Maoz et al. (2001). For simplicity, we adopt the same identification numbers as used by these authors. The Hii regions are listed in Table 5 in order of decreasing extinction, as judged by the H+[Nii]/Pa flux ratio. A value of 10 corresponds to a case B recombination and no reddening, while values below 1 correspond to 3–4 magnitudes of foreground dust extinction. Most Hii regions in the starburst ring of NGC 5248 have intermediate values of 2–5, corresponding to an extinction of 1–2 magnitudes. The equivalent width of the Pa line (f (Pa)/fλ (1.6 )), listed in column 6, is a measure of the ratio of O stars to K and M giants and supergiants. It is of order 400 Å in the first few Myr and falls by 2 orders of magnitude within 10 Myr (Leitherer et al. 1999; Maoz et al. 2001) under the assumption of a single burst model whose SF rate (SFR) decays exponentially on a timescale of 1 Myr. While the Pa equivalent width cannot be used as a detailed tracer of age, it is very likely that complexes with very large Pa equivalent widths of 349–943 Å(such as 3, 4, 16, and 9) are on average younger than complexes with equivalent widths below 50 Å (e.g., 7, 19, 6, and 8).
The four emission-line complexes (3, 4, 16, and 9) with the largest extinction turn out to have large Pa equivalent widths (361–943 Å) indicative of a young stellar population a few Myr old, but they do not show any optically-visible continuum sources (Fig. 6). This suggests that the young stellar populations associated with these Hii regions are obscured at optical wavelengths by gas and dust. In strong support of this suggestion, we find that these Hii regions are located in the CO arms near bright CO peaks having local gas surface densities of 600–1500 pc-2. A similar avoidance between line-emitting regions and continuum sources has also been noted in the Antennae (Whitmore et al. 1999), NGC 2903 (Alonso-Herrero, Ryder, & Knapen 2001), and several starbursts (Buta et al. 2000). NGC 5248 also hosts many Hii regions (# 8, 14, 21, 12, 6, 17, 19, 7, 18, 20) with H+[Nii]/Pa flux ratios 3 and small Pa equivalent widths (25–90 Å). These Hii regions (Fig. 6) lie near UV-bright stellar clusters (Fig. 7), most of which have moderate extinction (0 AV 1 mag), masses of several 103 to 105 , and ages typically in the range 10–40 Myr (Maoz et al. 2001). The ionized gas is often distributed in the form of shells and bubbles which surround the young stellar clusters, similar to what is observed in NGC 1569 (Hunter et al. 2000), NGC 5253 (Strickland & Stevens 1999), and NGC 4214 (Maíz–Apellániz et al. 1999). This suggests that stellar winds and shocks from supernovae clear out the gas and dust. In support of this scenario, we find that in NGC 5248 most of these moderately extincted Hii regions and optically-visible SSCs are associated with low levels of CO emission (Figs. 6 and 7). Furthermore, we find that the molecular gas around the brightest complex of Hii regions (# 14) has a bubble morphology suggestive of an evacuated cavity (Fig. 6). Taken together, the distributions of molecular gas, ionized gas, and stellar clusters in NGC 5248 evoke a scenario where young star-forming regions form within dense gas complexes, and subsequent stellar winds and supernovae efficiently clear out the gas on timescales less than a few million years.
The origin of the CO and dust spirals will be discussed in 7 where we shall demonstrate that they lie well inside the outer ILR (OILR) of the bar. We discuss here the gas inflow rate from the CO arms into the star-forming ring at . The net inflow rate depends on the mass density profile and the vector sum of different velocity components at each radius. From a kinematic standpoint, the curvatures in the isovelocity contours, the local radial inflow streaming motions of 25–40 km s-1 along the kinematic minor axis, and the non-circular azimuthal streaming motions between to along the major axis () amply demonstrate that strong non-circular streaming motions exist in the CO arms. If one assumes an average mass density of 600 pc-2, a local radial velocity of 15 km s-1, and a width of 200 pc for each CO arm, the implied gas mass inflow rate along the CO arms is a few yr-1. This estimate provides an upper limit to the mass inflow rate from the CO arms into the star-forming ring because the gas flow is expected to diverge and form a ‘spray-type’ flow (see 7.2) after the CO arms cross the bar minor axis and approach the star-forming ring. As a result of the ‘spray-type’ flow, a significant fraction of the gas inflowing in one CO arm can overshoot the ring and enter the other arm, taking a longer time to reach the ring. The estimated upper limit of a few yr-1 for the gas mass inflow rate along the CO arms is comparable to the current SFR of 1–2 yr-1 in the starburst ring ( 6). Other estimates of the inflow rate can be made by calculating the gravitational torque exerted on the gas by the stars or by running tailored hydrodynamical simulations. These methods also carry large uncertainties as they depend on the exact shape of the underlying gravitational potential, as well on uncertain parameters such as the viscosity, bar pattern speed, sound speed, simplified approximations of multi-phase medium and SF feedback.
7 Gas dynamics in the central kpc of NGC 5248
7.1 Gas response and dynamical resonances
A barred potential is made up of different families of periodic stellar orbits, characterized by a (conserved) Jacobi energy, , a combination of energy and angular momentum (e.g., Binney & Tremaine 1987). The most important families are those aligned with the bar major axis (so-called orbits) or with its minor axis ( orbits) (Contopoulos & Papayannopoulos 1980). The family extends between the center and the bar’s corotation radius. The family appears between the center and the ILR if a single ILR exists, and between the inner and outer ILRs, if two ILRs exist. When orbits form, they are preferentially populated at each . Hence, the orientation of populated periodic orbits changes by at each resonance.
The abrupt change in orientation at each resonance is restricted to (collisionless) stellar orbits. The gas-populated orbits can change their orientation only gradually due to shocks induced by the finite gas pressure. Therefore, the gas response to bar torquing leads to the formation of large-scale offset shocks and a subsequent gas inflow, which slows down after crossing a resonance. This results in the formation of nuclear rings, each associated with a parent ILR. Generally, no one-to-one correspondence is expected between the existence of star-forming (i.e., blue) rings and ILRs, as rings can merge (Heller et al. 2001) and/or age, becoming devoid of star formation (Shlosman 1999; Erwin et al. 2001). Knapen et al. (1995b) and Shlosman (1996) have investigated locations of nuclear rings with respect to ILRs, concluding that the outer ILR is devoid of any pronounced SF because the associated ring sits well inside this resonance. The explanation to this phenomenon is closely tied to the rate of dissipation and the sound speed in the gas, as well as the bar strength which defines the shape of the orbits and controls which outermost orbits get populated. At the same time if an inner ILR (IILR) exists, the star-forming ring is positioned exactly at this resonance, due to the reversal of gravitational torques.
The exact locations and even the number of ILRs can be inferred reliably only from non-linear orbit analysis (e.g., Heller & Shlosman 1996) based on the knowledge of the galactic potential. In this paper, we use approximate methods which rely on SF morphology and isophote fitting. The first method relies on the properties of nuclear rings discussed above. The dominant circumnuclear ring at a radius of (375 pc) shows that NGC 5248 has at least one ILR. Whether this galaxy has a second ILR near , where the second inner H ring resides, is not entirely clear. In principle, the latter ring may not be tied to any dynamical resonance, but could represent a superbubble driven by a recent starburst event in the nucleus. However, there is no evidence of a bright young central cluster in NGC 5248 (D. Maoz 2001; private communication), and the bright background light from the bulge makes it hard to identify a faint central source. Hence, it is plausible that NGC 5248 hosts both an OILR and an IILR.
A complementary isophote fitting to the deprojected -band and (Fig. 10b) images also provides a guide to the location of the OILR. The isophotes change gradually from being oriented along the bar major axis around , to being perpendicular to the bar around . This gradual twist rather than an abrupt change in orientation results from the unusually prominent young spiral arms inside the bar corotation. The isophote fits provide some insight into locations of dominant and families of orbits, oriented parallel and perpendicular to the bar, respectively. Those corresponding to the outermost orbits cross the bar minor axis at and the bar major axis at . These locations can be taken as approximate positions of the OILR along the major and minor axes of the bar. The point P2’ in Fig. 13a and point P2 in Fig. 13b denote the approximate position of the OILR along the bar minor axis. The position of the OILR is further confirmed by the azimuthal twist of the stellar spirals arms by between the OILR and the CR, and an additional between the CR and the OLR (Fig. 1) The latter is estimated to lie around , at the edge of the outer disk where the spiral arms end ( 3). Furthermore, Laine et al. (2002) have analyzed a subsample of barred galaxies among 112 disks, concluding that the ratio of is about 0.06, where is taken along the bar major axis. For comparison, this ratio is 0.07 in NGC 5248, assuming = and = (Table 1).
To summarize, we discuss briefly three possibilities concerning the number of
ILRs in NGC 5248:
(i). One ILR: In this case, with the the ILR at around
(2 kpc), it is difficult to explain why the star-forming ring
at 375 pc lies so deep inside the resonance. NGC 5248, therefore,
would appear as an extreme case. Another limitation of this scenario is that it
does not provide an explanation for the inner H ring at 95 pc.
(ii). Two ILRs: In this case, the OILR is at 2 kpc
and the IILR at 95 pc. This option is attractive because as
required by numerical simulations, the OILR itself is devoid of pronounced SF,
there is an inner star-forming ring at the IILR, and an
outer ring at 375 pc between the ILRs. However, one
discrepancy is that in simulations, the IILR ring generally has more
prominent SF than the outer ring, while the converse would appear to hold
here.
(iii). Three ILRs: In this case, the OILR is at 2 kpc, the IILR at
375 pc, and the innermost resonance, hereafter OILR2, is
at 200 pc, outside the ring at 95 pc.
This option sets the more prominent ring with active SF, namely the 375 pc ring,
at the IILR. A combination of high-resolution
velocity fields and future detailed modeling can help distinguish between the
different possibilities. Meanwhile, for brevity, we shall work within the
framework of 2 to 3 ILRs, as these models avoid most of the controversies.
Aside from the morphology of H rings, kinematic properties can in principle constrain the number and location of ILRs. For a weak bar where the linear epicyclic approximation is (very roughly) tolerable, we can estimate the location of ILRs if we have a reliable measure of the angular speed and the epicyclic frequency . The latter quantity depends sensitively on the circular velocity as a function of radius. The rotation curve (Fig. 12) for NGC 5248 suffers from non-circular motions between and , and and ( 5). In consequence, the linear resonance diagram is too noisy to provide meaningful estimates of the location of the ILRs. However, an upper limit to the bar pattern speed can be inferred from it. is of order 30 km s-1 kpc-1 around a radius of , and for a flat rotation curve it must be even lower at the CR of (Paper I and 3). The condition [ = ] at CR, therefore, implies that the bar pattern speed is below 30 km s-1 kpc-1. This low pattern speed will be used in 7.2.
An interesting, albeit speculative possibility is that we may be observing a time-dependent rather than a quasi-static phenomenon in the disk of NGC 5248. Numerical modeling of the evolution, geometry, and associated SF of circumnuclear rings shows that when gas inflow rates along the bar are large, the ring is typically oval in shape and leads the bar by (Knapen et al. 1995b; Shlosman 1996). Once gas inflow rates slow down substantially, the circumnuclear ring acquires a round shape and a relatively uniform distribution of SF, typically after a characteristic timescale of order yrs. In the deprojected H image of NGC 5248, the star-forming ring at 375 pc has such a quasi-circular appearance, with star formation uniformly distributed azimuthally. Furthermore, a significant fraction of the stellar clusters in NGC 5248 have ages of order 100 Myr (Maoz et al. 2001), consistent with the above characteristic evolutionary timescale. On the other hand, the massive CO arms with large non-circular motions joining the ring, the young age (10–20 Myr; Maoz et al. 2001) of many SSCs in the ring, and the young age (10 Myr; 4) of the -band arms which delineate them, all point to a recent triggering of SF in the last 10–20 Myr. Taken together, the complicated morphology of the stars and ISM in the vicinity of ILRs, and the range of ages seen in the stellar clusters allow for a strongly time-dependent evolution of the inner kpc.
7.2 Bar-driven gas density waves inside the ILR
The present work provides ample observational evidence in favor of continuity of grand-design spiral structure from the nuclear (sub-kpc) to 10 kpc scales in the barred galaxy NGC 5248. In particular, our observations ( 3) show that NGC 5248 hosts spiral structure in stars, dust, and gas over a striking two orders of magnitude in spatial scales. They also demonstrate that spiral structure in NGC 5248 winds up over a large azimuthal angle, at least , deep inside the OILR ( 7.1). The two massive CO and dust spirals (Fig. 4b) extend between and , connecting to the inner young -band arms ( 3; Fig. 8) which continue from to , delineating the SSCs (Fig. 7) in the star-forming ring. Still closer to the center, between and , reside the nuclear dust spiral, the double-peaked molecular feature, and the nuclear H ring ( 3). To account for the observed properties, we next compare NGC 5248 to theoretical models of gas response deep inside the ILR of a barred potential.
According to the density wave theory (e.g., Lin & Shu 1964; Lin, Yuan, & Shu 1969; Bertin et al. 1989a,b), stellar density waves cannot propagate inwards across the ILR and are damped at smaller radii. However, gaseous density waves, in principle, can exist at most radii, depending on the degree of self-gravity in the gas. If the gas self-gravity is ignored, the gaseous wave propagation is limited to the region between the ILRs (for the case of two ILRs), or to the region between the center and the ILR (for the case of one ILR). The propagation of gaseous density waves in the central regions of disk galaxies has attracted recent attention and has been investigated with hydrodynamical simulations (Englmaier & Shlosman 2000). In these simulations, strong bar shocks which exist in the vicinity of the ILR(s) trigger gas density waves which propagate radially inwards and are sheared by galactic rotation. The transition between the gaseous wave driven by the outer shocks and the lower amplitude wave which is propagating inwards happens near the transition radius , where shocks cross the bar major axis (see the point P4’ in Fig. 13c). The simple explanation for the sudden drop in wave amplitude seems to be the existence of a ‘spray-type’ flow in this region. In other words, the flow diverges here suddenly due to trajectory curvature and the surface density drops as a result. This type of flow happens only when the wave approaches the major axis of the bar, while at other azimuths, the flow streamlines converge.
Englmaier & Shlosman (2000) ignored the contribution of self-gravity in their dispersion relationship for gaseous waves deep inside the ILRs of barred galaxies and in their modeling. This approach was motivated by the observed low arm-interarm contrast of and the lack of star formation along the nuclear dust spiral in NGC 5248, observed in between and (Laine et al. 1999). The shape of the resulting gaseous spiral depends on two parameters: the degree of central concentration and the sound speed in the gas. One can obtain a range of shapes, from a tightly-wound to an open one. The tightly-wound spirals in fact degenerate into a featureless disk. The theoretical and numerically-modeled shapes of the spirals and their amplitudes are found to agree well within the transition radius . Outside this radius the theoretical curve suffers from a number of simplifications, most notably the neglect of the gas self-gravity term. This leads to a singularity in the analytical expression for the pitch angle, tan , at the ILR, where the wavevector . This unphysical behavior can be corrected by adding the gravitational term, , where is the gas surface density, to the dispersion relationship (Eq. 1 in Englmaier & Shlosman). The prime motivation for introducing this correction in this paper is the existence of massive molecular (CO) arms with a large (arm/interarm) contrast in NGC 5248.
Figs. 13a and 13c show the model gas response, respectively, along the entire bar and inside the OILR. The corresponding observed spirals are shown, respectively, in Figs. 13b and 13d. The massive CO arms in NGC 5248 appear to correspond to the high amplitude non-linear gaseous waves propagating inwards across the OILR, in which case they would have to lie outside the transition radius . On the other hand, the double-peaked CO feature F1 and nuclear dust spiral, which lie interior to the starburst ring of radius, appear to be associated with the linear wave. This suggests that –. Note that the minimum of the spiral pitch angle (Fig. 14a) lies near this estimated .
Fig. 14a displays the observed (dotted line) pitch angles of gaseous spirals. The pitch angle of the dusty spiral is marked with a dot at . The solid line is a smooth eyeball-fit to the observed pitch angle, which we used below for the self-gravitating case. In the case where the gaseous density wave and large-scale bar have the same pattern speed, and when the self-gravity of the gas can be neglected, the model of Englmaier & Shlosman (2000) predicts a unique run of pitch angle with radius, once the sound speed, the pattern speed, and the rotation curve are specified. As the non-linear gaseous spiral wave travels inside the OILR, the model predicts that its pitch angle will drop until it gets into resonance with the linear gaseous wave at . Interior to , the pitch angle is expected to increase. On the basis of this predicted behavior, Fig. 14a suggests that lies around . One can discuss separately the behavior of two branches, for the radii smaller or larger than . The left branch is formed by the dust nuclear spiral, while the right one is associated with the dusty spiral which follows the CO arms. Note that the pitch angle of the two trailing CO arms can be reliably measured only from a radius of (1.3 kpc) to (450 pc). From and , the CO pitch angle cannot be reliably measured as the emission is too weak. This region between and is where the spiral structure appears to continue in the form of -band arms which delineate the SSCs in the starburst ring. As discussed in 6, the weak CO emission in this region is likely due to CO near the SSCs being cleared out by winds and supernovae, or dissociated. Fortunately, the pitch angle of the nuclear dust spiral (Laine et al. 2001) provides empirical data between and .
One can also infer the physical characteristics of gaseous spirals which result from the smooth eyeball-fit to the observed pitch angle (Fig. 14a; solid line) and the self-gravity term. These inferred characteristics include the Toomre () parameter, and the gas surface density. Here, is the gas sound speed and is the epicyclic frequency. Fig. 14b displays the effective for km s-1 and the bar pattern speed km s-1 kpc-1. This bar pattern speed is justified in 7.1. The -curve tends asymptotically to infinity on both sides of the ‘gap’ between . Larger values of correspond to progressively less ‘self-gravity.’ This gap has a counterpart in the surface gas density profile (Fig. 14c), where . The gap in the above analysis displays the effect of the ring and the associated -band arms extending to about . One should not forget also that the non-circular motions are large in this region adjacent to the ring ( 5). Clearly, neglecting the contribution of the stellar component is not permitted here.
Our estimate for the position of in Fig. 14a can be independently tested. Namely, close to the OILR, large deviations from purely circular motions are expected (Fig. 15a). On the other hand, inside , the model predicts an azimuthal flow speed which is close to the circular speed. Thus, around , the observed and circular speed are expected to converge (Fig. 15a). Figs. 15b and 15c show the observed difference between the circular speed curve and the CO velocity. The largest deviation from circular motions occurs between a radius of and and a sharp change is seen at about , where the observed and circular speeds converge. This supports our estimate of . The kinematical properties are therefore consistent with the model predictions.
The above combination of multiwavelength observations and modeling suggests that when the right conditions are met, a bar can drive a gaseous SDW which winds over a large azimuthal angle and extends deep inside the ILR. The perturbations thus generated inside the OILR can be strong and self-gravitating, such as the massive CO arms in NGC 5248. Overall, the spiral structure induced by the bar may lead to an appreciable gas inflow rate relevant for the fueling of starburst activity in nuclear rings — a possibility strongly hinted at in NGC 5248 by the large non-circular motions in the CO arms and the massive recent SF along the young -band spirals ( 6). A relatively low central mass concentration (evident through a shallow rotation curve) which prevents the spirals from winding up, is a crucial condition favorable to the propagation of the gaseous SDW deep inside the ILR. This condition is more easily met in late-type than in early-type spirals. Conversely, in the presence of a large central mass concentration, the models of Englmaier & Shlosman (2000) show that the gaseous wave driven by the outer bar shocks can die away rapidly inside the ILR. This very condition, interestingly enough, leads to the formation of ILRs and favors the formation and dynamical decoupling of secondary nuclear bars by causing the inner regions of a bar to rotate much faster than primary bar pattern speed. We note that the rotation curve of NGC 5248 is shallower than that of many well-studied barred galaxies such as NGC 6951, NGC 4102 (Jogee 1999), NGC 2782 (Jogee et al. 1999), and M100 (Knapen et al. 1995a). In NGC 5248, the offset spiral dust lanes and CO arms cover at least in azimuth inside the OILR before they join a starburst ring (Fig. 6 and Fig. 13d), while in in NGC 6951 (Jogee 1999) and M100 (Knapen et al. 1995a), the corresponding azimuthal angle is only . In NGC 2782 which hosts a nuclear bar, the CO rotation curve has a turnover velocity of above 300 km s-1, and is much steeper than in NGC 5248 (Jogee et al. 1999).
8 Summary and Discussion
We present a study of the grand-design spiral structure, gas dynamics, and circumnuclear SF in the nearby barred galaxy NGC 5248, based on a multi-wavelength dataset and theoretical modeling of gas dynamics. The extensive dataset includes high () resolution OVRO CO (1–0) observations, optical and NIR ground-based data, along with HST images and Fabry–Perot H observations. This study provides the best evidence to date for a strong dynamical coupling between the nuclear (sub-kpc) region and the large-scale features in the outer galactic disk. It shows how bar-driven spiral structure in NGC 5248 extends over two orders of magnitude in spatial scales, shapes disk evolution, and fuels SF on progressively smaller scales.
The grand-design spiral structure is particularly evident in the dust spirals which cover at least 360∘ in azimuth and continue from a radius of 70 kpc down to 375 pc, penetrating the OILR of the bar located at 2.0 kpc. Interior to the OILR, two massive trailing molecular spiral arms cover nearly in azimuth from a radius of 1.5 kpc to 375 pc, where they feed a circumnuclear starburst ring. The molecular spirals are massive, containing M☉ of gas, and show non-circular streaming motions of 20 to 40 km s-1. At a radius of 600 pc, they connect to two -band arms which cross the starburst ring and continue down to 225 pc. The UV-bright SSCs seen in the HST image lie along these -band spirals. The particularly narrow width ( 110 pc) of the -band arms suggests a young dynamical age of 10 Myr, comparable to the age of the SSCs (10–40 Myr; Maoz et al 2001) and that of the supergiants (8–10 Myr) which often dominate -band emission in starburst regions. Altogether, the data suggest that the -band arms are young, and recent SF in the ring at 375 pc has been triggered by a bar-driven density wave. The density wave may have even propagated into the central 100 pc since the -band arms appear to connect to a grand-design nuclear dust spiral which continues inwards from 225 pc to 75 pc (Laine et al. 1999). This dust spiral crosses a second H ring of radius 95 pc and a double-peaked molecular feature.
We estimate a SFR of about 2 yr-1 in the inner few kpc of NGC 5248. Only a small fraction of this SFR originates in the massive CO spiral arms although they contain most of the molecular gas. The shear induced by the non-circular kinematics, as well as sub-critical gas densities, may be responsible for the low SF efficiency in the arms. The latter point is supported by modeling. We also find that the four emission-line complexes which have the largest extinction and line ratios consistent with an embedded, optically-invisible, young stellar population, a few Myr old, are located in the massive CO arms, near bright CO peaks with large gas surface densities of 600–1500 pc-2. Conversely, visible SSCs which have moderate extinction (0 1 mag) lie in the starburst ring where they are associated with low levels of CO emission and are surrounded by shells of ionized gas. Overall, the distribution of molecular gas, ionized gas, and stellar clusters in NGC 5248 are consistent with a picture where young star-forming regions are born within dense gas complexes and subsequent stellar winds and supernovae efficiently clear out gas on timescales less than a few million years.
There is mounting evidence from recent high resolution (10–100 pc) ground-based and HST observations that grand-design dust and gas spirals are common in the inner kpc of galaxies. In NGC 5248, a bar-driven SDW has led to massive CO spiral arms which cover a large range in radius inside the OILR and feed a starburst ring. To account for such massive perturbations we have generalized the Englmaier & Shlosman (2000) models of gaseous SDW by incorporating the effect of gas self-gravity. We thereafter find good agreement between the modeled and observed gas morphology, gas kinematics, and pitch angle of the spirals. This suggests that grand-design spirals in the inner kpc can be explained by the propagation of gaseous density waves deep inside the ILR of the barred potential, when the right dynamical conditions are met. In particular, our study confirms that a low central mass concentration (evident through a shallow rotation curve), which may be common in many late-type galaxies, is particularly favorable to the propagation of bar-driven gaseous density waves deep into the central region of the galaxy. Conversely, a large central mass concentration favors other processes such as the formation and decoupling of nuclear bars.
References
- (1)
- (2) Aalto, S., Booth, R. S., Black, J. H., & Johansson, L. E. B. 1995, A&A, 300, 369
- (3)
- (4) Allen, R. J., Atherton, P. D., & Tilanus, R. P. J. 1986, Nature, 319, 296
- (5)
- (6) Alonso–Herrero, A., Ryder, S. D., & Knapen, J. H. 2001, MNRAS, 322, 757
- (7)
- (8) Athanassoula, E. 1992, MNRAS, 259, 345
- (9)
- (10) Athanassoula, E. 2002, in ASP Conference Series, Disks of Galaxies: Kinematics, Dynamics, and Interactions, eds. E. Athanassoula & A. Bosma (San Francisco: ASP), in press
- (11)
- (12) Barth, A. J., Ho L. C., Fillipenko, A. V., Sargent, W. L. 1995, AJ, 110
- (13)
- (14) Bertin, G., Lin, C. C., Lowe, S. A., Thurstans, R. P. 1989a, ApJ, 338, 78
- (15)
- (16) Bertin, G., Lin, C. C., Lowe, S. A., Thurstans, R. P. 1989b, ApJ, 338, 104
- (17)
- (18) Binney, J., & Tremaine, S. 1987, Galactic Dynamics, ed. Ostriker, J. P. (Princeton: Princeton University Press)
- (19)
- (20) Bloemen, J. B. G. M., Strong, A. W., Mayer–Hasselwander, H. A., Blitz, L., Cohen, R. S., Dame, T. M., Grabelsky, D. A., Thaddeus, P., Hermsen, W., & Lebrun, F. 1986, A&A, 154, 25
- (21)
- (22) Bureau, M. 2002, in ASP Conference Series, Disks of Galaxies: Kinematics, Dynamics, and Interactions, eds. E. Athanassoula & A. Bosma (San Francisco: ASP), in press
- (23)
- (24) Buta, R., & Crocker, D. 1993, AJ, 105, 1344
- (25)
- (26) Buta, R. 1984, Proc. Astron. Soc. Aus. 5, 472, 1984
- (27)
- (28) Buta, R., & Combes F. 1996, Fundamentals of Cosmic Physics, Vol. 17 (Overseas Publishers Association), 95
- (29)
- (30) Buta, R., Treuthardt, P. M., Byrd, G. G., & Crocker, D. A. 2000, AJ, 120, 1289
- (31)
- (32) Combes, F., & Gerin, M. 1985, A&A, 150, 327
- (33)
- (34) Condon, J. J. 1992, ARAA, 30, 575
- (35)
- (36) Contopoulos, G. & Papayannopoulos, T. 1980, A&A, 92, 33
- (37)
- (38) De Vaucouleurs, G., de Vaucouleurs, A., Corwin Jr., H. G., Buta, R. J., Paturel, G., & Fouque, P. 1991, Third Reference Catalogue of Bright Galaxies (New York: Springer) (RC3)
- (39)
- (40) Elmegreen, B. G. 1989, ApJ, 338, 178
- (41)
- (42) Elmegreen, B. G., Seiden, P. E., & Elmegreen, D. M. 1989, ApJ, 343, 602
- (43)
- (44) Elmegreen, B. G. 1994, ApJ, 425, L73
- (45)
- (46) Elmegreen, D. M., Chromey, F. R., Santos, M., & Marshall, D. 1997, AJ, 114, 1850
- (47)
- (48) Englmaier, R., & Shlosman, I. 2000, ApJ, 528, 677
- (49)
- (50) Erwin, P., Beltran, J. C. V., & Beckman, J. E. 2001, in ASP Conf. Series, The Central kpc of Starbursts and AGN: The La Palma Connection, eds. J. H. Knapen, J. E. Beckman, I. Shlosman, & T. J. Mahoney (San Francisco: ASP) 249, 171.
- (51)
- (52) Friedli, D., & Martinet, L. 1993, A&A, 277, 27
- (53)
- (54) Helfer, T. T., & Blitz, L., 1993, ApJ, 419, 86
- (55)
- (56) Heller, C. H., & Shlosman, I. 1994, ApJ, 424, 84
- (57)
- (58) Heller, C. H., & Shlosman, I. 1996, ApJ, 471, 143
- (59)
- (60) Hunter, D. A., O’Connell, R. W., Gallagher, J. S., & Smecker–Hane, T. A. 2000, AJ, 120, 2383
- (61)
- (62) Hüttemeister, S. & Aalto, S. 2001, in ASP Conf. Series, The Central kpc of Starbursts and AGN: The La Palma Connection. eds. J. H. Knapen, J. E. Beckman, I. Shlosman, & T. J. Mahoney (San Francisco: ASP) 249, 619
- (63)
- (64) Jogee, S. 1999, Ph.D. thesis, Yale University
- (65)
- (66) Jogee, S., Kenney, J. D. P., & Smith, B. J. 1999, ApJ, 526, 665
- (67)
- (68) Jogee, S. 2001, in Proceedings of Rinberg Workshop, Starbursts Near and Far, eds L. Tacconi & D. Lutz (Springer) (astro-ph/0201202):
- (69)
- (70) Jogee, S., Baker, A. J., Sakamoto, K., Scovile, N. Z., & Kenney, J. D. P. 2001, in ASP Conf. Series, The Central kpc of Starbursts and AGN: The La Palma Connection, eds. J. H. Knapen, J. E. Beckman, I. Shlosman, & T. J. Mahoney (San Francisco: ASP) 249, 612
- (71)
- (72) Jogee, S., Knapen, J. H., Laine, S., Shlosman, I., & Scoville, N. Z. 2002, ApJL, in press (Paper I)
- (73)
- (74) Kenney, J. D. P., Wilson, C. D., Scoville, N. Z., Devereux, N. A., & Young, J. S. 1992, ApJ, 395, L79
- (75)
- (76) Kenney, J. D. P., & Young, J. S. 1989, ApJ, 344, 171.
- (77)
- (78) Kennicutt, R. C., Jr., Keel, W. C., & Blaha, C. A. 1989, AJ, 97, 1022
- (79)
- (80) Knapen, J. H., Beckman, J. E., Shlosman, I., Peletier, R. F., Heller, C. H., & de Jong, R S. 1995a, ApJL, 443, L73.
- (81)
- (82) Knapen, J. H., Beckman, J. E., Heller, C. H., Shlosman, I., & de Jong, R. S. 1995b, ApJ, 454, 623
- (83)
- (84) Knapen, J. H., & Beckman, J. E. 1996, MNRAS, 283, 251
- (85)
- (86) Knapen, J. H., Shlosman, I., Heller, C. H., Rand, R. J., Beckman, J. E., & Rozas, M. 2000, ApJ, 528, 219
- (87)
- (88) Koopmann, R. A., 1997, Ph.D. thesis, Yale University
- (89)
- (90) Laine, S., Knapen, J. H., Pérez–Ramírez, D., Doyon, R., & Nadeau, D. 1999a, MNRAS, 302, L33
- (91)
- (92) Laine, S., Kenney, J. D. P., Yun, M. S., & Gottesman, S. T. 1999b, ApJ, 511, 709
- (93)
- (94) Laine, S., Knapen, J. H., Pérez–Ramírez, D., Englmaier, P., & Matthias, M. 2001, MNRAS, 324, 891
- (95)
- (96) Laine, S., Shlosman, I., Knapen, J. H., & Peletier, R. F. 2002, ApJ, 567, 97
- (97)
- (98) Leitherer, C. et al. 1999, ApJS, 123, 3
- (99)
- (100) Leitherer, C., & Heckman, T. M. 1995, ApJS, 96, 9
- (101)
- (102) Lin, C. C., & Shu, F. H. 1964, ApJ, 140, 646
- (103)
- (104) Lin, C. C., Yuan, C., & Shu, F. H. 1969, ApJ, 155, 721
- (105)
- (106) Maciejewski, W., & Sparke, L. S. 2000, MNRAS, 313, 745
- (107)
- (108) Maciejewski, W., Teuben, P. J., Sparke, L. S., & Stone, J. M. 2002, MNRAS, 329, 502
- (109)
- (110) Maíz–Apellániz, J., Muñoz–Tuñon, C., Tenorio–Tagle, G., & Mas–Hesse, J. M. 1999, A&A, 343, 64
- (111)
- (112) Maoz, D., Barth, A. J., Sternberg, A., Filippenko, A. V., Ho, L. C., Macchetto, F. D., Rix, H.–W., & Schneider, D. P. 1996, AJ, 111, 2248
- (113)
- (114) Maoz, D., Barth, A. J., Ho, L. C., Sternberg, A., & Filippenko, A. V. 2001, AJ, 121, 3048
- (115)
- (116) Martin, P. 1995, AJ, 109, 2428
- (117)
- (118) Martini, P. & Pogge, R. W. 1999, AJ, 118, 2646
- (119)
- (120) Noguchi , M. 1988, A&A, 203, 259
- (121)
- (122) Padin, S., Scott, S. L., Woody, D. P., Scoville, N. Z., Seling, T. V., Finch, R. P., Giovanine, C. J., & Lawrence, R. P. 1991, PASP, 103, 461
- (123)
- (124) Patsis, P., Grosbol, G., & Hiotelis, N. 1997, A&A, 326, 493
- (125)
- (126) Pérez–Ramírez D., Knapen, J. H., Peletier, R. F., Laine, S., Doyon, R., & Nadeau, D. 2000, MNRAS, 317, 234
- (127)
- (128) Pfenniger, D. 1996, in Centennial Nobel Symp. on Barred Galaxies and Circumnuclear Activity, eds. A. Sandquist and P. O. Lindblad (Springer–Verlag: Berlin), 91
- (129)
- (130) Regan, M. W., & Mulchaey, J. S. 1999, AJ, 117, 2676
- (131)
- (132) Regan, M. W., Thornley, M. D., Helfer, T. T., Sheth, K., Wong, T., Vogel, S. N., Blitz, L., & Bock, D. C.–J. 2001, ApJ, 561, 218
- (133)
- (134) Ryder, S. D., & Knapen, J. H. 1999, MNRAS, 302, L7
- (135)
- (136) Ryder, S. D., Knapen, J. H., & Takamiya, M. 2001, MNRAS, 323, 663
- (137)
- (138) Sakamoto, K., Okumura, S., Takeo, M., Yukiyasu, K., & Wada, K. 1995, AJ, 110, 2075
- (139)
- (140) Sakamoto, K., Okumura, S. K., Ishizuki, S., & Scoville, N. Z. 1999, ApJS, 124, 403
- (141)
- (142) Schwarz, M. P. 1984, MNRAS, 221, 195
- (143)
- (144) Scoville, N. Z., & Sanders, D. B. 1987, in Interstellar Processes, ed. D. J. Hollenbach & H. A. Thronson (Dordrecht: Reidel), 21
- (145)
- (146) Scoville, N. Z., Carlstrom, J. E., Chandler, C. J., Phillips, J. A., Scott, S. L., Tilanus, R. P. J., & Wang, Z. 1993, PASP, 105, 1982
- (147)
- (148) Sheth, K. 2001, Ph.D. Thesis, University of Maryland.
- (149)
- (150) Shlosman, I. 1996, in Centennial Nobel Symp. on Barred Galaxies and Circumnuclear Activity, Eds. A. Sandqvist and P.O. Lindblad (Springer–Verlag: Berlin), 141
- (151)
- (152) Shlosman, I., Frank, J., and Begelman, M. C. 1989, Nature, 338, 45
- (153)
- (154) Shlosman, I. 1999, in ASP Conf. Ser., vol. 187, Evolution of Galaxies on Cosmological Timescales, eds. J.E. Beckman & T.J. Mahoney (San Francisco: ASP), 100
- (155)
- (156) Shlosman, I. 2001, in ASP Conf. Series, The Central kpc of Starbursts and AGN: The La Palma Connection. eds. J. H. Knapen, J. E. Beckman, I. Shlosman, & T. J. Mahoney (San Francisco: ASP) 249, 55
- (157)
- (158) Shlosman, I., & Heller, C. H. 2002, ApJ, 565, 921
- (159)
- (160) Shlosman, I. 2002, in ASP Conference Series, Disks of Galaxies: Kinematics, Dynamics, and Interactions, eds. E. Athanassoula & A. Bosma (San Francisco: ASP), in press
- (161)
- (162) Simkin, S. M., Su, H. J., Schwarz, M. P. 1980, ApJ, 237, 404
- (163)
- (164) Sofue, Y. 1991, in Proceedings of IAU Symposium 146, Dynamics of Galaxies and Their Molecular Cloud Distributions, ed. F. Combes and F. Casoli (Dordrecht: Kluwer), 156
- (165)
- (166) Solomon, P. M., Rivolo, A. R., Barrett, J., & Yahil, A. 1987, ApJ, 319, 730
- (167)
- (168) Strickland, D. K., & Stevens, I. R. 1999, MNRAS, 306, 43
- (169)
- (170) Tilanus, R. P. J., & Allen, R. J. 1989, ApJL, 339, L57
- (171)
- (172) Tilanus, R. P. J., & Allen, R. J. 1991, A&A, 244, 8
- (173)
- (174) Vanhala, H. A. T., & Cameron, A. G. W. 1998, ApJ, 508, 291
- (175)
- (176) Vogel, S. N., Kulkarni, S. R., & Scoville, N. Z. 1988, Nature, 334, 402
- (177)
- (178) Vila–Costas, M. B., & Edmunds, M. G. 1992, MNRAS, 259, 121
- (179)
- (180) Wall, W. F., & Jaffe, D. T. 1990, ApJ, 361, L45
- (181)
- (182) Wild, W., Harris, A. I., Eckart, A., Genzel, R., Graf, U. U., Jackson, J. M., Russell, A. P. G., & Stutzki, J. 1992, A&A, 265, 447
- (183)
- (184) Whitmore, B. C., Zhang, Q., Leitherer, C., Fall, S. M., Schweizer, F., & Miller, B. W. 1999, AJ, 118, 1551
- (185)
- (186) Young, J. S., Xie, S., Tacconi, L., Knezek, P., Viscuso, P., Tacconi–Garman, L., Scoville, N., Schneider, S. et al. 1995, ApJS, 98, 219
- (187)
| Hubble type | SAB(rs)bcb,c |
|---|---|
| Nuclear type | Hii2d,e |
| b | |
| Distance D | 15.3b Mpc |
| Inclination i | 40c 4 |
| Line of nodes | 105c 2 ∘ |
| Center(B1950.0) | R.A.= 13h 35m 02.54sb |
| Dec = b | |
| 1153b km s-1 |
References. — a. Nearby Galaxies (NBG) Catalogue (Tully 1988); b. RC3 (de Vaucouleurs et al. 1991); c. Jogee et al. 2002 d. Ho, L. C., Filippenko, A. V., & Sargent, W. L. W. 1997; e. Kennicutt, Keel, & Blaha 1989.
| Pointing center (B1950.0) | R.A.= 13h 35m 02.60s |
|---|---|
| Dec = | |
| Projected baselines | 12 to 483 m |
| Transition | CO (1–0) at 115 GHz |
| Half power beam width | |
| Spectral bandwidth | 240 MHz, 600 km s-1 |
| Spectral resolution | 5.2 km s-1 |
| Synthesized beam | 1 9 1 4, pc |
| PA = | |
| Emission channels | 1012 to 1293 km s-1 |
| Peak emission | 210 mJy/beam |
| Peak a | 6.9 K |
| Typical r.m.s. | 17 mJy per beam |
| Flux in OVRO map | 385 Jy km s-1 |
| Mgasb | M☉ |
| c | 85 % |
| Single dish flux | 450d Jy km s-1 |
Note. — a. = Brightness temperature in Rayleigh-Jeans approximation. b. is the mass of molecular gas including the contribution of helium, assuming a standard Galactic CO-H2 conversion factor and a solar composition (see text). c. is the fraction of single dish flux recovered. d. From Five College Radio Observatory observations (Young et al. 1995)
| Data | Instrument/telescope | Field of view | Source | |
|---|---|---|---|---|
| (1) | (2) | (3) | (4) | (5) |
| CO (1–0) | OVRO mm array | 8 x 6 h | a | |
| H+[Nii] | WFPC2/HST | 4800 s | b | |
| F336W | WFPC2/HST | 2300 s | b | |
| F547M | WFPC2/HST | 900 s | b | |
| F814W | WFPC2/HST | 1100 s | b | |
| Harris | WFC/INT 2.5 m | 30 min | 113 225 | a,c |
| Harris | PFC/INT 2.5 m | 20 min | d | |
| INGRID/WHT 4.2 m | 12 min | 51 53 | e | |
| Fabry-Perot H | TAURUS II/WHT 4.2 m | 55110 s | f | |
| map | MONICA-AO/CFHT 3.6 m | 180 s | 12 4 12 4 | g |
| map | MONICA /CFHT 3.6 m | 300 s | g |
Note. — Columns are : (1) Description of the data. We quote the transition for the interferometric data and the filter for the images; (2) Instrument and telescope. Abbrevations used are OVRO = Owens Valley Radio Observatory; WFPC2/HST = Wide Field Planetary Camera 2 on the Hubble Space Telescope; WFC/INT = Wide Field Camera on the Isaac Newton Telescope at La Palma; PFC/INT = Prime Focus Camera on the Isaac Newton Telescope at La Palma; INGRID/WHT = INGRID camera on the William Herschel Telescope at La Palma; TAURUS II/WHT = TAURUS II instrument in Fabry Perot mode on the William Herschel Telescope at La Palma; MONICA-AO/CFHT = Combination of Montreal NIR camera MONICA with the adaptive optics system PUEO on the Canada-France-Hawaii Telecope at Mauna Kea; (3) On-source exposure time; (4) Field of view. For OVRO, the primary half power beam width at 115 GHz is quoted; (5) Source of data.
References. — a. This work; b. Archival HST images first published by Maoz, Barth, Ho, & Fillipenko (2001); c. Jogee et al. (2002) d. Isaac Newton Group archive; e. Knapen et al., in preparation; f. Laine et al. (2001); g. Laine et al. (1999)
| (1.4GHz)a | W Hz-1 |
|---|---|
| SFR(1.4 GHz) | 3.2 M☉ yr-1 (global) |
| (FIR)b | |
| SFR(FIR) | 3.1 M☉ yr-1 (global) |
| c | erg s-1 |
| SFR(H) | 2.1 M☉ yr-1 (circumnuclear) |
| SFR(-band )d | 1.5 M☉ yr-1 (circumnuclear) |
Note. — The table shows the derived SFRs using different tracers as described in the text. The term “global” refers to the entire galaxy while the term “circumnuclear” refers to the inner 400 pc radius, including the two rings of SF. Notes refer to: a. Radio continuum luminosity density at 1.4 GHz from Condon et al. (1990); b. FIR luminosity calculated from the IRAS 60 and 100 flux density following Helou et al. (1988); c. Extinction corrected H luminosity from HST WFPC2 data (Maoz et al. 2001). d. Average SFR based on ages and masses of “hot spots” derived from near-infrared colors (Elmegreen et al. 1997).
| Id | Radius | f (H) | f (Pa) | ||||
|---|---|---|---|---|---|---|---|
| (1) | (2) | (3) | (4) | (5) | (6) | (7) | (8) |
| 3 | 5.19 | 4.24 | 0.18 | 0.2 | 361 | 1.2 | 4.9 |
| 4 | 5.73 | 4.03 | 0.18 | 0.3 | 515 | 1.9 | 6.8 |
| 16 | -6.70 | -2.75 | 0.36 | 0.4 | 566 | 8.8 | 21.4 |
| 9 | 10.18 | -0.5 | 0.18 | 1.1 | 943 | 7.8 | 6.8 |
| 11 | 5.50 | -2.69 | 0.27 | 1.5 | 89 | 17.5 | 11.7 |
| 13 | 0.98 | -6.24 | 0.32 | 1.6 | 170 | 21.8 | 13.6 |
| 15 | -5.01 | -2.31 | 0.36 | 1.7 | 121 | 33.8 | 20.4 |
| 2 | 2.97 | 2.99 | 0.18 | 1.9 | 149 | 16.9 | 8.8 |
| 10 | 6.84 | -1.72 | 0.18 | 2.5 | 146 | 12.1 | 4.9 |
| 5 | 6.04 | 3.21 | 0.18 | 2.5 | 349 | 17.0 | 6.8 |
| 1 | 3.25 | 4.61 | 0.32 | 2.9 | 111 | 30.6 | 10.7 |
| 18 | -3.74 | 2.74 | 0.23 | 3.2 | 58 | 21.8 | 6.8 |
| 20 | -2.37 | 7.44 | 0.18 | 3.5 | 186 | 13.6 | 3.9 |
| 7 | 4.52 | 0.62 | 0.32 | 3.7 | 41 | 35.8 | 9.7 |
| 19 | -3.28 | 3.79 | 0.23 | 3.8 | 45 | 18.7 | 4.9 |
| 17 | -6.21 | 0.93 | 0.36 | 3.9 | 58 | 45.2 | 11.7 |
| 6 | 3.65 | 0.96 | 0.27 | 4.0 | 47 | 35.2 | 8.8 |
| 12 | 4.10 | -3.90 | 0.45 | 4.1 | 87 | 104.7 | 25.3 |
| 21 | -7.89 | 4.16 | 0.18 | 4.9 | 80 | 33.6 | 6.8 |
| 14 | -2.32 | -3.93 | 0.91 | 5.0 | 61 | 358.0 | 72.0 |
| 8 | 4.50 | -0.54 | 0.23 | 7.0 | 27 | 27.1 | 3.9 |
Note. — The emission line complexes are listed in order of decreasing extinction, as measured by the H+[Nii]/Pa flux ratio (Maoz et al. 2001). Columns are : (1) Identification number for the emission-line complex used by Maoz et al. (2001); (2)-(3) Offset along the R.A. and declination direction in arcseconds from the galaxy nucleus whose pixel coordinates are (422.16,396.02); (4) Angular radius in arcseconds of the circular aperture used for flux measurements; (5) The H+[Nii]/Pa flux ratio which is a measure of extinction; (6) The equivalent width of the Pa line in Å, defined as the flux ratio of the Pa line and the continuum in the 1.6 band. This is an age indicator for a single burst model. (7)-(8) The H+[Nii] and Pa line fluxes in units of 10-16 ergs s-1 cm-2 without any correction for extinction. At the distance of 15.3 Mpc for NGC 5248, 10-16 ergs s-1 cm-2 corresponds to a luminosity of ergs s-1.
![[Uncaptioned image]](/html/astro-ph/0202270/assets/x4.png)
![[Uncaptioned image]](/html/astro-ph/0202270/assets/x5.png)
-
Fig. 4.— The grand-design dust spiral: (a) The resolution image shows a grand-design dust spiral which is continuous from at least (5.2 kpc) down to (375 pc). The region inside the white box is shown in Fig 4b. (b) The CO (1–0) intensity map (contours) is overlaid on a resolution color map (gray-scale) of the central 3.0 kpc. The dust spiral follows the CO spiral arms between and .
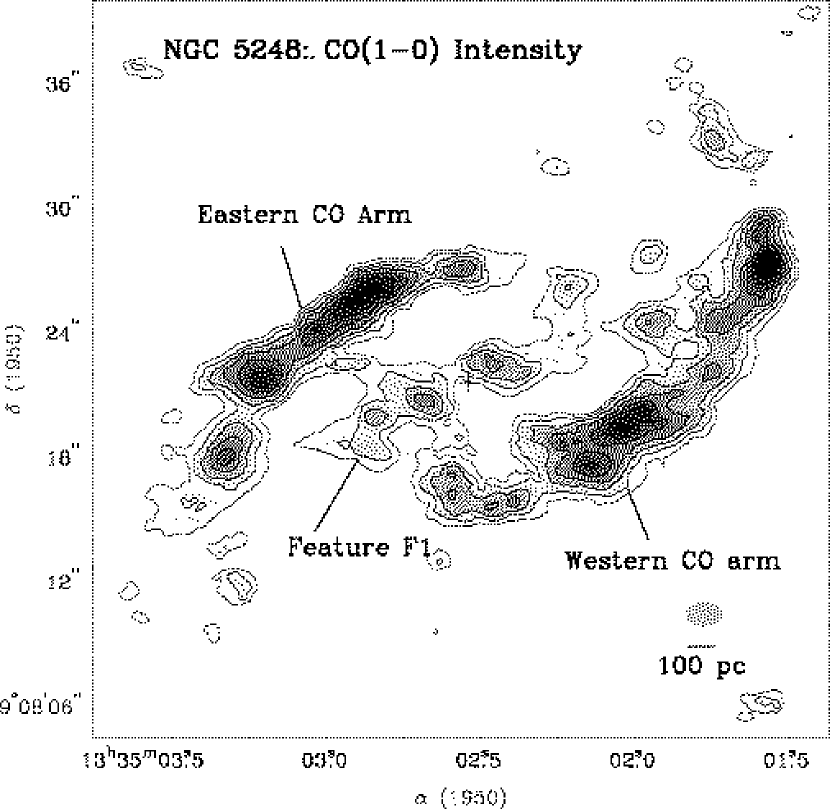
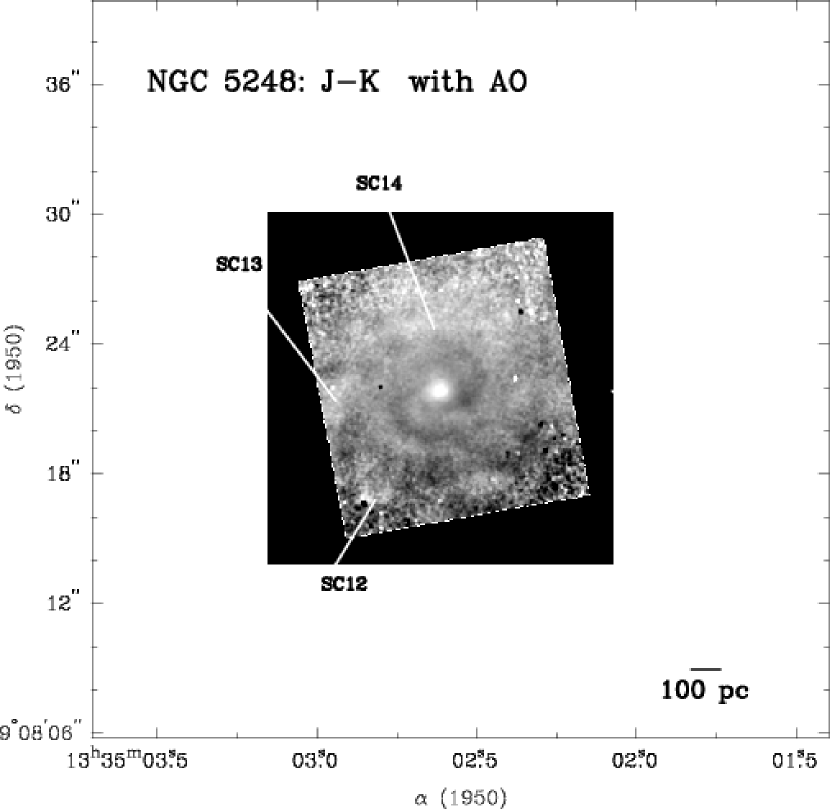
![[Uncaptioned image]](/html/astro-ph/0202270/assets/x8.png)
![[Uncaptioned image]](/html/astro-ph/0202270/assets/x9.png)
-
Fig. 10— Isophotal analysis: (a) Top: The radial profiles of surface brightness (SB), ellipticity (), and position angle (PA) of the and -band light are shown. The dotted and dashed lines refer to the values before deprojection. The symbols refer to deprojected values. The SB has been scaled by 1.32 so that it can be plotted on the same scale as the -band profile. In deprojected images, we adopt the convention that PAs are measured anticlockwise from “North”. The gradual change in PA (isophotal twist) between and is caused by -band arms. (b) Bottom: The fitted isophotes to the deprojected image provide a guide to the dominant periodic stellar orbits present and the location of dynamical resonances.
![[Uncaptioned image]](/html/astro-ph/0202270/assets/x10.png)
![[Uncaptioned image]](/html/astro-ph/0202270/assets/x11.png)
![[Uncaptioned image]](/html/astro-ph/0202270/assets/x12.png)
-
Fig. 11— The molecular gas kinematics: (a) Top: The CO (1–0) intensity-weighted velocity field of the central is shown. The synthesized beam is marked. Contour levels range from 1000 to 1300 km s-1 and are plotted at intervals of 10 km s-1. (b) Bottom left: The CO p–v cuts along the minor axis (). (c) Bottom right: The CO p–v cut along the line of nodes ().

-
Fig. 13— Comparison of the CO and -band spirals with hydrodynamical models of bar-driven gaseous spiral density waves in NGC 5248. This figure is included as a jpeg file. Left: Models — The steady-state gas response in models of bar-driven gaseous SDW is shown (a) from the central regions out to the end of the bar, and (c) only in the inner few kpc, deep inside the OILR of the bar. Points P1’ to P4’ in the models correspond to points P1 to P4 in the data. The orientation of the large-scale stellar bar is shown by a dotted line. Strong bar shocks around the OILR excite a trailing non-linear high amplitude gaseous SDW which weakens rapidly as it travels inside the OILR. Under the right conditions, it can excite a linear low amplitude gaseous SDW inside a transition radius . This linear SDW can wind through an arbitrary angle, because its shape is not dictated by the dominant stellar orbits. Right: The data — The deprojected CO map (white contours) of the central (3.0 kpc) is overlaid on a large-scale -band image. Regions of size (b) (36 kpc) and (d) (9 kpc) are shown. The two massive trailing CO spiral arms lie deep inside the OILR, cover more than 180 ∘ in azimuth, and appear to correspond to the high amplitude non-linear gaseous SDW. The double-peaked CO feature F1 and the nuclear dust spiral which lie inside appear to be associated with the linear gaseous SDW inside the transition radius .
![[Uncaptioned image]](/html/astro-ph/0202270/assets/x14.png)
-
Fig. 14— Comparison of observed and model pitch angles: (a) Top: The observed pitch angle for the nuclear dusty spiral (filled circle) and the CO spirals (dotted line), as well as, the best eyeball-fit to these data (solid line). For the eyeball-fit, we computed the model including self-gravity term shown in the other two panels based on the rotation curve of NGC 5248, a sound speed km s-1 and a pattern speed of 25 km s-1 kpc-1. (b) Middle: Effective Toomre parameter (see the text) along the spiral arms. (c) Bottom: Inferred gas surface density profile along the spiral arms. A transition radius, , separates the outer non-linear gas response from the linear response at smaller radii.
![[Uncaptioned image]](/html/astro-ph/0202270/assets/x15.png)
-
Fig. 15— Comparison of observed and model kinematics: (a) The gas kinematics predicted by models of the gaseous SDW are shown. Close to the OILR, where shocks from the bar perturb most, large deviations from purely circular motions are expected. Inside the transition radius the azimuthal speed is very close to the circular speed because the orbits are almost circular. A sharp change in behavior is expected at . (b) The observed difference between the circular speed curve and the CO velocity is shown. The velocity is measured along the western trailing CO spiral arm, and the southern part of the double-peaked CO feature F1. The largest deviations from circular motions occur between and and a sharp change is seen at a radius of about where the observed and circular speeds converge. (c) Same as in (b), but for the eastern trailing CO spiral arm, and the northern part of the CO feature F1.