Galaxy Evolution from Emission Linewidths
Galaxy Evolution from Emission Linewidths
Abstract
The major thrust of the Tully-Fisher (TF) surveys of distant galaxies is the measurement of linewidths rather than mere redshifts or colors. Linewidths are a measure of galaxy mass and should therefore be a more stable indicator of size than galaxy brightness, which can be badly affected by luminosity evolution. Masses may provide the best way to relate galaxies at different epochs, but for such a program to work, we must control systematic effects that could bias linewidth measurements at high redshift and skew comparisons with local Tully-Fisher calibrations. Potential sources of confusion in TF studies of galaxy structure and evolution include central or extended star bursts, infalling gas, turbulence and outflows, dust extinction, calibration of emission linewidths, and improper application of local TF calibrations to high redshift galaxies.
1 Introduction
Studies of galaxy structure and measurements of galaxy distances have often relied on the tight match between absolute luminosity and rotational linewidth, or Tully-Fisher relation (TFR). The best method for measuring spiral linewidths locally () uses H rotation curves. For distant galaxies with , H is shifted out of the optical bandpass into a forest of night-sky lines, forcing reliance on bluer emission lines ([O II]3727, H and [O III]4959,5007). Blue profiles may be affected by dust absorption more severely than H, and the radial distribution of [O II] and [O III] will depend on the abundance and temperature of the H II regions in a complicated way compared to H. For intermediate redshifts, spatially-resolved kinematics are no longer possible. Thus, one must first establish a calibration of blue and red, resolved[2D] and integrated [1D], galaxy linewidths in order to tie the local TFR to distant galaxies.
Courteau (1992; 1997; hereafter C92, C97) demonstrated the tight correlation between optical rotation curves[2D] and profiles[1D] and single-dish 21 cm profiles for a large sample of late-type spirals (see also Mathewson et al. 1992). Kobulnicky & Gebhardt (2000) extended this correlation to [O II] emission lines using a broad sample of Hubble types and showed that reliable linewidths could be obtained for distant galaxies. Blue linewidths for distant galaxies can therefore be compared to a local foil (H or H I) without introducing additional systematic effects. We confirm, and expand upon, the results of Kobulnicky & Gebhardt (2000) with a more extensive sample of Sc galaxies below. We also caution about important caveats in the application and interpretation of the TFR for distant galaxies.
1.1 Calibration of Blue Linewidths
Courteau (and Sandra Faber) collected optical long-slit spectra ([O II], H, [O III], H, [N II]) of 20 Sc galaxies with the Lick 3-m telescope and Kast Double spectrograph (Courteau, Faber, & Sohn 2002; hereafter CFS02). Integration times were 1800s for each spectrum and R. Our observing strategy includes the measurement of narrow-slit major axis spectra and drift scans over the full size of the galaxy to simulate low-resolution integrated profiles as measured at large distances. The data were reduced according to standard procedures (C97); rotation curves were extracted by measuring intensity-weighted centroids at each spatial bins and accounting for instrumental broadening. The [O II] doublets were fitted with a double Gaussian function convolved with the instrumental profile. The extracted rotation curves were then modelled with a smooth function, e.g. an arctan, to obtain characteristic terminal or suitably chosen velocities. For late-type spirals, the velocity estimate, , at 2.2 disk scale lengths (or equivalently at 1.3 effective radius) minimizes TF scatter (C97, Courteau & Rix 1999).
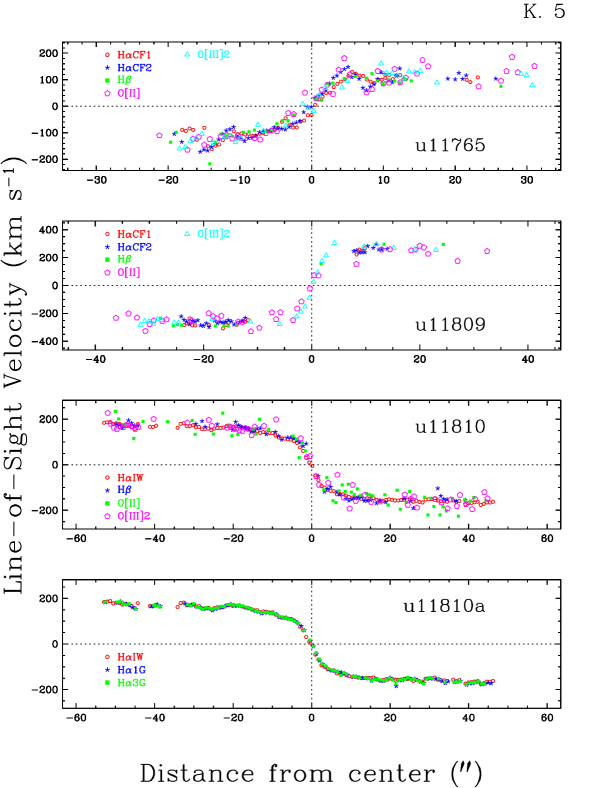
We verify that blue and red emission lines map the same velocity field (e.g. Fig. 1) though differences in spatial coverage, or flux ratios, exist. Thus, smooth fits to resolved rotation curves should yield matching ’s at all wavelengths. The rotation curve for UGC 11809 (Fig. 1) illustrates significant emission differences for H and blue linewidths at the center and outskirts of the galaxy. On average, blue and red emission lines trace the same extent (see Fig. 2), but for large systems ( kpc), H is systematically detected beyond the last point of blue emission.
We also construct 1-dimensional emission line profiles by collapsing the 2-dimensional rotation curves along the spatial axis (We account for the varying fraction of light at each radii covered by the long slit.) These profiles mimic the integrated linewidths of distant galaxies, and can be compared with lower resolution (and more realistic) drift scans. A suitable definition of integrated linewidth, measured at 20% of total flux, yields a good match to local 21cm linewidths (C97), both for collapsed profiles and drift scans. Note that it is critical that linewidths be measured similarly for calibrators and targets to prevent artificial biases.
We find a good correlation, with 15-20% scatter, between [O II], H, and H integrated linewidths (CFS02). [O III] fluxes are comparatively low and [OIII] integrated profiles are generally too noisy for extragalactic investigations. For emission-line galaxies, the integrated flux at [OII] is on average four times greater than at H; [O II] might therefore be favored as a kinematic tracer at high redshift. H ’s are however more easily measured (the [O II] doublet requires careful deblending).
Also, in contrast with Kennicutt (1992), Jansen et al. (2001) show that H is a considerably better tracer of star formation than [O II]. We suggest that H and [O II] emission lines be secured whenever possible for linewidth confirmation and star formation estimates (see e.g. Charlot & Longhetti 2001).

1.2 Central Star Bursts
At intermediate redshifts, the rotation curves of spiral disks can no longer be resolved and studies of TF evolution must rely on integrated linewidths.
The major drawback of intensity-weighted profiles is that a flux integral favors the brightest H II and star-bursting regions (C92, C97). Unlike resolved rotation curves, integrated linewidths also suffer from seeing and instrumental broadening effects which further complicates their analysis.
Central bursts may cause important linewidth (mass) discrepancies beyond where the population of bursting galaxies increases significantly (e.g. Steinmetz; this conference [tc]). Linewidths are usually measured relative to peak or total fluxes; either way, the effect of central starburst activity biases linewidths low. Galaxies with central bursts thus appear too bright (in a TF sense) for their linewidths, thereby mimicing luminosity evolution.

C92 compared linewidths of nearby galaxies with central starburst/AGN activity from resolved and integrated rotation profiles (see Fig. 3) and found that star-bursting bulges can yield linewidth measures that are 25-30% smaller than the true dynamical value. This corresponds to artificial offsets of 08 from the nominal TF relation, or a 75% increase in luminosity. Similarly, half-light radii can also be reduced by 40% or more by starburst activity. This “starburst bias” may explain the preponderance of blue compact (bursting) objects at intermediate redshifts (e.g. Guzman et al. 1997; Hammer et al. 2001; Koo [tc]) which would be the centers of massive, or less, spiral galaxies (see e.g. Barton & van Zee 2001 [BvZ01]). BvZ01 have also considered the effect of star-bursting bulges on integrated linewidths and find somewhat milder trends than reported here but do not preclude more active bursts and thus larger offsets such as the ones we find. Effects which would bias integrated linewidths high include extended (non-central) star-bursts, infalling gas from satellites and dwarfs, turbulence, gas outflows, etc. Alternate definitions of linewidth measurements may help control some of these biases (CFS02).
AGN activity, from mergers or interactions, is likely to increase with redshift at a rate (Patton et al. 2002), but we may be able to weed out bursting systems on the basis of their blue colors, especially if they are nuclear AGNs rather than starbursts (Kannappen et al. 2002), to the extent that a color-TF residual correlation can be identified at high . Furthermore, little luminosity evolution has so far been detected up to (e.g. Koo [tc]) and recent studies of TF evolution at intermediate redshifts based on integrated linewidths suggest only minor, if any, effects of central bursts (Vogt et al. 1997; Weiner [tc]).
1.3 Dust Extinction
The likely higher fraction of dust in the central parts of spiral galaxies at high redshifts is also a cause for concern. Dust extinction in the inner disk steepens the solid body part of the rotation curve, thus causing a central depression in the integrated profile. This, in turn, biases linewidths high. The comparison of rotation curves for blue and red emission lines (e.g. Fig. 1) shows no discernable effect due to opacity in the centers of these nearby, moderately inclined, disks (see also Prada 1996). Extinction effects, even at H, are most noticeable for tilted disks with and only 21-cm fluxes should be trusted in such cases (Courteau & Faber 1988). While our null test is reassuring for local TF studies, extinction effects should be revisited in TF studies of distant galaxies.
2 TF Applications at High-Redshift
The greatest challenge to comparing local TFRs to distant galaxies is the matching of galaxy families. The nearby TF calibrators should be direct descendants of the more distant targets, or else structural/dynamical differences will be meaningless. Contrary to most local TF calibrations which are often heavily pruned (e.g. for cosmic flow studies), the range of Hubble types for distant galaxies is poorly controlled – in large part due to resolution and cosmological dimming effects.
A proper TF calibration sample must include a broad and unbiased range of morphologies to sample the general emission-line galaxy population – barred, starbursting, irregular, and all other types of spirals – as might be seen at high redshift. Only the “kitchen sink” calibrations (with all spiral types and morphologies), such as those of Barton et al. (2001) or Kannappan et al. (2002), should be used in cosmological TF studies (provided the calibration uses unambiguous, high-quality, magnitudes and linewidths, and is free of Hubble flow distortions). The intrinsic scatter of “all-inclusive” TF calibrations, , is a full 01-02 higher than values often quoted in studies of TF evolution and cosmic flows. Standardization of calibration and analysis techniques is also quite important, as scatter depends strongly on techniques. Renewed interest has also been given in B-band TF calibrations which match the targets’ rest-frame luminosities. These calibrations have highest dispersions and are most sensitive to dust extinction corrections, thus complicating the work of TF practioners.
Other important effects to luminosities and linewidths of distant galaxies which would mimic TF evolution include variations of the dust/gas and mass-to-light ratios, truncation of rotation curves due to interactions or surface brightness dimming, etc. See CFS02 for more details.
Luminosity-linewidth studies of distant galaxies, though far from trivial, hold the promise of very exciting advancements in our understanding of the evolution of galaxy populations.
References
- (1) Barton, E.J., Geller, M.J., Bromley, B.C., van Zee, L., & Kenyon, S.J. 2001, AJ, 121, 625
- (2) Barton, E.J., & van Zee, L. 2001, ApJ, 550, L35; see also these proceedings
- (3) Charlot, S., & Longhetti, M. 2001, MNRAS, 323, 887
- (4) Courteau, S. 1992, Ph.D. thesis, University of California, Santa Cruz [C92]
- (5) Courteau, S. 1997, AJ, 114, 2402 [C97]
- (6) Courteau, S. & Faber, S.M., 1988, in The Extragalactic Distance Scale, eds. S. van den Bergh & C. Pritchet, (San Francisco: ASP), Vol. 4, 366
- (7) Courteau, S., Faber, S.M., & Sohn, Y.-J. 2002, in preparation [CFS02]
- (8) Courteau, S. & Rix, H.-W. 1999, ApJ, 513, 561
- (9) Guzman, R., et al. 1997, 1997, ApJ, 489, 559
- (10) Hammer, F., Gruel, N., Thuan, T.X., Flores, H., & Infante, L. 2001, ApJ, 550, 570
- (11) Jansen, R. A., Franx, M., & Fabricant, D. 2001, ApJ, 551, 825
- (12) Kannappan, S. J., Fabricant, D. G., & Franx, M., 2002, AJ, in press
- (13) Kennicutt, R.C. 1992, ApJ, 388, 310
- (14) Kobulnicky, H.A. & Gebhardt, K. 2000, ApJ, 119, 1608
- (15) Mathewson, D.S, Ford, V.L., & Buchhorn, M. 1992, ApJS, 81, 413
- (16) Prada, F. 1996, PASP, 108, 549
- (17) Patton, D.R. et al. 2002, ApJ, in press
- (18) Vogt, N.P., et al. 1997, ApJ, 479, L121