XMM-Newton observations of the Lockman Hole : Spectral analysis
Abstract
We present the results of the X-ray spectral analysis of the deep survey obtained with the XMM-Newton observatory on the Lockman Hole. The X-ray data and the cumulative source counts were reported by [*]JB-E1:has01. Our sample contains 104 sources with a count limit of 70 of which 55 have redshift identification. The redshift distribution peaks at 0.8, with a strong excess of low AGN and a deficiency of sources at 2 compared to population synthesis models for the X-ray background. The type 2 (obscured) AGN have weaker soft X-ray and optical fluxes. They cluster around 1. There is a clear separation between the classical/type 1 AGN and the obscured/type 2 ones in several diagnostics involving X-ray colour, X-ray flux, optical/near IR colour and optical brightness. Using the subsample, we show that this separation between the AGN populations is a consequence of different absorption column densities. The two populations have the same average spectral index, . At the 70 count detection limit, there is also a strong overlap between the two populations in hard X-ray flux and near IR brightness. These diagnostics should enable the classification of obscured/type 2 AGN very faint optically.
keywords:
Missions: surveys - X-ray: general - galaxies: nuclei1 Introduction
Recent deep X-ray surveys with the XMM-Newton and Chandra observatories have revealed an important population of obscured (type 2) active galactic nuclei (AGN) ([\astronciteHasinger et al.2001], [\astronciteBarger et al.2001], [\astronciteHornschemeier et al.2001], [\astronciteTozzi et al.2001], [\astronciteRosati et al.2001]). Objects of this class were already detected in the very deep ROSAT survey of the Lockman Hole region, with a few heavily obscured/type 2 AGN in the redshift range 1-3 and several type 2 AGN at ([\astronciteLehmann et al.2001]). This population accounts for the progressive hardening of the average X-ray spectrum towards fainter fluxes (see e.g. [\astronciteTozzi et al.2001]). From their source number counts in the hard X-ray band, [*]JB-E1:gia01 and [*]JB-E1:ros01 showed that a very significant fraction ( 85-90%) of the 2-10 keV X-ray background is resolved.
The first deep X-ray survey with XMM-Newton was obtained during Performance Verification. The observed field was centered on the Lockman Hole (LH), RA 10:52:43 and DEC +57:28:48 (J2000), and the exposure time for the good quality observations was 100 ksec. The X-ray data reduction and analysis (restricted to sources within a 10 radius) was reported by [*]JB-E1:has01 who show, in particular, that the sources could be classified by their X-ray colours.
The aim of this paper is to perform an X-ray spectral analysis of the LH sources and characterize their X-ray and optical/near IR properties. We thus search for relations between X-ray and/or optical physical parameters in the full X-ray sample and, using the subsample with redshift identification, check the validity of our conclusions concerning the specific properties of the obscured/type 2 AGN population.
2 The X-ray sample
From the deep XMM-Newton pointing, we selected the sample of 104 X-ray sources with a number of counts larger than 70 in the 0.5-10 keV energy band, of which 70 sources are within an off-axis angle of 10. This minimum number of counts is chosen as a compromise between the sample size and the accuracy of the X-ray spectral fit. Of these 104 sources, 60 were not detected by the ROSAT observatory. The SAS source detection algorithm was applied to PN data and the count extraction was performed using the Sextractor algorithm. The latter allows a determination of the ellipsoidal shape of the source (important tool, in particular for the outer regions of the field where there are strong distorsions of the PSF) and an easy subtraction of the neighbouring sources for the estimate of the source net counts. A detailed presentation of the data reduction is given in [*]JB-E1:mai02.
The Lockman Hole field was already extensively studied with ROSAT ([\astronciteHasinger et al.1998]) and ASCA ([\astronciteIshisaki et al.2001]) as well as at other wavelengths, including optical spectroscopic identification (see [\astronciteSchmidt et al.1998], [\astronciteLehmann et al.2001] and references therein). Excluding of the sample the two galaxy clusters and the eight stars, there remains 94 X-ray sources of which 55 have redshift identification.
3 The redshift distribution
Synthesis models for the X-ray background, using observational constraints mostly from ROSAT and ASCA surveys, predict a substantial population of type 2 AGN and a fairly broad redshift distribution which peaks at ([\astronciteGilli et al.2001]). In order to compare our results with those predicted by these authors, we use an extended sample of 119 AGN with a count limit of 50, of which 73 have known redshifts (completeness level of 61%). This count limit corresponds to a flux in the 0.5-2 keV band which is a factor of 2 higher than the models flux limit of erg cm-2 s-1. From the log N-log S distribution given by [*]JB-E1:toz01, we then estimate that there is a factor of in the cumulative counts between these two flux limits. The conclusions drawn below should thus be viewed as preliminary.
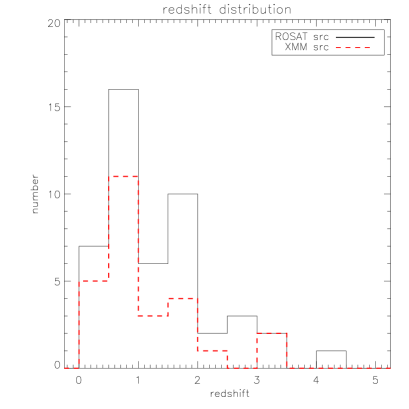
The distribution of the LH sources is shown in Figure 1. In our subsample, there are 53% of the sources at and only 15% at . This distribution, which peaks at , markedly differs from the predicted ones, with a strong excess of low AGN and a deficiency of high ones. Even if all the LH unidentified sources were at 1, there would still be 33% of the LH sources at 1 compared to the 10.5-15% in the models. Such a discrepancy between predictions and observations was already noted by [*]JB-E1:ros01 for the 1 Msec Chandra survey of the Chandra Deep Field South (CDFS).
4 Spectral analysis
We use xftools to extract individual spectra and perform the spectral analysis. In this preliminary study, we assume a simple model for the spectral fit: a single power law of photon index and a column density . In the analysis presented by [*]JB-E1:mai02, an additional component is introduced when there is an unambiguous soft X-ray excess. The minimum value of is that of the low Galactic Hydrogen column density towards the LH field, cm-2 ([\astronciteLockman et al.1986]).
We use the results of the spectral analysis, in particular the subsample with , to confirm the different properties of the classical and obscured AGN populations when studying the whole X-ray sample.
4.1 Hardness ratios
X-ray colours are usually represented by hardness ratios, where and correspond to the counts in the harder and softer energy bands respectively. In the X-ray colour-colour diagrams presented by [*]JB-E1:has01, there is a clear separation of the type 1 and type 2 ROSAT sources. Moreover, a large fraction of the XMM-Newton only sources, typically fainter than the ROSAT ones, fill the same colour-colour space than the ROSAT type 2 sources.
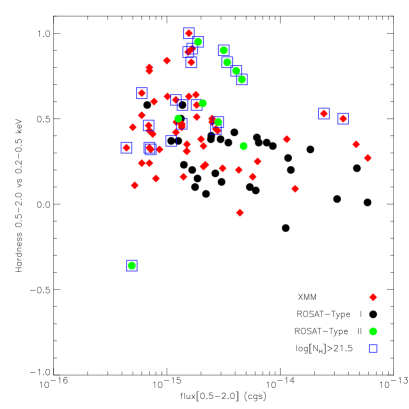
We consider X-ray colour versus X-ray flux diagrams to identify which ones show a clearer separation between the different AGN populations. The latter are presented in Figures 2 and 3. The obscured sources with have specific labels. For the type 1 AGN, we get (0.5-2 keV vs 0.2-0.5 keV) whereas for most of the type 2 AGN we get values of this larger than 0.5. The large majority of the obscured sources overlap with the type 2 AGN. One should note that there are two type 1 AGN with large and some of the obscured XMM-Newton sources with similar values of could also belong to that subclass of objects.
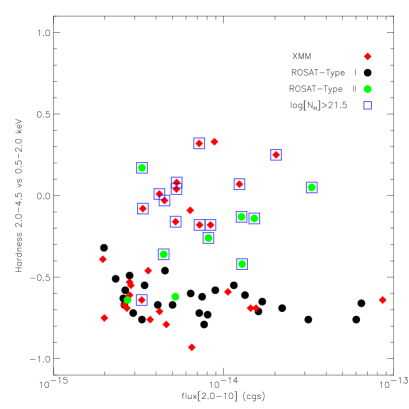
An even clearer diagnostic is obtained with (2-4.5 keV vs 0.5-2 keV) shown as a function of (2-10 keV). The type 1 AGN cluster around (2-4.5 keV vs 0.5-2 keV), but the type 2 AGN, as well as all the obscured sources but one, span a large range from to +0.3.
These results demonstrate that there is a marked separation between the two AGN populations in the X-ray colour versus X-ray flux diagrams, and that this is mostly due to differences in the absorption column density.
4.2 Spectral index and column density
The spectral analysis is performed for both the subsample, which leads to proper values of and in the source rest-frame, and the complete sample for which observed values of and are then obtained. Results are shown in Figures 4 and 5.
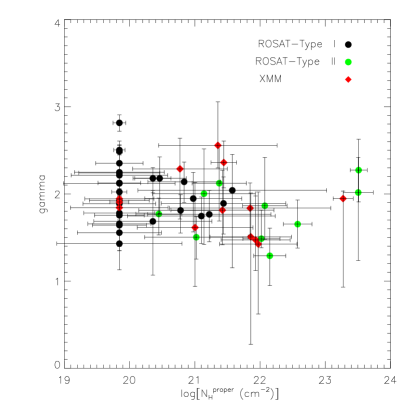
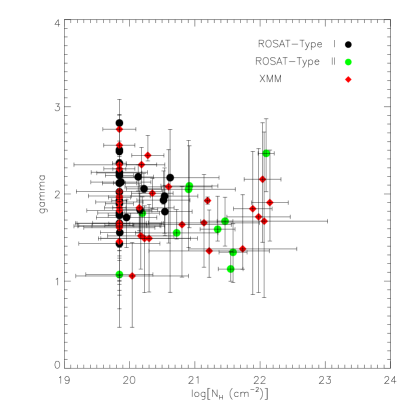
In both diagrams, the type 1 and 2 AGN populations occupy different loci in . For the subsample, the bimodal distribution appears to also apply to . This result is most probably an artefact due to the presence of a strong soft X-ray excess in several of the type 2 AGN. When this additional component is introduced in the spectral analysis, the values obtained for both and are then larger (see [\astronciteMainieri et al.2002]).
The average values of derived for both the subsample and the complete sample are similar, with a large spread of . The difference between the two samples is thus mainly in , not in . These results differ from those obtained from observed, stacked spectra for which the signature of absorption column density is washed out (mainly a redshift effect) and the average value of is thus lower ([\astronciteTozzi et al.2001]). Our analysis confirms that the trend found by these authors of a hardening of the stacked spectra (decrease of ) with decreasing X-ray flux in the band 2-10 keV is indeed a consequence of an increasing fraction of obscured sources at fainter flux levels.
From the optical identifications, we note that among the obscured sources of the subsample there are 3 type 1 AGN (of which one not detected by ROSAT) and several XMM-Newton only sources. In the whole sample, the XMM-Newton only sources belong to several populations: type 2 AGN, EROs (RK), and those with low values of could be faint type 1 AGN or high type 2 AGN.
5 X-ray and optical properties
Another parameter, the optical/near IR colour, helps to distinguish between the two types of AGN as shown by [*]JB-E1:has99 and [*]JB-E1:leh01 in their analyses of the ROSAT deep survey of the Lockman Hole, and also recently by [*]JB-E1:bar01 and [*]JB-E1:ros01 in their studies of the Chandra deep surveys of the CDFN and CDFS respectively. We perform a similar analysis on the XMM-Newton LH field data.
5.1 Optical colours
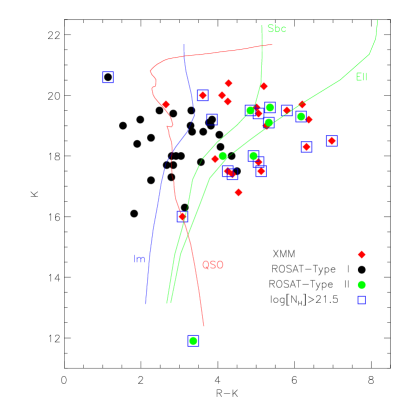
In Figures 6 and 7, we present the RK colour versus R and K respectively. Data are available for about one half of the 70 count limit sample. The evolutionary tracks shown for the various types of galaxies are taken from [*]JB-E1:col80. Their spectral energy distributions (SED) were extended to the near-IR using the models of [*]JB-E1:bc93 as updated in 2000 (private communication). The QSO evolutionary track is derived from the empirical template from the Sloan Digital Sky Survey ([\astronciteVanden Berk et al.2001]), together with the models of [*]JB-E1:gra97, normalized to , for the extension in the near IR.
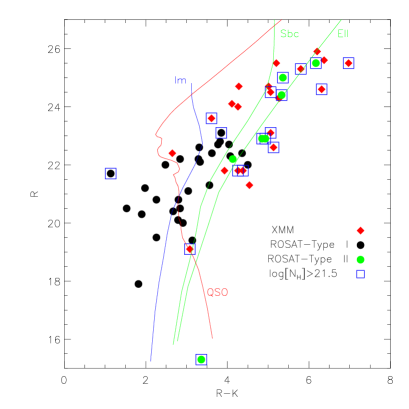
The classical AGN roughly cluster around the QSO evolutionary track, whereas the type 2 and obscured AGN are clearly fainter and redder objects, most with R 22 and RK 4. The nuclei of the latter, being obscured, do not substantially contribute to the total R magnitude, nucleus + host. These objects cluster around the E and Sbc galaxy evolutionary tracks and are thus embedded in galaxies of various morphological types. These conclusions are in full agreement with the results of HST imaging of the CDFS for their “brigther” population ([\astronciteSchreier et al.2001], [\astronciteKoekemoer et al.2001]).
Although present, the separation between the different AGN populations in the RK versus K colour diagram is not as striking as in the previous one. There is a strong overlap in K magnitude between the two populations. Although the type 2 and obscured AGN populations still roughly cluster around E and Sbc SED evolutionary tracks, the scatter is larger.
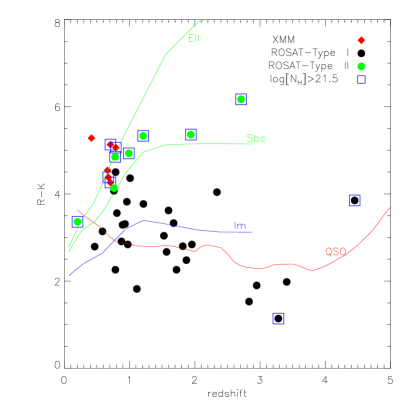
The relation between colour, RK, and redshift is shown in Figure 8. The type 1 AGN span a wide redshift range whereas the type 2 AGN, together with the majority of the obscured ones, cluster around 1 as already noted for the CDFS sources ([\astronciteRosati et al.2001]).
5.2 X-ray and optical fluxes
To further characterize the properties of the different X-ray populations, we investigate the relations between their X-ray flux and optical magnitude.
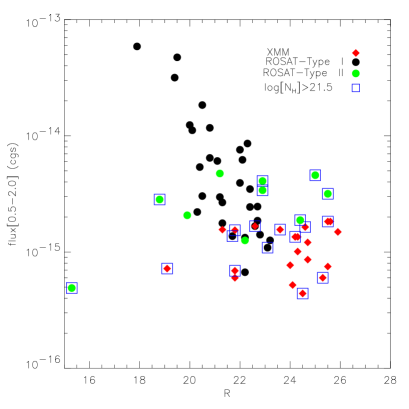
As could be seen in Figure 9, there is a clear trend of increasing soft X-ray flux with optical brightness, this correlation being tighter for the type 1 AGN. For classical quasars, the correlation between X-ray and optical emission is indeed known since the first quasar surveys with the Einstein observatory ([\astronciteZamorani et al.1981]). The type 2 and obscured AGN, as well as the XMM-Newton only sources, have fainter soft X-ray fluxes and R magnitudes than the type 1 AGN and a fairly large scatter in both parameters.
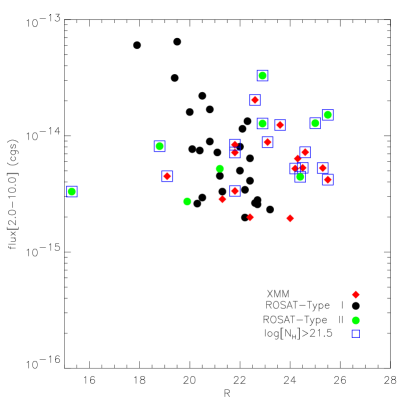
This separation in X-ray flux is no longer present for the hard X-ray band (see Figure 10). The trend observed in the previous diagram is indeed a consequence of higher absorption column densities for type 2 AGN, as well as most XMM-Newton only sources, and not smaller broad-band X-ray fluxes.
6 Conclusions
We have derived the X-ray spectral properties of the sources detected by XMM-Newton in the Lockman Hole. The X-ray data reduction, analysis of the source counts and X-ray colour-colour diagnostics were reported by [*]JB-E1:has01. The sample contains 104 sources at a count limit of 70, which corresponds to a flux of (0.69 and 3.9) erg cm-2 s-1 in the 0.5-2 and 2-10 keV band respectively. It comprises 94 AGN of which 55 have redshift identification. Making use of the subsample in several X-ray and/or optical diagnostics, we could characterize the different populations of AGN. Our main results are as follows.
-
•
The clearer separation between the classical/type 1 AGN and the obscured/type 2 AGN is present in the diagrams X-ray colour, (2-4.5 keV vs 0.5-2 keV), versus hard (2-10 keV) X-ray flux, optical R magnitude versus optical/near IR colour, RK, and soft (0.5-2 keV) X-ray flux versus R magnitude.
-
•
In these diagnostic diagrams, most of the XMM-Newton only sources overlap with the ROSAT obscured/type 2 AGN and the scatter for these two classes of objects is much larger than that for the classical/type 1 AGN.
-
•
The differences in parameter space between the type 1 and obscured/type 2 AGN is essentially due to the absorption column density.
-
•
The average photon spectral index is for both type 1 and 2 AGN.
-
•
The obscured/type 2 AGN population is fainter than the classical/type 1 AGN population in the soft X-ray band and optical range, but the two populations have similar hard X-ray fluxes and K magnitudes.
-
•
The redshift distribution, built from a 50 count limit sample (119 AGN of which 73 with redshift), peaks at 0.8. As previously noted by [*]JB-E1:ros01, there is a strong excess of low AGN and a deficiency of sources at 2 compared to population synthesis models for the X-ray background. The obscured/type 2 AGN cluster at 0.8.
A similar analysis will be applied to the XMM-Newton deep survey of the CDFS (observations in progress) to characterize and classify the different AGN populations, and in particular to the objects optically too faint to get spectroscopic redshifts.
Acknowledgements.
The results described here were made possible by the dedication of the XMM-Newton team in quickly producing well-calibrated Performance Verification data. G. Hasinger and I. Lehmann acknowledge support from the DLR grant 50 OR 9908.References
- [\astronciteBarger et al.2001] Barger, A.J., Cowie, L.L., Mushotzky, R.F., & Richards, E.A. 2001, AJ, 121, 662
- [\astronciteBruzual & Charlot1993] Bruzual, A.G., & Charlot, S. 1993, ApJ, 405, 538
- [\astronciteColeman et al.1980] Coleman, G.D., Wu, C.C., & Weedman, D.W. 1980, ApJS, 43, 393
- [\astronciteGiacconi et al.2001] Giacconi, R., Rosati, P., Tozzi, P., et al. 2001, ApJ, 551, 624
- [\astronciteGilli et al.2001] Gilli, R., Salvati, M., & Hasinger, G. 2001, A&A, 366, 407
- [\astronciteGranato et al.1997] Granato, G.L., Danese, L., & Franceschini, A. 1997, ApJ, 486, 147
- [\astronciteHasinger et al.2001] Hasinger, G., Altieri, B., Arnaud, M., et al. 2001, A&A, 365, L45
- [\astronciteHasinger et al.1998] Hasinger, G., Burg, R., Giacconi, R., et al. 1998, A&A, 329, 482
- [\astronciteHasinger et al.1999] Hasinger, G., Lehmann, I., Giacconi, R., et al. 1999, Proceedings of the Symposium ”Highlights in X-ray Astronomy” in honour of Joachim Truemper’s 65th birthday, eds. B. Aschenbach & M.J. Freyberg, 1999, MPE Report 272, p. 199 [astro-ph/9901103]
- [\astronciteHornschemeier et al.2001] Hornschemeier, A.E., Brandt, W.N., Garmire, G.P., et al. 2001, ApJ, 554, 742
- [\astronciteIshisaki et al.2001] Ishisaki, Y., Ueda, Y., Yamashita, A., et al. 2001, PASJ, 53, 445
- [\astronciteKoekemoer et al.2001] Koekemoer, A.M., Grogin, N.A., Schreier, E.J., et al. 2001, ApJ, in press [astro-ph/0110385]
- [\astronciteLehmann et al.2001] Lehmann, I., Hasinger, G., Schmidt, M., et al. 2001, A&A, 371, 833
- [\astronciteLockman et al.1986] Lockman, F.J., Jahoda, K., & McCammon, D. 1986, ApJ, 302, 432
- [\astronciteMainieri et al.2002] Mainieri, V., Bergeron, J., Rosati, P., et al. 2002, in preparation
- [\astronciteRosati et al.2001] Rosati, P., Tozzi, P., Giacconi, R., et al. 2001, ApJ, in press [astro-ph/0110452]
- [\astronciteSchmidt et al.1998] Schmidt, M., Hasinger, G., Gunn, J., et al. 1998, A&A, 329, 495
- [\astronciteSchreier et al.2001] Schreier, E.J., Koekemoer, A.M., Grogin, N.A., et al. 2001, ApJ, 560, 127
- [\astronciteTozzi et al.2001] Tozzi, P., Rosati, P., Nonino, M., et al. 2001, ApJ, 562, 42
- [\astronciteVanden Berk et al.2001] Vanden Berk, D.E., Richards, G.T., Bauer, A., et al. 2001, AJ, 122, 549
- [\astronciteZamorani et al.1981] Zamorani, G., Henry, J.P., Maccacaro, T., et al. 1981, ApJ, 245, 357