A synoptic spectral study of Cassiopeia-A based on XMM-Newton and BeppoSax observations.
Abstract
In this paper we present recent image and spectral data of Cas-A obtained with XMM-Newton and BeppoSAX, which were used to further constrain the physical characteristics of the source. We analysed the hard X-ray continuum images between 8 and 15 keV. The data indicate that the hard X-ray tail, observed previously, does not originate in localised regions as demonstrated by the rather flat hardness ratio map of the 10-15 and 8-10 keV energy bands. This result does not support an interpretation of the hard X-radiation as synchrotron emission produced in the primary shock, non-thermal Bremsstrahlung is a plausible alternative. Moreover, a recent 500 kilosecond deep observation of the hard X-ray continuum by BeppoSAX has revealed the positive detection of the 44Sc nuclear decay lines at 67.9 and 78.4 keV. Appropriate modelling of the hard X-ray continuum leads to an estimate of the initial 44Ti mass of M. This implies, by employing available nucleosynthesis models for type II SNe, a progenitor mass of 30 M. We also present a, spatially resolved, spectral analysis of the thermal emission of Cas-A using detailed spectral fitting on a 20\arcsec20\arcsecpixel scale. This yields maps of the ionisation age, temperature, abundances for Ne, Mg, Si, S, Ar, Ca, Fe and Ni. The observed elemental abundance ratio patterns can be reconciled best with a type Ib SNe, arising from a 60 M progenitor (ZAMS) with high-mass-loss, which may also explain the relatively high 44Ti yield. The accurate modeling of the image-resolved emission line spectra has enabled us to derive reliable Doppler velocities for the bright Si-K, S-K, and Fe-K line complexes. The combination of radial positions in the plane of the sky and the line of sight velocities have been used to assess the dynamics of the X-ray emitting plasma. This indicates a rather asymmetric explosion geometry, in which the hot Fe-K emitting gas possibly originates from shock-heated ablated ejecta material, rather than from circumstellar plasma heated by the primary blast wave.
keywords:
ISM: supernova remnants – ISM: individual: Cas A1 Introduction
The young galactic supernova remnant (SNR) Cassiopeia A (Cas A) is widely believed to be the result of a core collapse supernova (SN) observed by Flamsteed in 1680 ([\astronciteAsworth1980]), probably due to the core collapse of an early type Wolf-Rayet star ([\astronciteFesen et al.1987]). Cas A is classified as an oxygen rich remnant since optical spectroscopic observations ([\astronciteChevalier & Kirshner1979]) show the supernova ejecta (in the form of fast moving knots) to contain mostly oxygen and oxygen burning products such as sulphur, argon and calcium. A Wolf-Rayet star progenitor is supported by X-ray data which, when taking into account that most bremsstrahlung is caused by electrons interacting with almost completely ionized oxygen, gives a rather low ejecta mass of M([\astronciteVink et al.1996]). At all wavelengths Cas A has the appearance of a broken shell with a radius varying between 1.6\arcmin to 2.5\arcmin.
In this overview of spectral studies of Cas A we highlight the the salient features of the XMM-Newton X-ray observatory for SNR research: (i) an outstanding spectral grasp brought about by the large effective collecting area, bandwidth and spectral resolving power of the X-ray telescopes, (ii) an unprecedented high energy response which allows high quality X-ray imaging up to 15 keV, (iii) an unique capability for high resolution (R100) spectroscopy of moderately extended sources. The medium resolution spatially resolved spectroscopy of Cas A with the solid state (EPIC-MOS and EPIC-PN) X-ray camera’s of XMM-Newton ([\astronciteWillingale et al.2002]) provides a powerful tool to study in detail the dynamics, the distribution and the physical properties of the (reverse) shock heated plasma, while the bandwidth (up to 15 keV) offers an unique opportunity to assess the origin of the hard X-ray continuum ([\astronciteBleeker et al.2001]). We also report on a recent deep exposure of Cas A with the BeppoSAX observatory. This observation gives a reliable estimate of the nuclear de-excitiation lines of 44Sc at 67.9 keV and 78.4 keV, produced in the decay chain 44Ti44Sc44Ca. The detection of these lines and the abundance patterns obtained from the EPIC-MOS analysis provides independant measures of the zero-age-main-sequence (ZAMS) progenitor mass.
2 Origin of the hard X-ray continuum
One of the outstanding problems in the study of Cas A is the origin of a recently discovered hard X-ray continuum out to 100 keV in the spectrum of this remnant (e.g. [\astronciteThe et al.1996]; [\astronciteFavata et al.1997]; [\astronciteAllen et al.1997]). From a theoretical point of view both synchrotron emission from shock accelerated electrons and non-thermal Bremsstrahlung from electrons accelerated into a tail of the Maxwellian velocity distribution could be possible explanations for the hard continuum. Previous hard X-ray imaging observations, for example using BeppoSAX ([\astronciteVink et al.1999]), indicated that the hard continuum radiation originated predominantly in the West region of the remnant, however this result was based on deconvolved images from a typically 1-arcminute resolution telescope with moderate effective area. The combination of large collecting area in the energy band 4.0 to 15.0 keV and the angular resolution of a few arcseconds of XMM-Newton provides a unique opportunity to search for the distribution and origin of this hard “tail”.
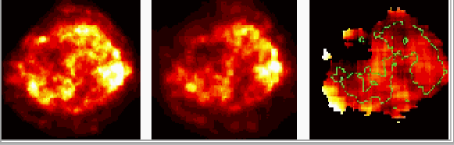
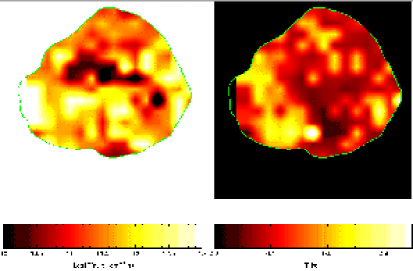
XMM-Newton clearly detects the hard X-ray tail from the remnant but the hard X-ray image (8-15 keV) displays a remarkably similar brightness distribution to the softer thermal components, which presumably dominate the 4-6 keV continuum emission as shown in figure 1 (centre and left respectively). Spectral fits to the Cas A data ([\astronciteBleeker et al.2001]) indicate that the ratio between a powerlaw and thermal Bremsstrahlung components runs from about 1 in the 8-10 keV interval to about 3 in the 10-15 keV band. A hardness ratio map (10-15)/(8-10) is shown in figure 1 (right). Although this map shows significant changes in hardness over the remnant, all the bright features within the green contour have a remarkably similar spectrum above 8 keV. Therefore the hard X-ray image and the hardness ratio indicate clearly that this flux does not predominate in a few localised regions, as would be expected from straightforward synchrotron emission models, e.g. a limb brightened shell commensurate with the radio morphology. Apparently the hard X-ray emission pervades the whole remnant with a distribution similar to the thermal continuum emission. In conclusion, while the spectral form of the non-thermal high-energy “tail” is not inconsistent with a simple model of synchrotron emission from SNRs ([\astronciteReynolds1998]), the morphology of the hard X-ray image does not support this interpretation in any way. An alternative explanation for the observation of hard X-ray tails in the spectra of supernova remnants is the presence of non-thermal Bremsstrahlung generated by a population of suprathermal electrons ([\astronciteAsvarov et al.1989]; [\astronciteLaming2000]).
3 44Sc line emission and the hard X-ray continuum
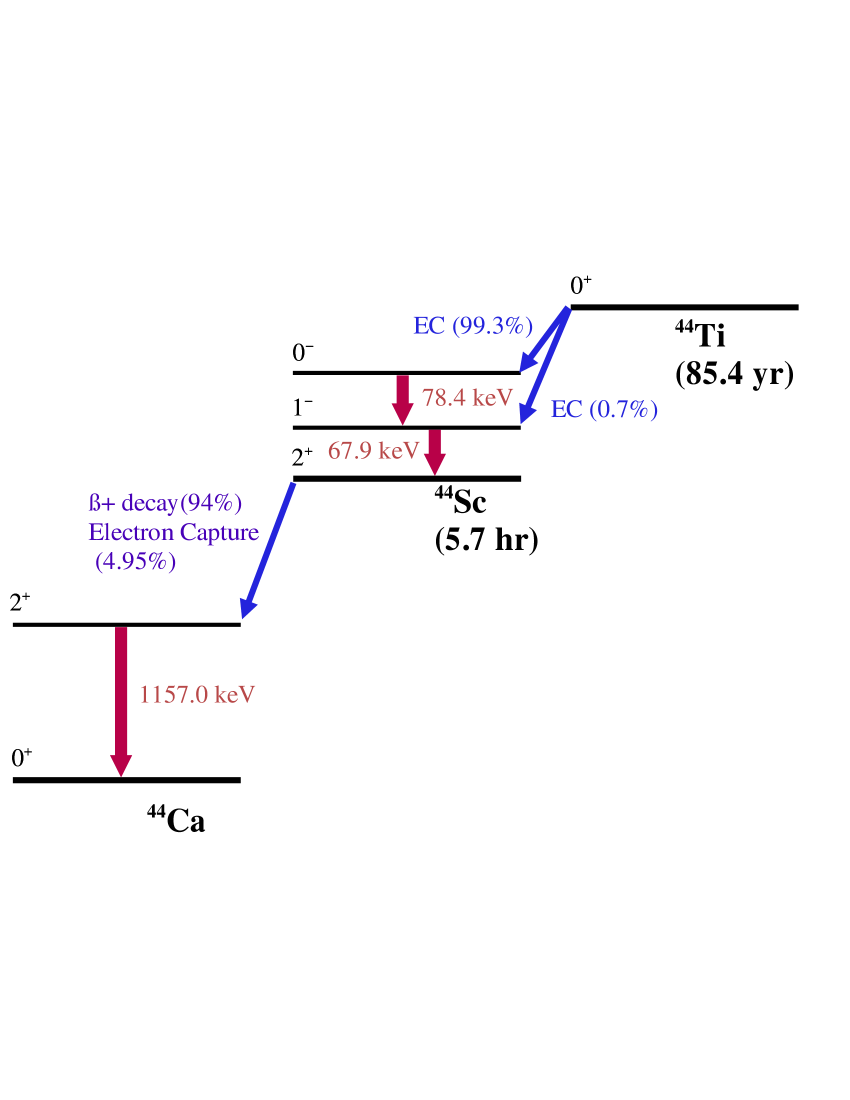
Observing the nuclear decay emission associated with 44Ti (see figure 2) is probably the most direct way of observing the abundance of an element for a young supernova remnant. It does not depend on plasma properties, and temperature, except in the very unlikely case that 44Ti is almost completely ionized, which requires too high a temperature ([\astronciteLaming2001b]). If we know the distance to Cas A and the decay time of 44Ti, which has recently been measured accurately to be yr ([\astronciteAhmad et al.1998, \astronciteGörres et al.1998, \astronciteNorman et al.1998]), calculation of the initial 44Ti mass is straightforward.
Compared to other abundantly produced radio-active elements it has a relatively long decay time, which makes this the primary energy source for late time light curves of supernovae; in SN1987A this occurred after 2000 days, when most of the 56Co had decayed ([\astronciteDiehl & Timmes1998]). Its main importance is, however, the diagnostics it provides for Type II supernova explosions. 44Ti is thought to be synthesized during explosive Si burning, as the expanding plasma cools in the presence of sufficiently abundant, free particles, which is the case at relatively low densities ([\astronciteDiehl & Timmes1998];[\astronciteThe et al.1998]). This process is referred to as -rich freeze out. As a consequence, its synthesis is very sensitive to the kinetic energy and asymetries of the explosion ([\astronciteNagataki et al.1998]). Moreover, the amount of 44Ti ejected depends on the position of the mass-cut, the border that divides the material falling back on the neutron star and that being ejected. Also the mass-cut depends both on the energy of the explosion, and the mass of the progenitor; the expansion velocity is larger for less massive progenitors, which allows more core material to escape the gravitational potential of the neutron star or black hole.
The detection of 1157 keV line emission by CGRO-COMPTEL ([\astronciteIyudin et al.1994]), was the first time that the presence of 44Ti in supernova remnants was actually observed. However, subsequent searches with hard X-ray detectors for the 44Sc line emission at 68 keV and 78 keV did not confirm the presence of 44Ti at the expected flux level. A deep (500 ks) observation of Cas A with BeppoSAX, combined with archival data, has provided us with a net Phoswhich Detector System (PDS) spectrum of 311 ks (the PDS efficiency is 50%, as always one of the two rocking collimators is measuring a 210\arcmin off source background).
As reported by [*]jbleeker-B2:vin01 the deep observation resulted in a larger than 3.4 detection of the 44Sc lines, each with a flux of (90% error). This compares well with a more recent CGRO-COMPTEL measurement of ([\astronciteIyudin1997]). Combining the two measurements suggest an initial 44Ti mass of M, with a 90% uncertainty range of M.
The major uncertainty in measuring the 44Sc flux is the contribution of the hard X-ray continuum to the spectrum around 70 keV, due to the uncertain nature of the hard X-ray emission already addressed in the previous paragraph. [*]jbleeker-B2:vin01 employed various models, including a hard X-ray synchrotron model. Here we expand on that measurement by using a model spectrum that includes a non-thermal bremsstrahlung continuum caused by electrons accelerated by lower hybrid waves, a process that is likely to be most efficient in the presence of heavy nuclei, which suggest that the hard X-ray emission originates from material heated by the reverse shock ([\astronciteLaming2000, \astronciteLaming2001a]). Note that this model is different from that proposed by [*]jbleeker-B2:asv89, who suggest that the non-thermal electrons are the non-relativistic part of the electron cosmic ray population.
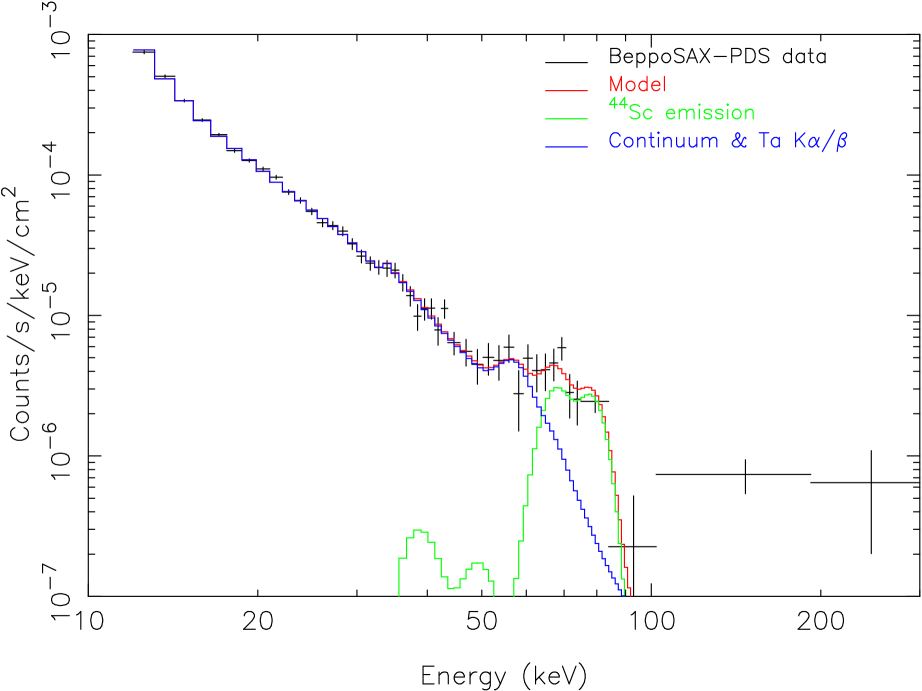
The bremsstrahlung model was calculated using fully relativistic gaunt factors and, apart from the non-thermal continuum, a 3.5 keV thermal component was included and Ta K and K line emission, originating in the PDS collimator, which consists of tantalum.
The best fit non-thermal model has and suggests a maximum electron acceleration of 95 keV (figure 3). As the continuum drops near the 44Sc emission the inferred line contribution is larger (( ). This is very close to the latest COMPTEL results, and implies an initial 44Ti mass of M. However, the model does not fit the data above 100 keV well. This may not be too much of a problem, since the statistics above 100 keV is poor and the signal may still be contaminated by residual background. However, assuming that most of the hard X-ray emission is indeed caused by electrons accelerated by lower hybrid waves, additional components, such as the one proposed by [*]jbleeker-B2:asv89, or inverse Compton radiation (see e.g. [*]jbleeker-B2:all97), are likely to be present at some level.
What is the implication of the observed amount of 44Ti ? Comparing it to the predicted 44Ti mass ([\astronciteWoosley & Weaver1995, \astronciteTimmes et al.1996]), it seems that the actual 44Ti mass is higher than expected, except perhaps models S30B, S35C and S40C of [*]jbleeker-B2:wv95, which model explosions with more than ergs of kinetic energy. Apart from energetics, the 44Ti results for Cas A may be explained by pre-supernova mass loss, as is expected to be the case for type Ib SNe ([\astronciteTimmes et al.1996]). Moreover, an asymmetric explosion would also contribute to a larger 44Ti abundance. In fact, from the following sections it will become clear that the Cas A explosion indeed displays a high degree of asymmetry. Less certain is whether Cas A may also have been a much more energetic explosion.
4 Plasma physics and dynamics
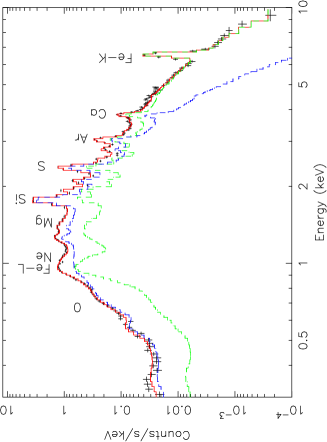
The brightness of Cas A coupled to a long exposure of XMM-Newton’s solid state cameras makes it possible to do a detailed X-ray spectral analysis with an angular resolution of 20 arcseconds over the the full extent of the remnant. The energy resolution, gain stability and gain uniformity of the EPIC-MOS-cameras allows significant detection of emission line energy shifts of order 1 eV or greater for prominent emission lines like Si-K, S-K and Fe-K. Proper modeling of these line blends with the aid of broad band spectral fitting, taking into account the non-equilibrium ionisation (NEI) balance, allows an assessment of Doppler shifts and abundance variations of the X-ray emitting material across the face of the remnant with adequate spatial resolving power. Two NEI components for the thermal emission were used as a minimum for representative spectral modeling. In addition the model accounts for two separate redshifts (one for each plasma component) and the amount of foreground absorption as free parameters. Figure 4 shows a typical spectral fit.
4.1 Temperature and Ionisation Age
The temperature distribution of the 2 NEI components are similar (but not the same). The temperature for the cool component ranges between 0.3-1 keV, displayed in figure 5, and those for the hot component between 2-6 keV. These values are similar to values obtained by [*]jbleeker-B2:vin96 for a coarse subdivision of the remnant in five regions.
A map of the ionisation age of the cool component is also given in figure 5 and shows a large spread of cm-3s. For ionisation ages larger than cm-3s the plasma is almost in ionisation equilibrium and cannot be distinguished from equilibrium spectra. There is also a region of very low ionisation age (less than cm-3s) stretching from East to West just above the centre of the remnant. This region also has a low emissivity and can be understood as a low density wake just behind and inside of the shocked ejecta. The hot component has a more homogeneous ionisation age distribution centered around cm-3s (not shown).
4.2 Elemental abundances
Figure 6 is a montage of abundance maps of Ne, Mg, Si, S, Ar, Ca, Fe-L, Fe-K and Ni, where the abundance values are with respect to solar. Again we see considerable variations over the remnant. The Fe-L distribution comes from the cool component while the Fe-K and Ni are derived exclusively from the hot component.
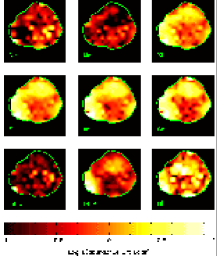
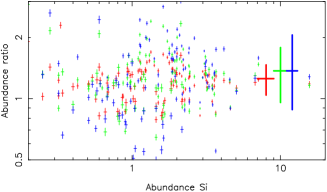
The distributions of Si, S, Ar and Ca, which are all oxygen burning products, are similar and distinct from carbon burning products, Ne and Mg, and Fe-L. Figure 7 shows the variation in the ratios S/Si, Ar/Si and Ca/Si with respect to the abundance of Si. On the one hand these ratios clearly vary over the remnant but on the other hand, for a Si abundance range spanning more than two orders of magnitude, these ratios remain remarkably constant. The thick vertical bars indicate the mean and rms scatter of the ratio values.
The models for nucleosynthesis yield from massive stars predict that the mass or abundance ratio of ejected mass of any element X with respect to silicon varies significantly as a function of the progenitor mass . We show the observed mean values of as well as its rms variation in Table 1, together with the predictions for core collapse SNe models with a progenitor mass of 12, 30 M (ZAMS) and for a type Ib model with a progenitor mass of 60 M (ZAMS). The model for the 60 M star included mass loss, in order to mimic a Type Ib supernova. Abundance values for the 12 and 30 M progenitors are taken from [*]jbleeker-B2:wv95, while those for the 60 M progenitor are taken from [*]jbleeker-B2:woo93.
| ratio | mean | rms | 12 M | 30 M | 60 |
|---|---|---|---|---|---|
| O/Si | 1.69 | 1.37 | 0.16 | 1.88 | 0.71 |
| Ne/Si | 0.24 | 0.37 | 0.12 | 1.24 | 0.43 |
| Mg/Si | 0.16 | 0.15 | 0.12 | 2.08 | 0.26 |
| S/Si | 1.25 | 0.24 | 1.53 | 0.21 | 1.33 |
| Ar/Si | 1.38 | 0.48 | 2.04 | 0.13 | 1.02 |
| Ca/Si | 1.46 | 0.68 | 1.62 | 0.11 | 1.09 |
| FeL/Si | 0.19 | 0.65 | 0.23 | 0.08 | 0.65 |
| FeK/Si | 0.60 | 0.51 | 0.23 | 0.08 | 0.65 |
| Ni/Si | 1.67 | 5.52 | 0.68 | 0.29 |
The observed abundance ratios for X equal to Ne, Mg, S, Ar, Ca and Fe-L (related to the iron emissivity of the cool component) are consistent with a low progenitor mass of type II 12 M model, but the observed O ratio is an order of magnitude larger than predicted. The type II 30 M model predicts the correct O ratio, but does not produce the observed ratios observed in the other elements. The best overall agreement of observed abundance ratios are provided by the type Ib 60 M model. In all these models, most of the Si, S, Ar and Ca comes from the zones where complete explosive O-burning and incomplete explosive Si-burning occurs, and indeed as figure 7 shows these elements track each other remarkably well. The correlation between Si and S is remarkably sharp but not perfect, the scatter in figure 7 is real. These remaining residuals can be attributed to small inhomogeneities. Table 1 also indicate that the rms scatter of the abundances with respect to Si get larger as Z increases, S to Ar to Ca and indeed through to Fe and Ni. This is to be expected since elements close together in Z are produced in the same layers within the shock collapse structure while those of very different Z are produced in different layers and at different temperatures.
The Fe which arises from complete and incomplete explosive Si burning, together with existing Fe, should give rise to iron line emission. For both the Fe-L and Fe-K lines we see that iron abundance varies over the remnant but does not show any straightforward correlation with either the other elements (there is a very large scatter in ) or relative to each other. This is to be expected if most of the iron arises from complete Si burning. We return to the different morphologies of Si and Fe later in the discussion.
Ne and Mg are mostly produced in shells where Ne/C burning occurs, and the relative scatter in terms of is indeed much larger than for S, Ar and Ca (Table 1). Furthermore the abundance maps of Ne and Mg in figure 6 are mutually similar but very different from the Si, S, Ar and Ca group.
It should be noted that the derivation of O/Si ratio is difficult and less reliable than the other ratio’s due to the strong galactic absorption and the poor spectral resolution of the EPIC camera’s at low energies. The high resolution XMM RGS maps resolve the O distribution much more clearly and show that this differs from the other elements ([\astronciteBleeker et al.2001]). We discuss this briefly in section 5.
4.3 Dynamics
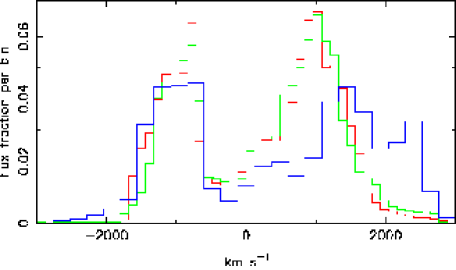
It is possible to determine the Doppler shifts of Si-K, S-K and Fe-K since these lines are strong and well resolved. Doppler shifts of these lines have been calculated by taking advantage of the ionisation age information supplied by the model fits. After fits were made to the full spectrum we froze all the fit parameters. We selected the Si-K (1.72-1.96 keV), S-K (2.29-2.58 keV) and Fe-K (6.20-6.92 keV) bands for determining their respective Doppler velocities while ignoring all other line emission. We then do a fit to each line separately by starting from the full fit model parameters as a template and subsequently allowing only the redshift and the abundance of the relevant element to vary. This method provides a fine tuning of the redshift which in turn gives the Doppler velocity of the element under scrutiny. Figure 8 shows the resulting line flux images colour coded with the Doppler velocity. The bottom left image is the colour coding used.
The Doppler shifts seen in different areas of the remnant are very similar in the three lines. The knots in the South East are blue shifted and the knots in the North are red shifted. This is consistent with previous measurements ([\astronciteMarkert et al.1983], [\astronciteHolt et al.1994], [\astronciteVink et al.1996]). Moving from large radii towards the centre the shift generally gets larger as expected in projection. This is particularly pronounced in the North. At the outer edges the knots are stationary or slightly blue shifted. Moving South a region of red shift is reached indicating these inner knots are on the far side of the remnant moving away from us. The distributions of flux as a function of Doppler velocity are shown in figure 9. The distributions for Si-K and S-K are very similar. The Fe-K clearly has a slightly broader distribution for the red shifted (+ve) velocities. This plot was quite sensitive to small systematic changes in temperature, ionisation age or abundances in the spectral fitting since these can potentially have a profound effect on the derived Doppler velocities. This emphasises the point that detailed modeling is an essential prerequisite to arrive at proper conclusions.
The X-ray knots of Cas A form a ring because the emitting plasma is confined to an irregular shell. [*]jbleeker-B2:wil02 calculated a best fit centre to this ring looking for the position that gave the most strongly peaked radial brightness distribution (minimum rms scatter of flux about the mean radius). The best centre for the combined Si-K, S-K and Fe-K line image was 13 arc second West and 11 arc seconds North of the image centre (the central Chandra point source). Using this centre the peak flux occurred at a radius of 102 arc secs, the mean radius was 97 arc secs and the rms scatter about the mean radius was 24 arc seconds.
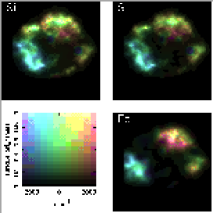
The left-hand panel of figure 10 is a composite image of the remnant seen in the Si-K, S-K and Fe-K emission lines. The solid circle indicates the arc seconds and the dashed circle is the mean radius of the Si-K and S-K flux arc seconds. The X-ray image of the remnant provides coordinates x-y in the plane of the sky. Using the derived radial velocity field within the remnant we can use the measured Doppler velocities to give us an estimate of the z coordinate position of the emitting material along the line of sight thus giving us an x-y-z coordinate for the emission line flux in each pixel. Using these coordinates we can reproject the flux into any plane we choose. The right-hand panel of figure 10 shows such a projection in a plane containing the line-of-sight, North upwards, observer to the right.
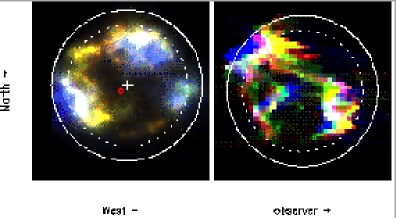
In this reprojection the line emission from Si-K, S-K and Fe-K are reasonably well aligned for the main ring of knots. The reprojection is not perfect because the EPIC-MOS cameras are unable to resolve components which overlap along the line-of-sight and this produces some ghosting just North of the centre of the remnant. In the plane of the sky Fe-K emission (blue) is clearly visible to the East between the mean radius of the Si+S flux and the shock radius. Similarly in the reprojection Fe-K emission is seen outside the main ring in the North away from the observer. The Si+S knot in the South away from the observer in the reprojection is formed from low surface brightens emission in the South West quadrant of the sky image. The X-ray emitting material is very clumpy within the spherical volume and is indeed surprisingly well characterised by the doughnut shape suggested by [*]jbleeker-B2:mar83. However the distribution is distinctly different to that obtained in similar 3-D studies of the optical knots, Lawrence et al. (1995).
The plane of the sky image in figure 10 shows that the Fe-K emission to the East is at a radius of 140 arc seconds, near the primary shock, with an implied shock velocity of in the range 3500-4500 km s-1. The Fe-K emission at large radii is highly reminiscent of SNR shrapnel discovered by [*]jbleeker-B2:asc95 around the Vela SNR. These are almost certainly bullets of material which were ejected from the progenitor during the collapse and subsequent explosion. They would initially be expected to have a radial velocity less than the blast wave but as the remnant develops, and the shock wave is slowed by interaction with the surrounding medium, the bullets would overtake the blast wave and appear outside the visible shock front as is the case in Vela. Our analysis of the abundances clearly indicates that the matter responsible for the X-ray emission is ejecta and this must have been ablated from the bullets rather than swept up by the shock.
5 High-resolution spectroscopic data
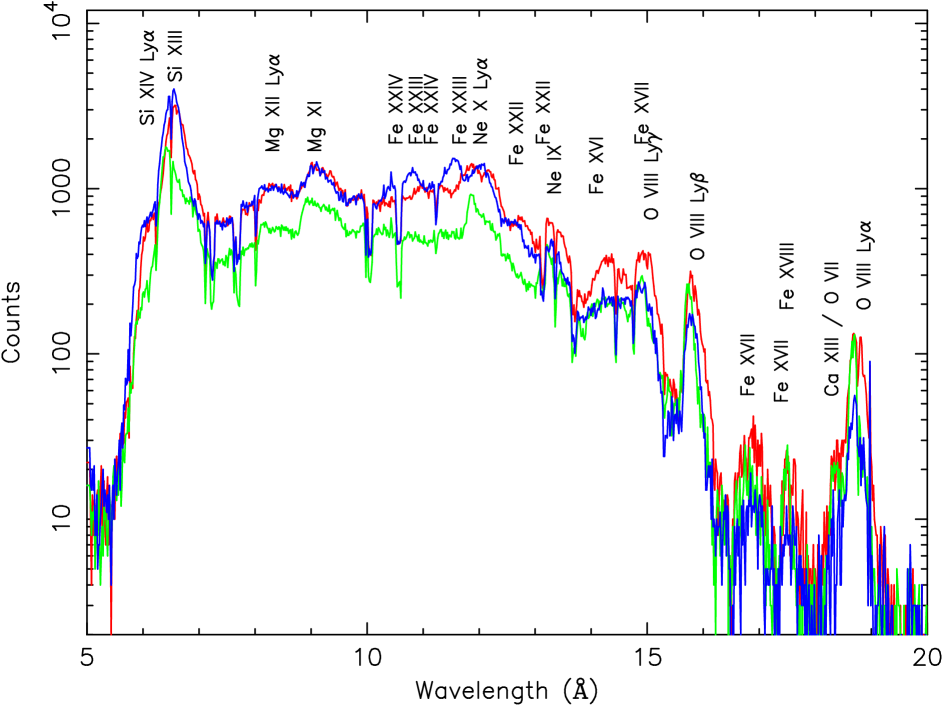
Figure 11 displays spectra from three extraction regions over the remnant situated in the N, NE and SE of the remnant. The data from RGS1 and RGS2 have been combined in order to increase the statistical weight of the observation. Several lines of highly ionized species of Si, Mg, Ne, Fe L and O are detected in the spectrum. Due to interstellar absorption no features can be measured long-ward of 20 Å. The analysis and interpretation of these spectra will be the subject of a forthcoming paper.
As a first result [*]jbleeker-B2:ble01 extracted images of the O viii Ly- and Ly- lines to probe small scale variations in absorption effects over this part of the remnant and to investigate the potential presence of resonance scattering in the limb brightened shells viewed edge-on. The temperature range relevant for Cas A has no influence on the Ly-/Ly- ratio. Since RGS is a slitless spectrometer it is possible to extract dispersed monochromatic images of Cas A. These images were converted from wavelength to spatial coordinates using the equation , where is the offset along the dispersion direction, the wavelength shift, the angle of incidence on the gratings and the line distance of the gratings. However, any Doppler broadening is also convolved along the dispersion direction and, depending on its magnitude, Doppler broadening could distort the RGS images.
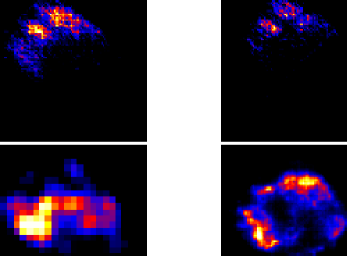
The O viii Ly- and Ly- maps are presented in figure 12. The oxygen emission is seen to originate from three blobs on the E and N rim of the remnant. The emission is faintest in the SE blob where there also seems to be a Ly- deficit compared to Ly-. Such a decrease in the Ly-/Ly- ratio could possibly be introduced by the presence of resonance scattering of the O viii Ly- photons in the X-ray bright rims if viewed edge-on ([\astronciteKaastra & Mewe1995]).
6 conclusions
The hard X-ray continuum maps from XMM-Newton indicate that the 8.015.0 keV flux, predominantly due to the previously reported high-energy spectral tail, does not originate from a few localized regions such as X-ray bright knots and filaments, nor does it originate from a limb brightened (fractionary) shell close to the shock front generated by the primary blast wave. Therefore the hard X-ray image does not support in any way the interpretation in terms of simple synchrotron emission models. Non-thermal Bremsstrahlung, produced by a population of suprathermal electrons, would seem to be a plausible alternative.
The detection of the 44Sc(44Ti) emission in the BeppoSax data can be reconciled with a progenitor star having a range 30-40 , assuming a very energetic explosion. It is worth noting, however that the relatively high 44Ti abundance can also be explained by one of the few available SN Type Ib models of a star with a ZAMS mass of 60 M ([\astronciteWoosley, Langer & Weaver1993]). Moreover the elemental abundance ratios predicted by this particular model are also roughly consistent with the abundance ratios obtained from the XMM-Newton analysis.
The tight correlation between the variation in abundance of Si, S, Ar, Ca over an absolute abundance range of two orders of magnitude is strong evidence for the nucleosynthesis of these ejecta elements by explosive O-burning and incomplete explosive Si-burning due to the shock heating of these layers in the core collapse supernova. However the Fe emission, both in the Fe-K and the Fe-L lines, does not show this correlation in any sense. A significant fraction of the Fe-K emission is seen at larger radii than Si-K and S-K as convincingly demonstrated in our Doppler derived 3-D reprojection. Moreover the Fe-K emission is patchy, reminiscent of large clumps of ejecta material, rather than shock heated swept up circumstellar material. The X-ray emission would then arise from ablation of the Fe-ejecta bullets. The 3-D reprojection also shows a largely bi-polar distribution of the Fe-K emission which may indicate that the original explosion was aspherical, possibly with axial symmetry.
Future research involves further analysis of spatially resolved high resolution spectroscopy as provided by the RGS.
JV acknowledges support by the NASA through Chandra Postdoctoral Fellowship Award Number PF0-10011.
References
- [\astronciteAhmad et al.1998] Ahmad, I., Bonino, G., Cini Castagnoli, G., Fischer, S. M., Kutschera, W., & Paul, M. 1998, PhRvL, 80, 2550
- [\astronciteAllen et al.1997] Allen G.E., Keohane J.W., Gotthelf E.V., et al., 1997, ApJ, 487, L97
- [\astronciteAschenbach1995] Aschenbach B., Egger, R., Trümper, J. 1995, Nature 373, 587
- [\astronciteAsworth1980] Asworth, W.B. 1980, J.Hist. Astr., 11, 1
- [\astronciteAsvarov et al.1989] Asvarov A.I., Guseinov, O.H., Kasumov, F.K., & Dogel’, V.A. 1990, A&A, 229, 196
- [\astronciteBleeker et al.2001] Bleeker, J.A.M., Willingale, R., van der Heyden, K.J., Dennerl, K., Kaastra, J.S., Aschenbach, B., & Vink, J. 2001, A&A, 365, L225
- [\astronciteChevalier & Kirshner1979] Chevalier, R.A., Kirshner, R.P., 1979, ApJ, 233, 154
- [\astronciteDiehl & Timmes1998] Diehl, R., & Timmes, F.X., 1998, PASP, 110, 637
- [\astronciteFavata et al.1997] Favata F., Vink, J., dal Fiume, D., et al. 1997, A&AS, 324, L49
- [\astronciteFesen et al.1987] Fesen, R.A., Becker, R.H., & Blair, W.P 1987, ApJ, 313, 378
- [\astronciteGörres et al.1998] Görres, J., et al. 1998, PhRvL, 80, 2554
- [\astronciteHolt et al.1994] Holt, S.S., Gotthelf, E.V., Tsunemi, H., Negoro, H. 1994, PASJ 46, L15
- [\astronciteIyudin et al.1994] Iyudin A. F., et al. 1994, A&A, 284, L1
- [\astronciteIyudin1997] Iyudin A. F. 1997, Nuclear Phys. A, 654, 900c
- [\astronciteKaastra & Mewe1995] Kaastra, J.S., & Mewe, R. 1995, A&AS, 302, L13
- [\astronciteLaming2000] Laming, J.M. 2001, ApJ, 546, 1149
- [\astronciteLaming2001b] Laming, J.M., 2001b, Proceeding of Joint SOHO-ACE Workshop 2001, Solar and Galactic Composition, ed. R. F. Wimmer-Schweingruber, in press (astro-ph/0108316)
- [\astronciteLaming2001a] Laming, J.M. 2001a, ApJ, 563, 828
- [\astronciteMarkert et al.1983] Markert, T.H., Canizares, C.R., Clark, G.W., Winkler, P.F. 1983, apJ 268, 13
- [\astronciteNagataki et al.1998] Nagataki S., Hashimoto, M., Sato, K., Yamada, S., Mochizuki, Y.S. 1998, ApJ, 492, L45
- [\astronciteNorman et al.1998] Norman, E.B., et al. 1998, PhRvC, 57, 2010
- [\astronciteReynolds1998] Reynolds S.P. 1998, ApJ, 493, 375
- [\astronciteRothschild et al.1997] Rothschild, R. E., et al. 1997, Nuclear Phys. B (Proc. Suppl.), 69/1-3, 68
- [\astronciteThe et al.1996] The, L.-S., Leising, M.D., Kurfess, J.D., Johnson, W. N., Hartmann, D. H., Gehrels, N., Grove, J. E., & Purcell, W. R. 1996, A&AS, 120, 357
- [\astronciteThe et al.1998] The, L.S., Clayton, D.D, Jin, L., Meyer, B.S., 1998, ApJ, 504, 500
- [\astronciteTimmes et al.1996] Timmes, F.X., Woosley, S.E., Hartmann, D.H., & Hoffman, R.D., 1996, ApJ, 464, 332
- [\astronciteVink et al.1996] Vink, J., Kaastra, J.S., & Bleeker, J.A.M., 1996, A&A, 307, L41
- [\astronciteVink et al.1999] Vink, J., Maccarone, M.C., Kaastra, J.S., Mineo, T., Bleeker, J. A. M., Preite-Martinez, A., & Bloemen, H. 1999, A&A, 344, 289
- [\astronciteVink et al.2000] Vink, J., Kaastra, J., Bleeker, J., & Bloemen, H. 2000, AdSpR, 25, 689
- [\astronciteVink et al.2001] Vink, J., Laming, J.M., Kaastra, J.S., Bleeker, J.A.M., Bloemen, H., 2001, ApJ, 560, L79
- [\astronciteWillingale et al.2002] Willingale, R., Bleeker, J.A.M., Willingale, R., van der Heyden, K.J., Kaastra, J.S., & Vink, J. 2002, ApJ, 381, 1039
- [\astronciteWoosley, Langer & Weaver1993] Woosley, S.E., Langer, N., & Weaver, T.A. 1993, ApJS, 411, 823
- [\astronciteWoosley & Weaver1995] Woosley, S.E., & Weaver, T.A. 1995, ApJS, 101 181