The Baryon Density Through The (Cosmological) Ages
Gary Steigman
Departments of Physics and Astronomy
The Ohio State University
174 West 18th Avenue
Columbus, OH 43210, USA
Abstract
The light element abundances probe the baryon density of the universe within a few minutes of the Big Bang. Of these relics from the earliest universe, deuterium is the baryometer of choice. By comparing its primordial abundance inferred from observations with that predicted by Big Bang Nucleosynthesis (BBN), the early universe baryon density is derived. This is then compared to independent estimates of the baryon density several hundred thousand years after the Big Bang and at present, more than 10 billion years later. The excellent agreement among these values represents an impressive confirmation of the standard model of cosmology.
1 Introduction
In the new, precision era of cosmology, redundancy will play an increasingly important role, permitting multiple, independent, tests of and constraints on competing cosmological models, and providing a window on systematic errors which can impede progress or send us off in unprofitable directions. To illustrate the value of this approach, here the baryon density of the Universe is tracked from the first few minutes (as revealed by BBN), through the first few hundred thousand years later (as coded in the fluctuation spectrum of the Cosmic Microwave Background – CMB), and up to the present epoch, approximately 10 Gyr after the expansion began. Theory suggests and terrestrial experiments confirm that the baryon number is preserved throughout these epochs, so that the number of baryons ( nucleons) in a comoving volume should be unchanged from BBN to today. As a surrogate for tracking a comoving volume, the nucleon density may be compared to the density of CMB relic photons. Except for the additional photons produced when e± pairs annihilate, the number of photons in any comoving volume is also preserved. As a result, the baryon density may be traced throughout the evolution of the universe utilizing the nucleon-to-photon ratio . Since the temperature of the CMB fixes the present number density of relic photons, the fraction of the critical mass/energy density in baryons (nucleons) today () is directly related to by, , where the Hubble parameter is H kms-1Mpc-1. According to the HST Key Project, [1].
For several decades now the best constraints on have come from the comparison of the predictions of BBN with the primordial abundances of the relic nuclides D, 3He, 4He, and 7Li, as inferred from observational data. New data, of similar accuracy, which will soon be available, will enable quantitative probes of the baryon density at later epochs in the evolution of the universe. Indeed, recent CMB data has very nearly achieved this goal. Although a comparable level of precision is currently lacking for the present universe estimates, the data do permit comparisons of independent estimates of (or ) at three widely separated eras in the evolution of the universe.
2 The Baryon Density During The First Few Minutes
During the first few minutes in the evolution of the universe the density and temperature were sufficiently high for nuclear reactions to occur. As the universe expanded, cooled, and became more dilute, the universal nuclear reactor ceased to create or destroy nuclei. The abundances of the light nuclei formed during this epoch are determined by the competition between the time available (the universal expansion rate) and the density of the reactants: neutrons and protons. The abundances of D, 3He, and 7Li are “rate limited”, being determined by the competition between the nuclear production/destruction rates and the universal expansion rate. As such, they are sensitive to the nucleon density and have the potential to serve as “baryometers”.
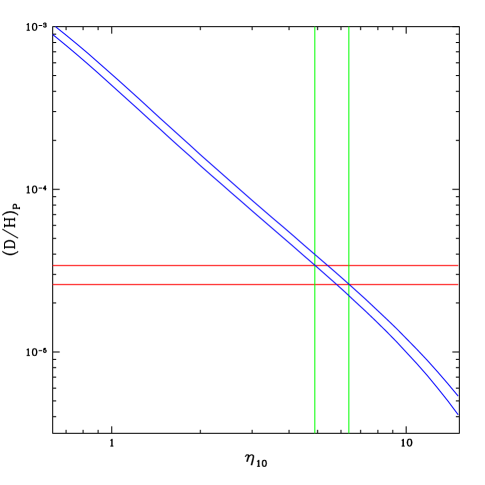
Of the light, relic nuclides whose primordial abundances may probe the baryon density, deuterium is the baryometer of choice. Its predicted primordial abundance varies sigificantly with the nucleon density (D/H ) (see Fig. 1). As a result, a primordial abundance known to, say, 10%, determines the baryon density () to ; truly precision cosmology! Equally important, BBN is the only astrophysical site where an “interesting” abundance of deuterium may be produced (D/H ) [2]; the relic abundance is not enhanced by post-BBN production. Furthermore, as primordial gas is cycled through stars, deuterium is completely destroyed. Because of the small binding energy of the deuteron, this destruction occurs during pre-main sequence evolution, when stars are fully mixed. As a result, the abundance of deuterium will only have decreased (or, remained close to its primordial value) since BBN.
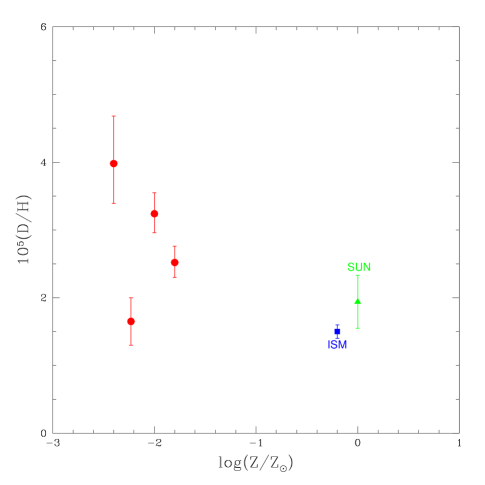
After some false starts, as of early 2001 there were three high-redshift (z), low-metallicity (Z) QSO absorption line systems where deuterium had been reliably detected [3, 4, 5]. Earlier observations [6] of a system with very high D/H are widely agreed to have had insufficient velocity data to rule out contamination of the deuterium absorption by a hydrogen interloper [7]. More recently, detection of deuterium has been claimed for another QSO absorption line system [8, 9]. However, the large variations in the inferred D/H, due to the uncertain velocity structure, render this line of sight inappropriate for determining the primordial deuterium abundance. An apparently more reliable, recent determination along a different line of sight yields a surprisingly small D/H [10]. These current data, along with the D/H values for the local interstellar medium [11] and the pre-solar nebula [12] are shown in Figure 2 as a function of metallicity. At low metallicity there should be a deuterium “plateau”, whose absence, so far, is notable – and very puzzling. Clearly more data is needed. For the purpose of deriving the early universe baryon density, I will rely on the deuterium abundance proposed by O’Meara et al. [5]: (D/H).
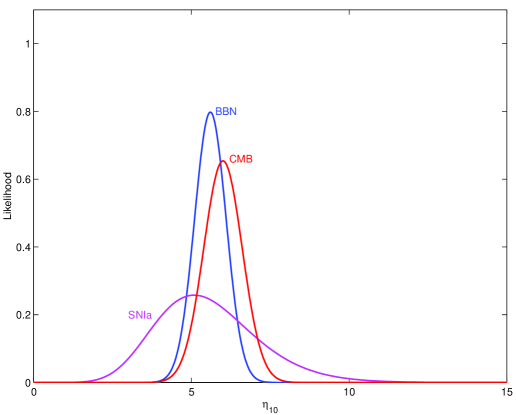
From a careful comparison between the BBN predicted abundance and the adopted primordial value, the baryon density when the universe is less than a half hour old is determined (see Fig. 1): . This is truly a “precision” determination; only time will tell if it is accurate. The likelihood distribution of this BBN-derived baryon density is the curve labelled “BBN” in Figure 5.
3 The Baryon Density A Few Hundred Thousand Years Later
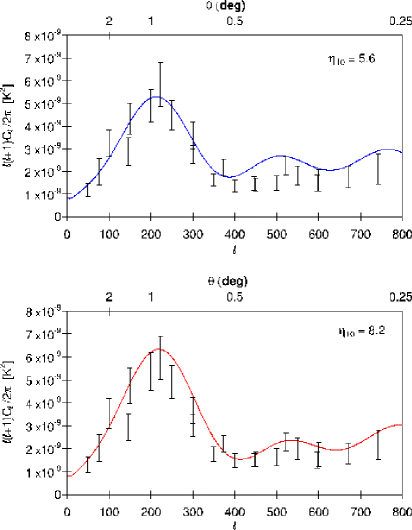
The early universe is radiation dominated and the role of “ordinary” matter (baryons) is subdominant. As the universe expands and cools, the density in non-relativistic matter becomes relatively more important, eventually dominating after a few hundred thousand years. At this stage perturbations begin growing under the influence of gravity and, on scales determined by the relative density of baryons, oscillations in the baryon-photon fluid develop. At redshift , when the electron-proton plasma combines to form neutral hydrogen, the CMB photons are freed to propagate thoughout the universe (“last scattering”). These CMB photons preserve the record of the baryon-photon oscillations through very small temperature fluctuations in their spectrum. These fluctuations, or anisotropies, have been detected by the newest generation of experiments, beginning with COBE [13] and continuing with the exciting early results from BOOMERANG [14, 15] and MAXIMA-1 [16], providing a tool for constraining the baryon density at last scattering. In Figure 3 the status quo ante is shown. The relative heights of the odd and even peaks in the CMB angular fluctuation spectrum depend on the baryon density and these early BOOMERANG and MAXIMA-1 data favored a “high” baryon density (compare the “BBN case”, , in the upper panel of Fig. 3 with that for a baryon density some 50% higher shown in the lower panel). These data posed a challenge to the consistency of the standard models of cosmology and particle physics, suggesting that the baryon number may have changed (increased) since BBN. Subsequently, new data from the DASI experiment [17], along with the revised and expanded BOOMERANG [18] and MAXIMA [19] data appeared. The new and revised data eliminated the challenge posed by the older results.
Although the extraction of cosmological parameters from the CMB anisotropy spectra can be very dependent on the priors adopted in the analyses (see e.g., [20]), the baryon density inferred when the universe was a few hundred thousand years old is robust. For example, we (Kneller et al. [20]) find, . The likelihood distribution for this CMB-determined baryon abundance is shown in Figure 5 by the curve labelled “CMB”. The excellent agreement between the two independent estimates, BBN at a few minutes, and CMB at a few hundred thousand years, represents a spectacular success for the standard model of cosmology and illustrates the great potential for future precision tests of cosmology.
4 The Baryon Density At 10 Gyr
There are a variety of approaches to measuring the baryon density today, or during the very recent past. Many of these depend on assumptions concerning the relation between mass and light or, they require the adoption of a specific model for the growth of structure. The approach utilized here attempts to avoid such model-dependent assumptions. Instead, the data from the SNIa magnitude-redshift surveys [21, 22, 23], is used along with the assumption of a flat universe (this latter receives strong support from the newest CMB data [17, 18, 19]) to pin down the total matter density (). This is then combined with an estimate of the universal baryon fraction () derived from studies of the X-ray emission from clusters of galaxies. For more details on this approach, see [24] and [25].
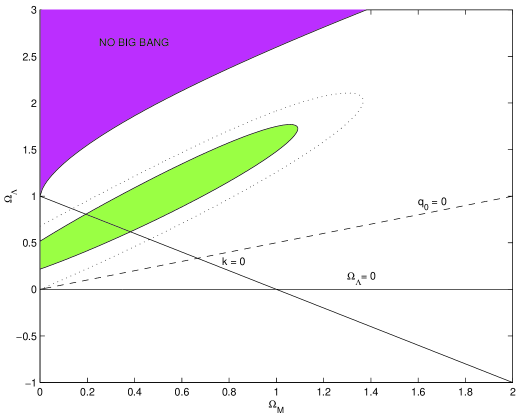
In Figure 4 are shown the SNIa-constrained 68% and 95% contours in the plane. The expansion of the universe is currently accelerating for those models which lie above the (dashed) q line. The line is for a “flat” (zero 3-space curvature) universe. As shown in [25], adopting the assumption of flatness and assuming the validity of the SNIa data, leads to a reasonably accurate () estimate of the present matter density: .
As the largest collapsed objects, rich clusters of galaxies provide an ideal probe of the baryon fraction in the present/recent universe. Observations of the X-ray emission from clusters of galaxies permit constraints on the hot gas content of such clusters which, when corrected for the baryons in stars (but, unfortunately, not for any dark baryons!), may be used to estimate (or bound) . From observations of the Sunyaev-Zeldovich effect in X-ray clusters, the hot gas fraction may be constrained [26] and used to estimate [27]. The combination of and is then used to derive a present-universe ( Gyr; ) baryon density: . In Figure 5 the corresponding likelihood distribution for the present universe baryon density is shown labelled by“SNIa”. Although the uncertainties are largest for this present-universe value, it is in excellent agreement with the other, independent estimates.
5 Summary – Concordance
The abundances of the relic nuclides produced during BBN reflect the baryon density present during the first few minutes in the evolution of the universe. Of these relics from the early universe, deuterium is the baryometer of choice. Although more data is to be desired, the current data permit reasonably constrained estimates of the abundance of primordial deuterium, leading to a tight constraint on the early universe baryon-to-photon ratio ().
Several hundred thousand years later, when the universe became transparent to the CMB radiation, the baryon density was imprinted on the temperature fluctuation spectrum. In determining the baryon density, the current CMB data have a precision approaching that of BBN: (). The excellent agreement between the BBN and CMB values (see Fig. 5) provides strong support for the standard model of cosmology.
In the present universe most baryons are dark (), so that estimates of the baryon density some 10 billion years after the expansion began are more uncertain and, often model-dependent. In § 4 an estimate of the total matter density () derived from the SNIa magnitude-redshift data was combined with the assumption of a flat universe to derive (). Although this estimate is of lower statistical accuracy than those from BBN or the CMB, it is in agreement with them (see Fig. 5). Note that if the mass of dark baryons in clusters were similar to the stellar mass, the present-universe baryon density estimate would increase by , bringing it into essentially perfect overlap with the BBN and CMB values.
Increasingly precise observational data have permitted us to track the baryon density from the big bang to the present. At widely separated epochs, from the first few minutes, through the first few hundred thousand years, to the present, ten billion year old universe, a consistent value for the baryon abundance is revealed. This remarkable concordance of the standard, hot, big bang cosmological model is strikingly revealed by the overlapping likelihood distributions for the universal baryon abundances shown in Figure 5.
Acknowledgments
I wish to thank the Alexander von Humboldt Foundation and its extremely efficient staff for having organized such an exciting and informative symposium. The research described here is supported by the U.S. D.O.E. through grant DE-FG02-91ER-40690.
References
- [1] W. L. Freedman, et al., ApJ 553 (2001) 47.
- [2] R. Epstein, J. Lattimer, & D. N. Schramm, Nature 263 (1976) 198.
- [3] S. Burles & D. Tytler, ApJ 499 (1998a) 699.
- [4] S. Burles & D. Tytler, ApJ 507 (1998b) 732.
- [5] J. M. O’Meara, et al., ApJ 552 (2001) 718.
- [6] J. K. Webb, R. F. Carswell, K. M. Lanzetta, R. Ferlet, M. Lemoine, A. Vidal-Madjar, & D. V. Bowen, Nature 388 (1997) 250.
- [7] D. Kirkman et al., ApJ 559 (2001) 23.
- [8] S. D’Odorico, M. Dessauges-Zavadsky, & P. Molaro, A&A 338 (2001) L1.
- [9] S. A. Levshakov, M. Dessauges-Zavadsky, S. D’Odorico, & P. Molaro, ApJ 565 (2002) 696.
- [10] M. Pettini, & D. V. Bowen, ApJ 560 (2001) 41.
- [11] J. L. Linsky, & B. E. Wood, Proceedings of IAU Symposium 198, The Light Elements and Their Evolution (L. da Silva, M. Spite, and J. R. Medeiros eds.; ASP Conference Series), (2000) p. 141.
- [12] G. Gloeckler & J. Geiss, Proceedings of IAU Symposium 198, The Light Elements and Their Evolution (L. da Silva, M. Spite, and J. R. Medeiros eds.; ASP Conference Series), (2000) p. 224.
- [13] C. L. Bennett, et al., ApJ 464 (1996) L1.
- [14] P. de Bernardis, et al., Nature 404 (2000) 955.
- [15] A. E. Lange, et al., Phys. Rev. D 63 (2001) 042001.
- [16] S. Hanany, et al., ApJ 545 (2000) L5.
- [17] N. W. Halverson, et al., preprint (2001) [astro-ph/0104489].
- [18] C. B. Netterfield, et al., preprint (2001) [astro-ph/0104460].
- [19] A. T. Lee, et al., ApJ 561 (2001) L1.
- [20] J. P. Kneller, R. J. Scherrer, G. Steigman, & T. P. Walker, Phys. Rev. D 64 (2001) 123506.
- [21] S. Perlmutter, et al., ApJ 483 (1997) 565.
- [22] B. P. Schmidt, et al., ApJ 507 (1998) 46.
- [23] S. Perlmutter, et al., ApJ 517 (1999) 565.
- [24] G. Steigman, N. Hata, & J. E. Felten, ApJ 510 (1999) 564.
- [25] G. Steigman, T. P. Walker, & A. Zentner, preprint (2000) [astro-ph/0012149].
- [26] L. Grego, et al., ApJ 552 (2001) 2.
- [27] G. Steigman, J. P. Kneller, & A. Zentner, Revista Mexicana de Astronomia y Astrofisica 12 (2002) 265.