The Epochs of Early-Type Galaxy
Formation in Clusters and in the Field
Daniel Thomas, Claudia Maraston, & Ralf Bender
Universitäts-Sternwarte München
Scheinerstr. 1, D-81679 München, Germany
daniel@usm.uni-muenchen.de
Abstract
We compute new population synthesis models of Lick absorption line indices with variable ratios and use them to derive average ages, metallicities, and [] element enhancements for a sample of 126 field and cluster early-type galaxies. Calibrating the models on galactic globular clusters, we show that any population synthesis model being based on stellar libraries of the Milky Way is intrinsically biased towards super-solar ratios at metallicities below solar. We correct for this bias, so that the models presented here reflect constant ratios at all metallicities. The use of such unbiased models is essential for studies of stellar systems with sub-solar metallicities like (extragalactic) globular clusters or dwarf galaxies.
For the galaxy sample investigated here, we find a clear correlation between [] and velocity dispersion. Zero-point, slope, and scatter of this correlation turn out to be independent of the environment. Additionally, the [] ratios and mean ages of elliptical galaxies are well correlated, i.e. galaxies with high ratios have also high average ages. This strongly reinforces the view that the [] element enhancement in ellipticals is produced by short star formation timescales rather than by a flattening of the initial mass function. With a simple chemical evolution model, we translate the derived average ages and ratios into star formation histories. The more massive the galaxy, the shorter is its star formation timescale, and the higher is the redshift of the bulk of star formation, independent of the environmental density. We show that this finding is incompatible with the predictions from hierarchical galaxy formation models, in which star formation is tightly linked to the assembly history of dark matter halos.
1 Introduction
The stellar population properties of early-type galaxies represent a key challenge for theories of galaxy formation. In hierarchical models of galaxy formation, more massive galaxies have longer assembly timescales and therefore younger mean ages (Kauffmann 1996). Without taking metallicity effects into account, this results in more massive galaxies having bluer colors in contradiction to the observational evidence (Bower, Lucey, & Ellis 1992). It is well known, that metallicity can be traded for age. Therefore, by assuming that metallicities steeply increase with the mass of the galaxy, the blueing due to age effects can be masked by metallicity. In this way hierarchical galaxy formation models are able to produce the correct slope of the color magnitude relation (Kauffmann & Charlot 1998). It remains open, however, if the correct ages of early-type galaxies are predicted. A meaningful test of the model must include the direct comparison of predicted and observed ages.
A powerful tool to derive ages and metallicities are absorption line indices (Worthey 1994). Under the assumption that the stellar populations of ellipticals do not exhibit a significant spread in metallicity (Maraston & Thomas 2000), a combination of the Lick indices , , and (Faber et al. 1985) serves to disentangle age and metallicity. Still, this approach is hampered by the fact that the data of elliptical galaxies lie below the models in the --index diagram (e.g., Worthey, Faber, & González 1992; Davies, Sadler, & Peletier 1993). More precisely, the Mg lines observed in elliptical galaxies are stronger—at a given Fe line strength—than predicted by population synthesis models. As a consequence, Mg line indices yield higher metallicities and younger ages than the Fe line indices, which indicates the presence of [] enhanced stellar populations. This interpretation gets empirical support from the work of Maraston et al. (2002), who find that metal-rich globular clusters of the Bulge with independently known super-solar [] ratios exhibit the same pattern in the - and - diagrams. A non-ambiguous derivation of ages therefore requires population synthesis models with variable ratios, and the consideration of the 3-dimensional parameter space of Balmer, Mg, and Fe lines.
The paper is organized as follows. In Section 2 we present the main ingredients of our population synthesis models, whose calibration on globular clusters is shown in Section 3. The ages, metallicities, and ratios of early-type galaxies are derived and presented in Section 4. A comparison of these results with the predictions from models of hierarchical galaxy formation is shown in Section 5. The main conclusions of this paper are discussed and summarized in Sections 6 and 7.
2 New Population Synthesis Models
The classical input parameters for population synthesis models are age and metallicity. In this paper, we introduce the element abundance ratio as a third input parameter. For the construction of the /Fe-enhanced simple stellar population (SSP) models we use the SSP models of Maraston (1998, 2002) as the base models, which we then modify according to the desired /Fe ratio. In the following we summarize the procedure and introduce the main input parameters. For a more detailed presentation of the model we refer to Thomas, Maraston, & Bender (2002).
2.1 The base SSP model
The underlying solar-scaled SSP models are presented in Maraston (1998, 2002). In these models, the fuel consumption theorem (Renzini & Buzzoni 1986) is adopted to evaluate the energetics of the post main sequence phases. The input stellar tracks (solar abundance ratios) with metallicities from 1/200 to 2 solar, are taken from Cassisi, Castellani, & Castellani (1997), Bono et al. (1997), and S. Cassisi (1999, private communication). The tracks with 3.5 solar metallicity are taken from the solar-scaled set of Salasnich et al. (2000). Lick indices are computed by adopting the fitting functions of Worthey et al. (1994).
2.2 Element abundance variations
We construct models with super-solar ratios by increasing the abundances of the -elements (i.e. N, O, Mg, Ca, Na, Ne, S, Si, Ti) and by decreasing those of the Fe-peak elements (i.e. Cr, Mn, Fe, Co, Ni, Cu, Zn), such that total metallicity is conserved (Trager et al. 2000a). The abundances of Carbon and all elements heavier than Zinc are assumed not to vary. It is important to notice that super-solar /Fe ratios at constant total metallicity are accomplished mainly through a depletion of the Fe-peak element abundances, because total metallicity is made up predominantly by oxygen and the other -elements.
2.3 Effects on absorption line indices
The abundance variations of individual elements in the stellar atmospheres certainly impact on the observed absorption-line strengths of a stellar population. This effect represents the principal ingredient in the present /Fe-enhanced models. The variations of the Lick absorption line indices owing to the element abundance changes described in the previous section are taken from Tripicco & Bell (1995; hereafter TB95).
TB95 computed model atmospheres and synthetic spectra along a 5 Gyr-old isochrone with solar metallicity, alternately doubling the abundances of the elements C, N, O, Mg, Fe, Ca, Na, Si, Cr, Ti, Mn, Ni, and V. Note that total metallicity is not conserved but slightly increased. The impact of the abundance variations on the temperature of the isochrone is on purpose not considered by TB95. All models are based on the same isochrone with fixed and distributions, so that the abundance effects are isolated at a given temperature and surface gravity.
On the model atmospheres defined by these parameters, TB95 measure the absolute Lick index value and the index change , for the variation of the abundance of element . From these numbers one obtains the fractional index change (response function) of the index due to the enhancement of the abundance of element by 0.3 dex.
Following Trager et al. (2000a), the total fractional change of the index when enhancing all -elements and depressing all Fe-peak elements can then be written as the product of the fractional changes due to individual element abundance variations:
| (1) |
In this equation, is the change of the abundance ratios of element over Hydrogen relative to the solar value. This equation assumes that the percentage index change is constant for each step of 0.3 dex in abundance, which assures that index values approach zero gracefully (Trager et al. 2000a).
The index variation of the index is then given by the product of the total fractional index changes from TB95 and the value of the index . Note, however, that is calculated in TB95 for , so that this procedure is in principle only valid for metallicities reasonably close to solar. Indeed, with this prescription the /Fe ratios of galactic globular clusters cannot be reproduced, the fractional index changes given by TB95 turn out to be by far too small at metallicities . As a first-order approximation, we therefore assume that the absolute index change calculated by TB95 at solar metallicity is conserved when going to lower metallicities. At super-solar metallicities we adopt the fractional index changes of TB95. The index variation for the index for given element abundance variations is then
| (2) |
As response functions for metallicities different from solar are not available, this is the most straightforward approximation at present. It is further supported by the fact that the ratios we derive for galactic globular clusters from their Lick indices , , and are in very good agreement with independent spectroscopic high-resolution measurements as shown in Section 3.
It should also be emphasized that at metallicities relevant for early-type galaxies and metal-rich globular clusters, i.e. , the difference between fractional response and absolute response in Eqn. 2 has only a marginal effect on the resulting SSP models (see Thomas et al. 2002).
TB95 compute the variations of the individual Lick indices on model atmospheres with well defined values of temperature and gravity. These values are chosen to be representative of the three evolutionary phases dwarfs (, ), turnoff (, ) and giants (, ), on the 5 Gyr, solar metallicity isochrone used by the authors.
We separate the turnoff region from the dwarfs on the Main Sequence at 5000 K, independent of age and metallicity. Note that the impact on the final model from varying this temperature cut-off as a function of age and metallicity is negligible (Thomas et al. 2002). We assign the Sub Giant Branch phase to the turnoff because of the very similar and . The evolutionary phase ‘giants’ consist of the Red Giant Branch, the Horizontal Branch, and the Asymptotic Giant Branch phases. The Lick indices are computed for each evolutionary phase separately, and modified according to the response functions presented in Eqn. 2. The total integrated index of the SSP is then
| (3) |
where , , are the integrated indices of the three phases, and , , are their continua. It can be easily verified that Eqn. 3 is mathematically equivalent to
| (4) |
which defines integrated indices (in EW) of SSPs. In Eqn. 4 and are the fluxes in the line and the continuum (of the considered index), for the -th star of the population, is the line width.
2.4 The /Fe bias of stellar libraries
In population synthesis models, the link between Lick absorption line indices and the stellar parameters temperature, gravity, and metallicity is provided by stellar libraries that inevitably reflect the chemical history of the Milky Way111In our (and most) population synthesis models this link is given by the so-called fitting functions of Worthey et al. (1994).. This implies that every population synthesis model suffers from a bias in the ratio, i.e. the model does not reflect solar at all metallicities (Borges et al. 1995). From the abundance patterns of the Milky Way stars (see the review by McWilliam 1997 and references therein), we know that the underlying ratio is solar at and increases with decreasing metallicity to at .
| [] | ||||||
|---|---|---|---|---|---|---|
| [] |
In this paper we construct SSP models for different with the aid of the index response functions as described in the previous sections. With this procedure it is straightforward to correct for the bias given by the chemical history of our Galaxy (see Table 1). The values in Table 1 are in excellent agreement with the bias derived by Maraston et al. (2002) with the aid of the fitting functions of Borges et al. (1995). By correcting for this bias we present for the first time SSP models that have a constant ratio at all metallicities. The use of such models is particularly important for the interpretation of metal-poor stellar systems like (extragalactic) globular clusters or dwarf spheroidal galaxies.
2.5 The effect of -enhanced stellar tracks
In principle the element abundance variations in a star affect also the star’s evolution and the opacities in the stellar atmosphere, hence the effective temperature. A fully consistent /Fe-enhanced SSP model should therefore consider -enhanced stellar evolutionary tracks. The impact of non-solar /Fe ratios on stellar evolution, however, was very controversially discussed in the literature (see discussion in Trager et al. 2000a). In particular, we are still missing a homogeneous set of stellar tracks with non-solar abundance ratios using consistent opacities, that are computed for a large range in metallicities. Salasnich et al. (2000) computed -enhanced stellar tracks for metallicities , while Bergbusch & VandenBerg (2001) recently published -enhanced stellar tracks for metallicities . It would be valuable to have one set of models that includes sub-solar metallicities for calibration purposes on globular clusters and super-solar metallicities for the application on early-type galaxies.
Nevertheless, in Thomas et al. (2002) we additionally compute models in which the -enhanced stellar tracks of Salasnich et al. (2000) are included at metallicities above 1/2 solar. The lower opacities of the enhanced tracks lead to hotter isochrones, so that with these models we derive unreasonably high ( Gyr) ages for early-type galaxies. Unfortunately, a calibration of the model with the -enhanced tracks of Salasnich et al. (2000) on globular clusters is not possible, because metallicities below 1/2 solar are missing. We therefore do not consider -enhanced stellar tracks in the models presented here.
3 Calibration on Globular Clusters
In this section we show the calibration of our -enhanced SSP models on galactic globular clusters. We derive [] ratios and metallicities from the and Fe5270/Fe5335 indices of the globular clusters observed by Covino, Galletti, & Pasinetti (1995). These are then compared with independent spectroscopic measurements from individual stars in these clusters, taken from the compilations by Carney (1996) and Salaris & Cassisi (1996). We restrict our study to the data of Covino et al. (1995), because they give very consistent measurements of the indices Fe5270 and Fe5335 for all globulars (except NGC 6356), which is not the case for the data of Trager et al. (1998).
We do not use the index, but assume a fixed age of 12 Gyr for the following reason. In Maraston, Greggio, & Thomas (2001) it is shown that, because of the appearance of hot horizontal branch stars at very low metallicities, does not monotonically decrease with increasing age for , but has a minimum at Gyr. As a consequence, the age determination through is ambiguous at very low metallicities. Moreover, assuming the galactic globular clusters to be uniformly old, their indices and in particular the strong increase of with decreasing metallicity can be perfectly reproduced with our models (Maraston & Thomas 2000). Note also that the galactic globular clusters are found to be coeval independent of their metallicities (Rosenberg et al. 1999; Piotto et al. 2000). The ages derived from color-magnitude diagrams lie between 9 and 14 Gyr (VandenBerg 2000). The exact assumed age does not impact on the ratios derived here, because of the mild derivatives with age of the Mg and Fe indices at old ages.
3.1 and Fe indices

Fig. 1 shows data of galactic globular clusters from Covino et al. (1995) as triangles and squares in the -Fe5335 plane. Squares are those clusters for which independent measurements of [] are given in the literature. SSP models of fixed age (12 Gyr) and metallicities are over-plotted. The dotted line are the underlying SSP models of Maraston (1998, 2002). These models—like other SSP models in the literature (Buzzoni, Gariboldi, & Mantegazza 1992; Buzzoni, Mantegazza, & Gariboldi 1994; Worthey 1994; Tantalo et al. 1996; Vazdekis et al. 1996; Kurth, Fritze-von Alvensleben, & Fricke 1999; and others)—are biased in , i.e. they reflect super-solar ratios at sub-solar metallicities (see Section 2.4). Therefore, at the lowest metallicities, the models predict weaker Fe-indices than observed in globular clusters. The dashed and solid lines are the unbiased SSP models of this paper for and at all metallicities, respectively. The globular cluster data lie between these two models, indicating super-solar ratios in agreement with independent spectroscopic measurements of single stars in these clusters (see next section).
We note that it is very unlikely that the excess of Fe measured in the globular clusters can be explained by anomalies in the horizontal branch morphologies, i.e. clusters with larger Fe have relatively red horizontal branches for their metallicities. The clusters considered here do not show such an effect. The HBR parameter defined by Lee (1990), which essentially is a measure for the fraction of horizontal-branch stars on the blue side of the RR Lyrae region, indicates blue horizontal branches for all metal-poor clusters in the Covino et al. (1995) sample (Harris 1996).
3.2 The ratios


In Fig. 2 we plot the [] ratios derived for the Covino et al. (1995) clusters versus their total metallicities [] (filled symbols). Both these quantities are determined with our models described in Section 2. The filled squares are those clusters for which the [] ratios are known from independent spectroscopic measurements of individual stars. These values are plotted as open squares. The bottom panel shows the deviation of our determinations from the literature: . The left and right panels show the results for the Fe5270 and Fe5335 indices, respectively.
Within the errors, the values for [] derived with our models are in good agreement with independent spectroscopic measurements in single stars. Both Fe indices yield consistent ratios, although the errors (particular in Fe5270) are uncomfortably large. A more accurate calibration would certainly require data of better quality. For the entire Covino et al. (1995) sample we find , independent of metallicity. This result strongly supports the view that the galactic globular cluster population formed early in a short ( Gyr) star formation episode, so that no significant trend of age and with metallicity is detectable.
For the application of the models to early-type galaxies a calibration at solar and super-solar metallicities is desirable. For a sample of bulge clusters with metallicities up to solar (Maraston et al. 2002; Puzia et al. 2002), we derive abundance ratios , which are in good agreement with independent spectroscopic element abundance measurements in these clusters (see Maraston et al. 2002 and references therein).
4 Key Parameters of Early-Type Galaxies
4.1 Data sample
We analyze a sample of 126 early-type galaxies, 71 of which are field and 55 cluster objects, containing roughly equal fractions of elliptical and lenticular (S0) galaxies. The sample is constructed from the following sources: 41 Virgo cluster and field galaxies (González 1993), 32 Coma cluster galaxies (Mehlert et al. 2000), and 53 mostly field galaxies (highest quality data from Beuing et al. 2002) selected from the ESO–LV catalog (Lauberts & Valentijn 1989). In the latter sample, objects with a local galaxy surface density NG are assumed to be cluster galaxies. NGT is given in Lauberts & Valentijn (1989) and is the number of galaxies per square degree inside a radius of one degree around the considered galaxy.

In Fig. 3 we show as filled circles the Lick absorption line indices , , and of the sample measured within . Overplotted are our models with as dotted lines and as solid lines for the metallicities and for the ages Gyr (see the labels in the top-right, and bottom panels).
Note that the models with are identical with the original SSP models of Maraston (1998, 2002), as we do not assume any bias at these metallicities (see Table 1). The indices of the -enhanced model are higher, and the indices are lower, while increases only marginally. At metallicities close to solar, the fractional index changes are only very little dependent on age and metallicity. Therefore, the shape of the model grid is almost invariant under changes of .
By means of our -enhanced population synthesis models, we can now uniquely determine the average ages, metallicities, and ratios from the observed absorption indices , , and .
4.2 The ratios
In Fig. 4 we plot the element abundance ratio [] as functions of velocity dispersion (left panel) and mean age (right panel). Grey and black symbols are field and cluster early-type galaxies, respectively. Triangles are lenticular, circles elliptical galaxies. Squares are the Coma cD galaxies NGC 4874 and NGC 4889.
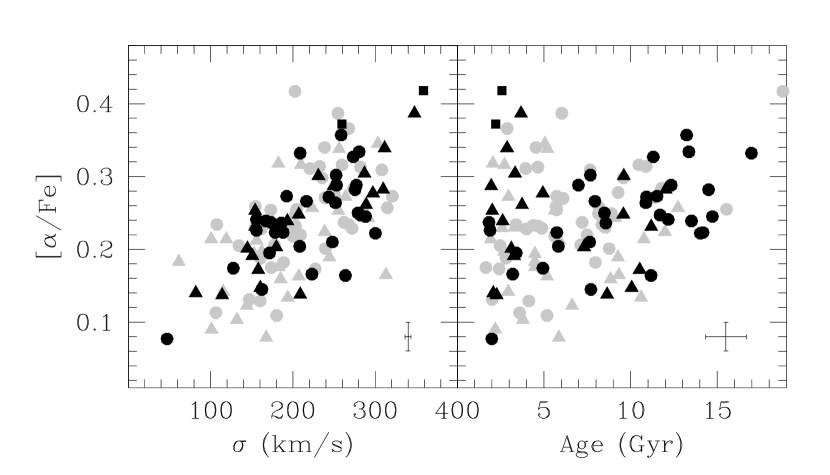
As anticipated qualitatively by Fisher, Franx, & Illingworth (1995), the [] ratio and are well correlated, in agreement with the study of Trager et al. (2000b). Additionally, we find that zero-point, slope, and scatter of this relation are the same for field and cluster galaxies. This result extends the discovery that the Mg- relation is independent of environmental density (Bernardi et al. 1998; Colless et al. 1999), and may provide a deeper understanding of the origin for the Mg- relation.
The increase of [] as a function of galaxy mass can be explained by either a flattening of the initial mass function (IMF) or by a shortening of the star formation timescale with increasing galaxy mass (e.g., Matteucci 1994; Thomas, Greggio, & Bender 1999). The additional consideration of average ages helps to disentangle this degeneracy. The right panel of Fig. 4 shows that the [] element enhancement correlates with the average age of the galaxy, such that objects with higher tend to be older. If IMF variations were the main cause for the observed ratios, we would not expect to find such a trend. In particular, the lack of old objects with low in all environments could not be easily understood. This non-detection strongly supports the conclusion that formation timescales rather than IMF variations are the driving mechanism for the []- relation.
We conclude that the depth of the potential well, measured through the velocity dispersion, defines the star formation timescales in early-type galaxies and hence their ratios, independent of the environment. If ratios are the main driver for the Mg- relation, its independence of the environment is then easily understood through the link between potential well and star formation timescale.
From Fig. 4 it can be seen that the correlation between mean [] and mean age is well defined for all cluster ellipticals. For the two Coma cD galaxies and roughly 15 per cent of the field ellipticals and lenticular galaxies we derive ages below 5 Gyr and . Naively interpreted, the coexistence of low ages and high could imply that the majority of stars in these objects were formed recently on a short timescale. However, this is very implausible. More likely explanations are:
-
•
Metal-poor subcomponent. Old, metal-poor stellar populations develop hot horizontal branches, which lead to rather strong Balmer absorption despite the old age. A composite stellar population that includes a small fraction of metal-poor stars can explain the Balmer absorption of these objects () without invoking young ages (Maraston & Thomas 2000). In this case the derivation of young average ages is an artifact, the galaxy is about 15 Gyr old, formed its stars on a short timescale and is therefore -enhanced.
-
•
Recent star formation. The object formed most of its stars at high redshift and suffered very recently ( Myr ago) from a minor (a few per cent in mass) star formation episode. As a consequence, the object has a very young -light averaged age, but also a very low average because of the Fe enrichment from Type Ia supernovae of the underlying old population (Thomas et al. 1999). In this case, the seemingly large derived here is an artifact, as composite stellar populations with a major old and a very small very young subcomponent can mimic the existence of -enhancement (Kuntschner 2000). This effect comes from the different partial time derivatives of the Mg and the Fe indices at ages below 1 Gyr. We note the caveat, however, that the fitting functions, and therefore also the population synthesis models, are not valid at such low ages (Buzzoni et al. 1994; Worthey et al. 1994).
4.3 The ages
The correlation of with both and average age–essentially valid for elliptical galaxies—implies a relation between average age and velocity dispersion. Both in clusters and in the field, more massive objects are older.
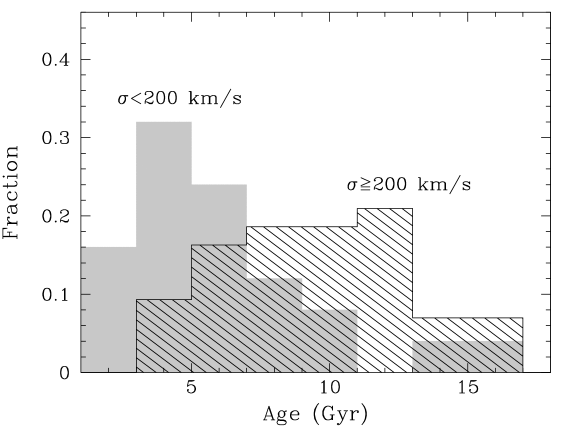
This result is better illustrated in Fig. 5, in which the age distributions of elliptical galaxies with velocity dispersions above and below 200 km/s are shown as the shaded and grey histograms, respectively. More than 50 per cent of the low-mass ellipticals, but only 10 per cent of the massive ellipticals, have average ages younger than 5 Gyr. The trend of massive ellipticals being older is in agreement with a recent study by Poggianti et al. (2001a) of a large number of Coma cluster galaxies. We add the important conclusion that this correlation is an intrinsic property of elliptical galaxies and does not depend on the environment.
It is interesting to note that lenticular galaxies do not follow this trend. There is a considerable fraction of S0 galaxies with km/s, for which we derive relatively young average ages ( Gyr). This might indicate recent star formation episodes in such objects as concluded by Poggianti et al. (2001b) or the existence of metal-poor subpopulations (Maraston & Thomas 2000; see the previous section).
4.4 Star formation histories
The relations shown in Fig. 4 can be used to constrain the epochs of the main star formation episode and the star formation timescales for objects as a function of their velocity dispersions. Assuming a Gaussian distribution for the star formation rate, we calculate the chemical enrichment of and Fe-peak elements for an initially primordial gas cloud. The delayed enrichment from Type Ia supernovae is taken into account using the prescription of Greggio & Renzini (1983; see Thomas, Greggio, & Bender 1998, 1999 for more details). The simulations are done for a set of different star formation histories (Gaussians) varying the star formation timescale (width) and the lookback time of the maximum star formation (peak). For this set of star formation histories we compute the -light averaged ages and [] ratios of the resulting composite stellar population today. These can be directly compared with the observationally derived values plotted in Fig. 4. Finally, the Gaussians are linked to velocity dispersion using the relation between and [] (left panel of Fig. 4).

The resulting star formation rates as a function of lookback time are shown in Fig. 6. The upper y-axis gives the corresponding redshifts assuming , and km/s/Mpc. The more massive the galaxy, the shorter is its formation timescale and the higher is its formation redshift. Galaxies with km/s exhibit significant star formation at redshifts . The star formation histories shown in Fig. 6 are in principle derived for cluster ellipticals, but are also valid for the bulk of field ellipticals and S0 galaxies, as only roughly 15 per cent deviate from the []-age relation in Fig. 4.
Most interestingly, objects are observed at high redshifts whose properties are consistent with the abundance ratios and star formation histories derived in this paper. At least part of the SCUBA sources at turn out to be star forming galaxies with extremely high star formation rates up to 1000 /yr (de Mello et al. 2002; Smail et al. 2002). They are difficult to detect in the optical rest-frame because they are enshrouded in dust. These objects are likely to be the precursors of the most massive ellipticals ( km/s) forming in a violent star formation episode at high redshift. Ly-break galaxies, instead, exhibit more moderate star formation rates of the order a few 10 /yr (Pettini et al. 2001), and may therefore be the precursors of less massive ellipticals ( km/s). In a recent work, Pettini et al. (2002) analyze deep Keck spectra of the lensed Ly-break galaxy cB58 at redshift (Seitz et al. 1998). They find the interstellar medium to be significantly -enhanced, which is in good agreement with the -enhancement derived in this paper for the stellar population of local elliptical galaxies.
5 Hierarchical Galaxy Formation
The element abundance ratios derived in this paper for massive ( km/s) early-type galaxies require star formation timescales below Gyr (see Fig. 6). In models of hierarchical galaxy formation, however, star formation in ellipticals typically does not truncate after 1 Gyr, but continues to lower redshift (Kauffmann 1996). It is therefore questionable if hierarchical clustering would lead to significantly -enhanced giant ellipticals (Bender 1996). In a more quantitative investigation, Thomas et al. (1999) compute the chemical enrichment in mergers of evolved spiral galaxies, and show that such a merger does not produce significantly super-solar ratios. This prediction is confirmed observationally by the study of Maraston et al. (2001), who find that the newly formed globular clusters in the merger remnant NGC 7252 and the integrated light of the galaxy are indeed not -enhanced.
So far, semi-analytic models have not considered this constraint. Thomas (1999) demonstrates that the average star formation history of cluster ellipticals within the hierarchical formation scheme leads to , a value that clearly lies below the observational estimates in Fig. 4. In Thomas & Kauffmann (1999), we follow this aspect in more detail by taking the star formation histories of individual Monte Carlo realizations of elliptical galaxies into account. This allows us to explore the distribution and the scatter of the ratios among the galaxies as they are predicted by the semi-analytic models. We calculate the chemical enrichment of closed box systems for the star formation rate predicted by semi-analytic models. Both modes of star formation, the quiescent and the merger induced burst components, are taken into account. A universal Salpeter IMF slope is assumed. The simulations in this analysis are for a cold dark matter power spectrum with , km/s/Mpc, and . For more details please refer to Thomas & Kauffmann (1999) and Thomas (1999).
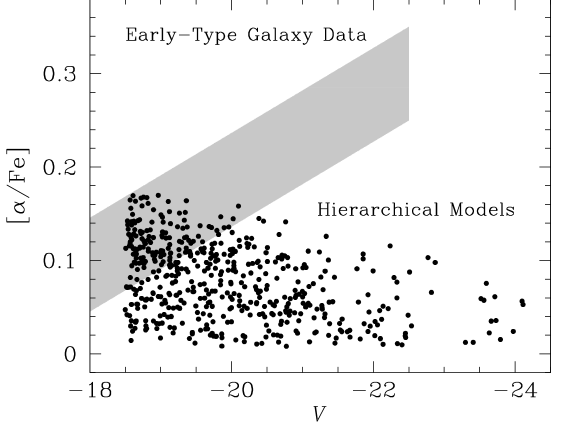
In Fig. 7, we plot the resulting [] ratios of elliptical galaxies as a function of their -magnitudes. The observationally derived [] ratios from Fig. 4 are indicated as the grey shaded area. The scatter in predicted by the hierarchical models is large because of the relatively large variety of formation histories comprising star formation timescales from to yr.
The figure reveals a striking failure of the hierarchical model: More luminous ellipticals are predicted to have lower ratios. The opposite is observed. As a consequence, the ratios predicted by the hierarchical models for massive elliptical galaxies are significantly below the observed values. These problems are directly related to the hierarchical clustering scheme, in which the largest objects form last and have therefore more extended star formation histories. This hierarchical paradigm leads also to the prediction of an age-mass anti-correlation (Kauffmann & Charlot 1998), which again stands in clear contradiction to the observational evidence that early-type galaxies with larger velocity dispersions tend to have higher average ages (see Section 4.2).
6 Discussion
As recently summarized by Peebles (2002), the arguments of this paper are accompanied by a number of evidences from the tightness and redshift evolution of the scaling relations of early-type galaxies. Both push the formation ages of the stellar populations in large elliptical galaxies to redshifts (e.g., Bower et al. 1992; Bender, Burstein, & Faber 1993; Renzini & Ciotti 1993; Bender, Ziegler, & Bruzual 1996; Kodama, Bower, & Bell 1999; Ziegler et al. 1999). These findings are not accomplished by standard hierarchical models.
At least part of the reason for this failure may be connected to the way how non-baryonic dark matter and baryonic matter are linked. In current models, star formation is tightly linked to the assembly history of dark matter halos, so that galaxies with longer assembly times also form stars on longer timescales. In a recent paper, Granato et al. (2001) present a promising—even though more heuristic—approach, in which star formation is enhanced in massive systems. The resulting ’anti-hierarchical baryonic collapse’ leads to higher formation redshifts and shorter formation timescales of the stellar populations in massive objects. A modification of this kind is certainly the right step towards reconciling hierarchical models with the constraints set by the stellar populations properties of early-type galaxies. Still, this modification may not be sufficient to harmonize hierarchical galaxy formation with the conclusion of Gerhard et al. (2001), who argue that the very high core densities of the halos of elliptical galaxies push also the collapse of their dark matter halos (not only of their baryonic matter) to high redshifts.
7 Summary
In this paper we derive the central average ages, metallicities, and ratios for 126 early-type galaxies from both cluster and field environments.
For this purpose we develop new population synthesis models with variable ratios, that allow for the derivation of these stellar population parameters from the Lick absorption line indices , , and . The models are based on the SSP models of Maraston (1998, 2002). The effect from varying the ratio is calculated with the Tripicco & Bell (1995) index response functions, following the method introduced by Trager et al. (2000a). At sub-solar metallicities we calibrate our models on galactic globular clusters, putting particular attention to the derivation of ratios. The base SSP models of Maraston (1998, 2002)—like all population synthesis models up to now—rely on stellar libraries that reflect the chemical history of the Milky Way. They are therefore biased towards super-solar ratios at sub-solar metallicities. We correct for this bias, so that our new SSP models reflect constant ratios at all metallicities.
For the sample of early-type galaxies investigated here, we find that ratios correlate well with velocity dispersion , independent of the environmental density. Elliptical galaxies and the majority of lenticular galaxies additionally exhibit a good correlation of ratio with average age. These results strongly support the view that the increase of with increasing velocity dispersion is due to a decrease of star formation timescales rather than due to a flattening of the IMF. We show that more massive ellipticals have higher average ages and higher ratios, because of earlier formation epochs and shorter formation timescales of their stellar populations. This observational result is not matched by current models of hierarchical galaxy formation, mainly because they predict too extended star formation histories for massive ellipticals.
Acknowledgments
DT thanks the organizers of the JENAM 2001 conference for the invitation to a highlight talk. We would like to acknowledge Santi Cassisi for providing a large number of stellar evolutionary tracks, and Beatriz Barbuy, Laura Greggio, Claudia Mendes de Oliveira, Dörte Mehlert, and Manuela Zoccali for very interesting and stimulating discussions. DT and CM give sincere thanks to Claudia Mendes de Oliveira, Beatriz Barbuy, and the members of the Instituto Astronomico e Geofisico of São Paulo for their kind hospitality. The the BMBF, the DAAD, and the "Sonderforschungsbereich 375-95 für Astro-Teilchenphysik" of the DFG are acknowledged for financial support.
References
Bender, R. 1996, in New Light on Galaxy Evolution, ed. R. Bender & R. L. Davies (Dordrecht: Kluwer Academic Publishers), 181
Bender, R., Burstein, D., & Faber, S. M. 1993, ApJ, 411, 153
Bender, R., Ziegler, B. L., & Bruzual, G. 1996, ApJ, 463, L51
Bergbusch, P. A., & VandenBerg, D. A. 2001, ApJ, 556, 322
Bernardi, M., et al. 1998, ApJ, 508, 143
Beuing, J., Bender, R., Mendes de Oliveira, C., Thomas, D., & Maraston, C. 2002, A&A, submitted
Bono, G., Caputo, F., Cassisi, S., Castellani, V., & Marconi, M. 1997, ApJ, 489, 822
Borges, A. C., Idiart, T. P., de Freitas Pacheco, J. A., & Thévenin, F. 1995, AJ, 110, 2408
Bower, R. G., Lucey, J. R., & Ellis, R. S. 1992, MNRAS, 254, 589
Buzzoni, A., Gariboldi, G., & Mantegazza, L. 1992, AJ, 103, 1814
Buzzoni, A., Mantegazza, L., & Gariboldi, G. 1994, AJ, 107, 513
Carney, B. W. 1996, PASP, 108, 900
Cassisi, S., Castellani, M., & Castellani, V. 1997, A&A, 317, 10
Colless, M., Burstein, D., Davies, R. L., McMahan, R. K., Saglia, R. P., & Wegner, G. 1999, MNRAS, 303, 813
Covino, S., Galletti, S., & Pasinetti, L. E. 1995, A&A, 303, 79
Davies, R. L., Sadler, E. M., & Peletier, R. F. 1993, MNRAS, 262, 650
de Mello, D., Wiklind, T., Leitherer, C., & Pontoppidan, K. 2002, in The Evolution of Galaxies II. Basic Building Blocks, ed. M. Sauvage, G. Stasinska, L. Vigroux, D. Schaerer, & S. Madden (Dordrecht: Kluwer), in press
Faber, S. M., Friel, E. D., Burstein, D., & Gaskell, D. M. 1985, ApJS, 57, 711
Fisher, D., Franx, M., & Illingworth, G. 1995, ApJ, 448, 119
Gerhard, O., Kronawitter, A., Saglia, R. P., & Bender, R. 2001, AJ, 121, 1936
González, J. 1993, Phd thesis, University of California, Santa Cruz
Granato, G. L., Silva, L., Monaco, P., Panuzzo, P., Salucci, P., De Zotti, G., & Danese, L. 2001, MNRAS, 324, 757
Greggio, L., & Renzini, A. 1983, A&A, 118, 217
Harris, W. E. 1996, AJ, 112, 1487
Kauffmann, G. 1996, MNRAS, 281, 487
Kauffmann, G., & Charlot, S. 1998, MNRAS, 294, 705
Kodama, T., Bower, R. G., & Bell, E. F. 1999, MNRAS, 306, 561
Kuntschner, H. 2000, MNRAS, 315, 184
Kurth, O. M., Fritze-v. Alvensleben, U., & Fricke, K. J. 1999, A&AS, 138, 19
Lauberts, A., & Valentijn, E. A. 1989, The Surface Photometry Catalogue of the ESO–Upsalla Galaxies (Garching: ESO)
Lee, Y.-W. 1990, ApJ, 363, 159
Maraston, C. 1998, MNRAS, 300, 872
Maraston, C. 2002, MNRAS, in preparation
Maraston, C., et al. 2002, in preparation
Maraston, C., Greggio, L., & Thomas, D. 2001, Ap&SS, 276, 893
Maraston, C., Kissler-Patig, M., Brodie, J. P., Barmby, P., & Huchra, J. 2001, A&A, 370, 176
Maraston, C., & Thomas, D. 2000, ApJ, 541, 126
Matteucci, F. 1994, A&A, 288, 57
McWilliam, A. 1997, ARA&A, 35, 503
Mehlert, D., Saglia, R. P., Bender, R., & Wegner, G. 2000, A&AS, 141, 449
Peebles, P. J. E. 2002, in A New Era in Cosmology, ed. N. Metcalfe & T. Shanks, ASP Conference Series (Dordrecht: Kluwer Academic Publishers), in press
Pettini, M., Rix, S. A., Steidel, C. C., Adelberger, K. L., Hunt, M. P., & Shapley, A. E. 2002, ApJ, in press, astro-ph/0110637
Pettini, M., Shapley, A. E., Steidel, C. C., Cuby, J., Dickinson, M., Moorwood, A. F. M., Adelberger, K. L., & Giavalisco, M. 2001, ApJ, 554, 981
Piotto, G., Rosenberg, A., Saviane, I., Zoccali, M., & Aparicio, A. 2000, in Ap&SS Library, Vol. 255, The evolution of the Milky Way: stars versus clusters, ed. F. Matteucci & F. Giovannelli (Dordrecht: Kluwer Academic Publishers), 249
Poggianti, B., et al. 2001a, ApJ, 562, 689
Poggianti, B., et al. 2001b, ApJ, 563, 118
Puzia, T., et al. 2002, in preparation
Renzini, A., & Buzzoni, A. 1986, in Spectral evolution of galaxies, ed. C. Chiosi & A. Renzini (Dordrecht: Reidel), 135
Renzini, A., & Ciotti, L. 1993, ApJ, 416, L49
Rosenberg, A., Saviane, I., Piotto, G., & Aparicio, A. 1999, AJ, 118, 2306
Salaris, M., & Cassisi, S. 1996, A&A, 305, 858
Salasnich, B., Girardi, L., Weiss, A., & Chiosi, C. 2000, A&A, 361, 1023
Seitz, S., Saglia, R. P., Bender, R., Hopp, U., Belloni, P., & Ziegler, B. 1998, MNRAS, 298, 945
Smail, I., Ivison, R. J., Blain, A. W., & Kneib, J.-P. 2002, MNRAS, in press, astro-ph/0112100
Tantalo, R., Chiosi, C., Bressan, A., & Fagotto, F. 1996, A&A, 311, 361
Thomas, D. 1999, MNRAS, 306, 655
Thomas, D., Greggio, L., & Bender, R. 1998, MNRAS, 296, 119
Thomas, D., Greggio, L., & Bender, R. 1999, MNRAS, 302, 537
Thomas, D., & Kauffmann, G. 1999, in Spectrophotometric dating of stars and galaxies, ed. I. Hubeny, S. Heap, & R. Cornett, Vol. 192 (ASP Conf. Ser.), 261
Thomas, D., Maraston, C., & Bender, R. 2002, MNRAS, in preparation
Trager, S. C., Faber, S. M., Worthey, G., & González, J. J. 2000a, AJ, 119, 164
Trager, S. C., Faber, S. M., Worthey, G., & González, J. J. 2000b, AJ, 120, 165
Trager, S. C., Worthey, G., Faber, S. M., Burstein, D., & González, J. J. 1998, ApJS, 116, 1
Tripicco, M. J., & Bell, R. A. 1995, AJ, 110, 3035
VandenBerg, D. A. 2000, ApJS, 129, 315
Vazdekis, A., Casuso, E., Peletier, R. F., & Beckmann, J. E. 1996, ApJS, 106, 307
Worthey, G. 1994, ApJS, 95, 107
Worthey, G., Faber, S. M., & González, J. J. 1992, ApJ, 398, 69
Worthey, G., Faber, S. M., González, J. J., & Burstein, D. 1994, ApJS, 94, 687
Ziegler, B. L., Saglia, R. P., Bender, R., Belloni, P., Greggio, L., & Seitz, S. 1999, A&A, 346, 13