email: amoor@eso.org 22institutetext: Kapteyn Institute, P.O. Box 800, NL-9700 AV Groningen, the Netherlands
email: spoon@astro.rug.nl, j.keane@astro.rug.nl, tielens@astro.rug.nl 33institutetext: SRON, P.O. Box 800, NL-9700 AV Groningen, the Netherlands 44institutetext: Max-Planck-Institut für Extraterrestrische Physik (MPE), Postfach 1312, 85741 Garching, Germany
email: lutz@mpe.mpg.de
Ice features in the mid-IR spectra of galactic nuclei ††thanks: Based on observations with ISO, an ESA project with instruments funded by ESA Member States (especially the PI countries: France, Germany, the Netherlands and the United Kingdom) and with the participation of ISAS and NASA
Mid infrared spectra provide a powerful probe of the conditions
in dusty galactic nuclei. They variously contain emission features
associated with star forming regions and absorptions by circumnuclear
silicate dust plus ices in cold molecular cloud material. Here we report
the detection of 6–8 m water ice absorption
in 18 galaxies observed by ISO. While the mid-IR spectra of some of
these galaxies show a strong resemblance to the heavily absorbed
spectrum of NGC 4418, other galaxies in this sample also show weak
to strong PAH emission. The 18 ice galaxies are part of a sample of
103 galaxies with good S/N mid-IR ISO spectra. Based on our sample we
find that ice is present in most of the ULIRGs, whereas it is weak
or absent in the large majority of Seyferts and starburst galaxies.
This result is consistent with the presence of larger quantities of
molecular material in ULIRGs as opposed to other galaxy types.
Like NGC 4418, several of our ice galaxy spectra show a maximum
near 8 m that is not or only partly due to PAH emission. While
this affects only a small part of the galaxy population studied by
ISO, it stresses the need for high S/N data and refined diagnostic
methods, to properly discriminate spectra dominated by PAH emission
and spectra dominated by heavy obscuration.
The spectral variation from PAH emission to absorbed continuum emission
near 8 m shows strong similarities with Galactic star forming
clouds. This leads us to believe that our classification of ice galaxy
spectra might reflect an evolutionary sequence from strongly obscured
beginnings of star formation (and AGN activity) to a less enshrouded
stage of advanced star formation (and AGN activity), as the PAHs get
stronger and the broad 8 m feature weakens.
Key Words.:
Galaxies: ISM — Galaxies: nuclei — Galaxies: Seyfert — Galaxies: starburst — Infrared: galaxies — Infrared: ISM1 Introduction
Prior to the ISO mission, the mid-IR spectra of galaxies could only be studied from the ground in certain windows of reduced atmospheric absorption. For the far brighter Galactic sources less limitations applied, as these could be studied with airborne telescopes, like the Kuiper Airborne Observatory (KAO: 1974-1995). Hence, before the advent of ISO, most of the prominent mid-IR ISM features had already been studied in some detail for Galactic sources, but not yet for extragalactic sources. Equipped with three mid-IR spectro(photo)meters, ISO has since enhanced considerably our knowledge of the mid-IR spectral properties of normal, starburst, Seyfert and Ultra-luminous Infrared Galaxies (ULIRGs).
The mid-IR spectra of most galaxies are dominated by ISM emission features, the most prominent of which are the well-known PAH emission bands at 6.2, 7.7, 8.6, 11.3 and 12.7 m and atomic emission lines. The PAH features and the emission lines have been used qualitatively and quantitatively as diagnostics for the ultimate physical processes powering galactic nuclei (Genzel et al. Genzel (1998); Lutz et al. Lutz98 (1998); Rigopoulou et al. Rigopoulou (1999); Clavel et al. Clavel (2000); Helou et al. Helou (2000); Tran et al. Tran (2001)). A broad absorption band due to the Si-O stretching mode in amorphous silicates, centered at 9.7 m, is also commonly detected in galaxies. Since the center of the silicate absorption coincides with a gap between the 6.2–8.6 m and 11.3–12.8 m PAH complexes, it is not readily apparent whether a 9.7 m flux minimum should be interpreted as the “trough” between PAH emission features or as strong silicate absorption, or as a combination of the two.
In spectra observed towards heavily extincted Galactic lines of sight, like deeply embedded massive protostars, a strong silicate feature is often accompanied by mid-IR ice absorption features due to molecules, frozen in grain mantles (Whittet et al. Whittet96 (1996); Keane et al. Keane (2001)). Among the simple ice molecules that have been identified in these grains are: H2O, CO2, CH3OH, CO and CH4 ice. The first detections of interstellar ices in external galaxies were reported by Spoon et al. (Spoon00 (2000)) and Sturm et al. (Sturm (2000)) in the nuclear spectra of NGC 4945, M 82 & NGC 253. At the low resolution of the ISO-PHT-S spectrophotometer a deep and broad 3.0 m water ice feature, with the red wing extending far beyond the 3.3 m PAH feature, is clearly visible in the spectrum of NGC 4945. Also identified in the spectrum of NGC 4945 are absorptions due to 4.26 m CO2 ice and the unresolved blend of 4.62 m ‘XCN’ with 4.67 m CO ice and 4.6–4.8 m CO gas phase lines.
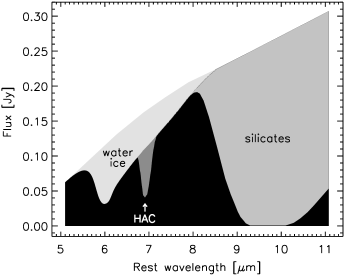
The first detections of 6–8 m ices in extragalactic sources were made in the strongly absorbed mid-IR spectra of NGC 4418 (Spoon et al. Spoon01 (2001)) and IRAS 00183–7111 (Tran et al. Tran (2001)). Especially rich is the spectrum of NGC 4418, which displays absorption features due to 6.0 m water ice, 6.85 & 7.3 m hydrogenated amorphous carbons (HAC) and 7.67 m CH4 ice, accompanied by a very deep 9.7 m silicate feature.
Encouraged by these findings we have searched our database of 250 galaxies observed spectroscopically by ISO for galaxies showing similar 6–8 m absorptions. In this paper we present the outcome of this search, which resulted in a sample of 18 galaxies showing evidence for the presence of 6.0 m water ice. Sect. 2 describes the sample. In Sect. 3, we discuss the complex interplay of 6.0 m water ice and 5.25, 5.7, 6.25 m PAH emission as well as the effect of redshift on the detectability of the blue wing of the water ice feature in ISO data. Sect. 4 describes the classification of the ice galaxies. In Sect. 5, we present the absorption and emission profile analysis. The results are discussed in Sect. 6. Conclusions are stated in Sect. 7.

2 Observations
2.1 ISO galaxy sample
In order to study the mid-infrared spectral properties of galaxies we have created a database of some 250 ISO galaxy spectra. The database has been compiled from observations performed with the PHT-S, CAM-CVF and SWS-01 instrument modes of ISO. The database comprises:
-
•
Nearly all ISO-PHT-S galaxy observations from a variety of programs, except for galaxies at R.A. 13–24 hrs from the “Normal Galaxy” program (P.I. G. Helou).
-
•
Four ISO-SWS-01 spectra of nearby galactic nuclei (Sturm et al. Sturm (2000)).
- •
By nature, this sample is not complete in any strict statistical sense.
2.2 Selected sample
We have defined a subsample of galaxies with good S/N spectra and sufficient wavelength coverage blueward of 6.0 m. The criteria we applied were (S/N)6.5μm 8 and, for ISO-PHT-S in addition, cz3000 km/s. The resulting sample of 103 galaxies misses many of the observations of fainter ULIRGs and nearby galaxies in the ISO archive. It is dominated by Seyferts, which constitute nearly half the sample.
Within this sample we found 18 galaxies showing 6.0 m H2O ice absorption (Figs. 5—8), including NGC 4418 (Spoon et al. Spoon01 (2001)). We also looked for galaxies showing the opposite: no sign of water ice up to 0.1–0.3 along the line of sight. Within our sample of 103 good S/N galaxy spectra, 28 galaxies fulfil this criterion. Examples of ice-poor galaxies are shown in Figs. 2, 9 & 10. For the remaining 57 out of 103 galaxies, the quality of the spectra is either not good enough to detect the presence of a 6.0 m water ice feature (a higher S/N criterion would have biased the sample against PAH-dominated spectra, which are weaker at 6–7 m than continuum dominated AGN spectra), or to establish an upper limit better than 0.3 for the amount of water ice.
In the following Sections we show spectra for 32 galaxies. These spectra were obtained using the ISO-CAM-CVF (Cesarsky et al. Cesarsky (1996)), ISO-PHT-S (Lemke et al. Lemke (1996)) and ISO-SWS (De Graauw et al. DeGraauw (1996)) spectro(photo)meters aboard ISO (Kessler et al. Kessler (1996)).
The ISO-CAM-CVF spectra of galaxies I 00183–7111, I 00188–0856 and Arp 220 have been taken from Tran et al. (Tran (2001)). The ISO-CAM-CVF spectra of NGC 253, NGC 613, NGC 1068, M 82, NGC 1365, NGC 1808, NGC 4945, M 83, Circinus and I 23128–5919 have been taken from Laurent et al. (Laurent (2000)).
The ISO-PHT-S spectra of galaxies Mrk 334, NGC 23, I 01173+1405, NGC 828, I 04385–0828, I 05189–2524, MGC 8–11–11, I 06035–7102, UGC 5101, Mrk 231, Mrk 273, Mrk 279, I 15250+3609, Arp 220, I 17208–0014, PKS 2048–57, I 20551–4250 and I 23128–5919 have been reduced using standard routines of PIA111PIA is a joint development by the ESA Astrophysics Division and the ISO-PHT Consortium versions 8.1–9.0.1. The ISO-PHT-S spectra of NGC 4418 and NGC 4945 have been taken from Spoon et al. (Spoon01 (2001)) and Spoon et al. (Spoon00 (2000)), respectively.
3 Ice absorption and PAH emission in the 5–7 m region
Before discussing the presence and strength of ice features in the sources of our sample, we illustrate the interplay of emission and absorption using a simple toy model. This is necessary since the 6 m ice feature is not always seen against a well-defined continuum. The ‘PAH’ emission features at 7.7, 6.2, 5.7, and 5.25 m may be present as well, leading to possible confusion of minima between emissions with absorption. In addition, the wavelength coverage of the ISO data limits the accessible range, in particular for low redshift objects observed with ISO-PHOT-SL (starting at 5.84 m). Our model produces high resolution spectra ( 1000) of the 5–7 m spectral region, comprising an ice absorption feature and PAH emission bands superimposed on a continuum. Here, we describe the various components of the model, the consequences of rebinning to the lower ISO-PHT-S and ISO-CAM-CVF resolution ( 40–90) and also explore the effect that extinction may have on the resulting spectra. In addition, we produce model-spectra at different redshifts in order to investigate the effect that this has on the spectral signatures, in particular the relationship between redshift and wavelength coverage, which is particularly important for ISO-PHT-S spectra.
3.1 Components of the model
The components chosen for the model closely mimic absorption (ice) and emisson (PAH) features seen toward a variety of Galactic objects that have been extensively studied at high resolution. The spectra are modelled as: F + PAHs. In order to allow easy comparison of the model generated pseudo-spectra, a false flat continuum is adopted. In Sect. 5 the flat continuum is replaced by continuum choices fitting the individual observed spectra. Our model ignores any contribution from the PAHs to the overall continuum. This so-called PAH continuum can be seen in for instance the spectrum of the reflection nebula NGC 7023 (Moutou et al. Moutou (1998)) as the continuum extending below the PAH features. Since the PAH continuum only serves to dilute the other continuum and its associated ice feature, we ignore it here.
Studies of Galactic star-forming regions, in particular high mass embedded protostars, with the short wavelength spectrometer (SWS) of ISO show strong absorption features centred around 3.0 m and 6.0 m attributed to amorphous ice. The spectral characteristics of ice (whether pure or in various mixtures) have been well studied in the laboratory (Hagen et al. Hagen (1983); Hudgins et al. Hudgins (1993); Maldoni et al. Maldoni (1998)). The spectral changes that occur during warm-up from 10 K to 120 K are irreversible. In the case of the 6.0 m H2O band, there is little spectral difference during warm-up from 10 K to 50 K though the band begins to broaden slightly and around 80 K this effect is becomes discernible. This broadening reflects an annealing of the amorphous structure. Further thermal cycling between 120 K and 10 K produces reversible effects due to thermal shinking and expansion of the ice lattice which causes more minor variations in the width of the bands, particularly at 6.0 . Beyond 120 K the ice lattice transforms to polycrystalline ice. This is particularly noticeable in the 3.0 m H2O band as sharp structure begins to appear. Though the bulk of the interstellar 3.0 and 6.0 absorption bands have been attributed to amorphous ice, there is also evidence of additional molecules contributing to this feature in a number of sources (Dartois & d’Hendecourt 2001; Keane et al. Keane (2001)). As a conseqence of this, the astronomical 6.0 m feature varies somewhat from source to source and therefore is not well suited to our simple model. Given the lack of 3.0 m H2O observational data for our sample, we have elected to represent the 6.0 m ice absorption profile by a laboratory spectrum of pure amorphous ice at 12 K. This profile has been shown to satisfactorily reproduce the 6.0 m H2O feature observed toward a number of Galactic young stellar objects (Keane et al. Keane (2001)). The left panel of Fig. 1a shows the profile of the 12 K feature (database of the Sackler Laboratory for Astrophysics in Leiden: http://www.strw.leidenuniv.nl/lab/). The most striking aspect of this profile is the broad long wavelength wing which extends at least as far as 8.0 m. There is little or no variation in the profile for temperatures 50 K. For temperatures greater than this the broad wing becomes deeper and extends well beyond 8.0 m. The right panel of Fig. 1a shows the spectrum after it has been rebinned to the lower resolution of ISO-PHT-S (histogram) and ISO-CAM-CVF (grey line), assuming a cz=12000 km s-1. The profile is of course very similar but for the ISO-PHT-S spectrum there is incomplete pixel coverage of the short wavelength wing when compared to the ISO-CAM-CVF spectrum. The dominant PAH emission features (6.2, 7.7, 8.6, 11.3 m), observed toward a variety of Galactic sources, show a wide degree of variation in the detailed profile shapes and relative intensities (Peeters et al. Peeters (2002)). On the other hand, observations of PAH emission bands in external galaxies reveal very little variation in the profiles (Rigopoulou et al. Rigopoulou (1999); Helou et al. Helou (2000)). Since one of the main aims of the model is to investigate the effect of rebinning spectral features to the lower resolutions of ISO-PHT-S and ISO-CAM-CVF, adopting extra-galactic PAH emission profiles is inappropriate. Instead, high resolution Galactic PAH emission band profiles are adopted. The ISO-SWS PAH emission spectrum of the Orion bar PAH is chosen for the model as this is a good representation of a region of active star-formation (Peeters et al. Peeters (2002)). The left panel of Fig. 1a shows the high resolution spectrum of the Orion Bar. Apart from the typical 6.2 m PAH CC stretching mode, the observed spectrum also shows evidence for two weak PAH emission features near 5.25 m and 5.7 m (left panel of Fig. 1a). The nature of these weak PAH features is not very well studied but they are believed to be combinations or overtone bands involving C-H bending vibrations (Allamandola et al. Allamandola (1989)). The strength of these weak bands relative to the strong 6.2 m band is variable. Of a sample of 35 compact HII regions studied by Peeters et al. (in prep.) roughly 10% of the sources show evidence for these weak PAH bands. Consequently, because of their variable strength, their presence is not always assured in spectra showing the dominant PAH bands and there is no rule of thumb defining an expected ratio for the intensity of these weak PAH bands to the 6.2 m band. The Orion bar is among the Galactic sources with the strongest 5.25 and 5.7 m features relative to the 6.2 m feature. Comparison with high S/N CAM-CVF spectra of the brightest nearby starbursts suggests it to be fairly representative for those objects however (Fig. 2, confirmed by SWS spectroscopy of M 82 and NGC 253 (Sturm et al. Sturm (2000))). We hence adopt the Orion Bar as a template for the 5.25, 5.7, and 6.2 m PAH features. The PAH spectrum in Fig. 1 was obtained by subtracting a spline continuum from its spectrum. Fig. 1 then suggests that in the presence of strong PAH emission, a shallow 6.0 m ice absorption of less than about 10% of the peak height of the 6.2 m PAH feature is very difficult to discriminate from the minimum between the 5.7 and 6.2 m PAH features, especially for the limited wavelength coverage of ISO-PHT-S. Finally, the 7.7 and 8.6 m PAH bands have been clipped from the spectrum as they will be dealt with separately (Spoon et al. in prep.).
The right panel of Fig. 1a shows the Orion-Bar PAH features rebinned to the lower resolution of ISO-PHT-S (histogram) and ISO-CAM-CVF (grey line). In rebinning, the peak height of the 6.2 m feature is reduced, more for ISO-CAM-CVF than for ISO-PHT-S. In the ISO-CAM-CVF spectrum, the weak PAH bands are still present, though they are flattened and broaded as compared to the high resolution spectrum. Only the peak of the 5.7 m weak PAH feature is present in the ISO-PHT-S spectrum since at a cz of 12000 km s-1 the first pixel is at 5.6 m. This is discussed further in Sect. 3.3. Finally, the location of the water (i.e., in front, behind or mixed with the PAHs) had little effect on the resulting shape of the spectral features, in particular on the profile of the 6.2 m feature. We hence ignored extinction on the PAHs in our toy model. Detailed fits to the extragalactic spectra are presented in Sect. 5, in which the flat continuum is replaced by continua determined individually for each galaxy.
3.2 Effects on the model of varying the component contributions and extinction
To investigate the interplay of the absorption feature and the 6.2 m PAH emission bands, the relative contribution of each component is varied. This is shown in Fig. 1b–d, where the left panel is the high resolution input spectrum and the right panel represents the rebinned low resolution pseudo spectra of the model. The dotted line indicates the flat continuum. Panel (b) illustrates the effect of a strong band on the PAH emission bands. Regardless of the fact that the 6.2 m features lies within the long wavelength wing of the feature, its profile is preserved (left panel). The 5.7 m weak PAH band, on the other hand, is lost within the short wavelength wing, though there is a slight hint of a peak at 5.7 m. The 5.25 m PAH feature is still present as the profile does not reach as far as this short wavelength position. Rebinning to the low resolution of ISO-PHT-S and ISO-CAM-CVF (right panel) shows that the feature, in combination with the 6.2 m PAH emission band, dominate the model spectrum and there is little if no evidence for the weak PAH bands in the ISO-PHT-S spectrum. Only the ISO-CAM-CVF spectrum reveals the presence of the 5.25 m weak PAH band, due to the wider wavelength coverage. As the strength of the absorption band is reduced (Panels (c) and (d)), the 6.2 m feature starts to dominate the model spectra and now only weakly sits within the long wavelength wing of the feature. Also, the spectral signature of the 5.7 m weak PAH band starts to become pronounced and in Panel (d) the structure is clearly distinguished lying above the flat continuum. The crucial result of this study is that the profile of the 6.2 m PAH band is little affected by the presence of an ice absorption feature. In addition, it is evident from this analysis that the weak PAH bands do not influence the overall characteristics of the structure seen in the model spectra. However, the weak PAH emission features may enhance/mimick the effects of weak ice absorption.
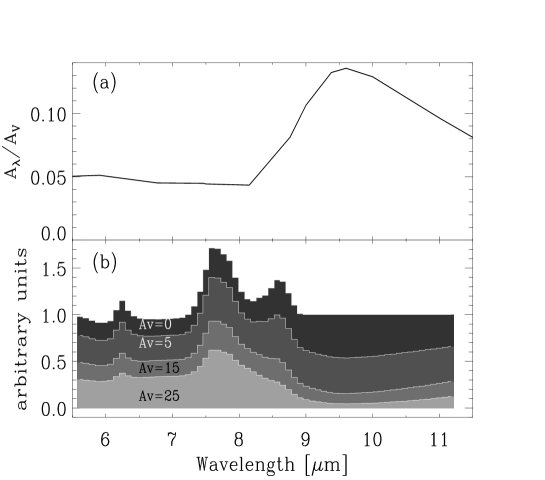
The possible effect that extinction may have on the spectral features of the pseudo spectra were also investigated. In light of the fact that the Galactic Center has been well studied and also because of the homogeneous nature of the foreground extinction, the extinction law derived by Lutz (Lutz99 (1999)) for the Galactic Centre is adopted (Fig. 3a). We have also investigated the effect of other extinction laws (Tran et al. Tran (2001); Draine Draine (1989)) but they are substantially the same and only the effects of the Lutz Law are discussed in detail here. The extinction is applied as if the continuum+PAH+ice combination were behind a column of material. Though the situation is less clear for external galaxies, this approach allows for a qualitative assessment of the effect of extinction on the model spectra. In order to clearly demonstrate the effect of extinction, the 7.7 and 8.6 m PAH bands of the Orion Bar have been included. The top plot in Fig. 3b shows the unextincted (Av=0) model spectrum. As the degree of extinction increases from Av=0 to Av=25 the 8.6 m PAH band is ”eaten away” by the short wavelength wing of the 10 m silicate feature. Eventually, the depth of the silicate band is so great that the 8.6 m feature is completely lost within this band. The same effect, but with less severity, is noticeable for the 7.7 m emission feature. In the case of the 6.2 m band, the peak intensity decreases as the degree of extinction increases, but information on the profile shape remains intact and distinguishable. Thus, the spectral characteristics of features shortward of 7 m are unaffected by the effects of extinction. Furthermore, due to the sensitivity of the features beyond 7 m to the degree of extinction they have been neglected in the model.
3.3 Profile appearance as a function of redshift
We have also investigated the effects of redshift combined with the limited spectral coverage on the appearance of the spectrum. A redshift (cz) range of 0 km s-1 to 20 000 km s-1 was chosen as this is representative of the cz range of the observed galaxies (Table LABEL:optdepths). Fig. 4 illustrates the spectral variation as a function of redshift. The high resolution spectrum shown in panel (b) of Fig. 1 was adopted as the input to the rebinning routines and as before the histogram and the grey line represent the ISO-PHT-S and ISO-CAM-CVF rebinned data, respectively. Since the spectral coverage of ISO-CAM-CVF extends down as far as 5 m there is not much variation in the position of the first pixels as a function of redshift. Hence in Fig. 4 only one ISO-CAM-CVF spectrum is shown. For redshifts of 6000 km s-1 or greater, the 6.0 m absorption profile is readily seen in the model ISO-PHT-S spectra. On the other-hand, the presence of is not so obvious in ISO-PHT-S spectra for redshifts less than 6000 km s-1. As the redshift decreases the pixel coverage of the short wavelength wing of the absorption feature diminishes and only one or two pixels begin to rise at the shortest wavelengths. Consequently, there is not much real evidence for the blue wing of the band even though the original high resolution model spectrum clearly shows strong ice absorption (panel (b) in Fig. 1). In the case of the 6.2 m PAH emission band, the only notably change is that the rebinned structure of the profile peak varies with redshift.
4 Classification
Although likely the spectra of galaxies represent a continuous distribution with variable absorption and emission components, we have classified the galaxies in our sample into six categories, based on their mid-IR spectral properties. The first three catagories comprise the galaxies with evidence for the presence of 6.0 m water ice absorption in their spectra:
-
•
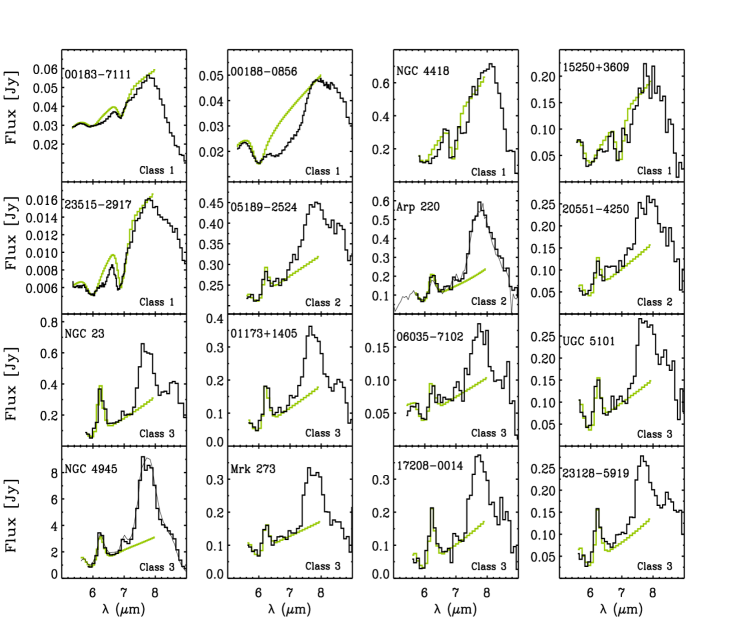
Class 1: These galaxies (Fig. 5) exhibit a 6.0 m H2O ice absorption feature, without contamination by 6.2 m PAH emission. Galaxies of this type also show other 6–8 m absorption features – most commonly the 6.85 m feature, attributed to HAC. Note that all galaxies in this class have a broad flux peak at 8 m. Judging from their complete 2–200 m SEDs, all Class 1 galaxies have a deep 9.7 m silicate feature. For the two galaxies for which 2–5 m ISO-PHT-S data is available, NGC 4418 and IRAS 15250+3609, there is a sharp increase in flux between 5 and 6 m.
-
•
Class 2: These galaxies (Fig. 6) show 6.0 m H2O ice absorption features, partially filled-in by weak 6.2 m PAH emission. Other 6–8 m absorption features are not always as apparent. Note that like in Class 1, all galaxies in this class have a broad 8 m feature.
-
•
Class 3: These galaxies (Fig. 7& 8) exhibit a 6.0 m H2O ice absorption feature, largely filled in by strong 6.2 m PAH emission. No other 6–8 m absorption features have been found. All galaxies in this class show a 7.7 m PAH emission peak, clearly narrower than the broad 8.0 m feature seen in Class 1 & 2 galaxies.
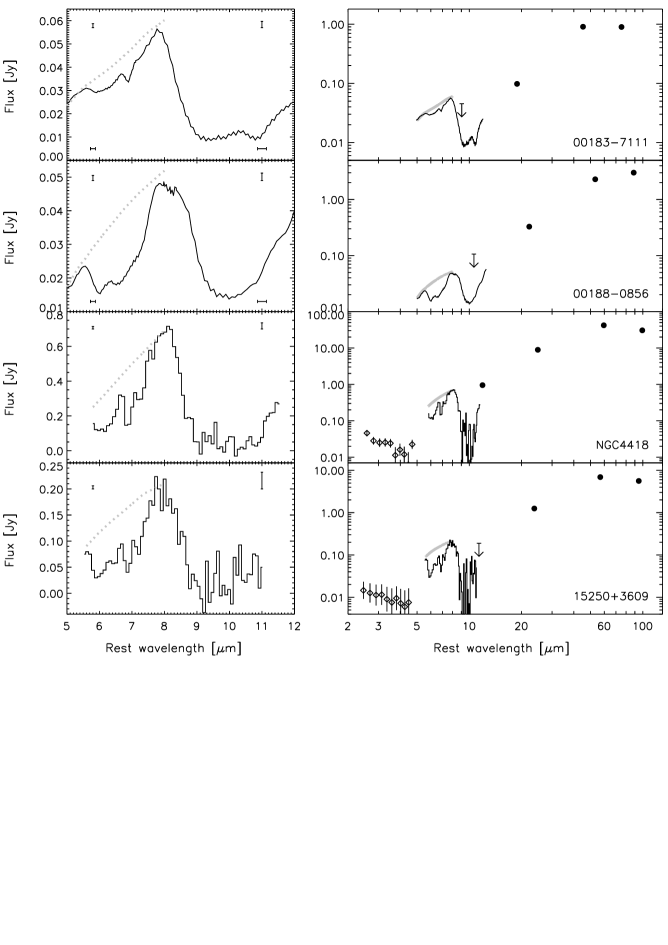
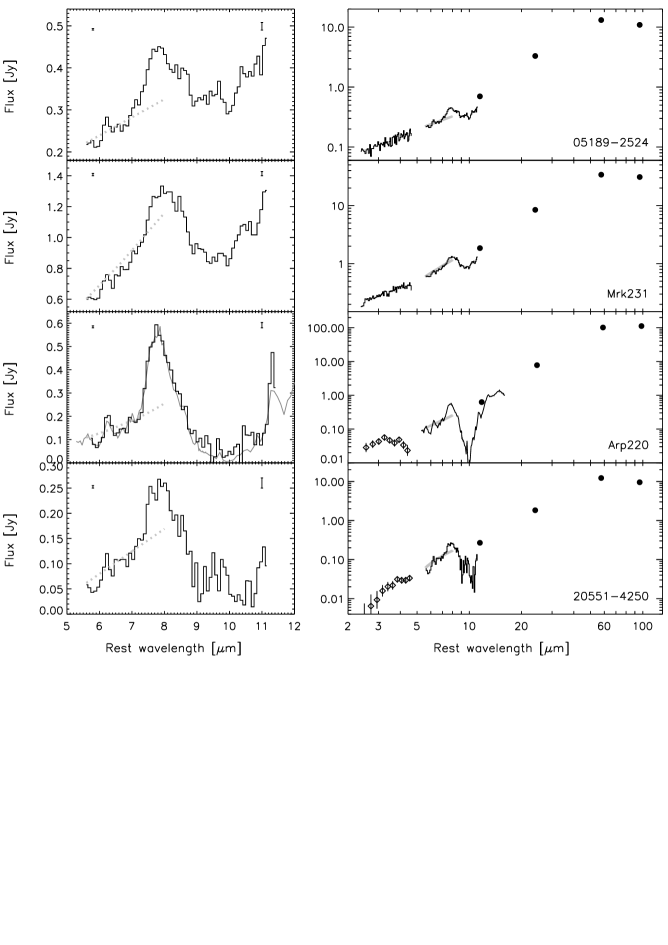
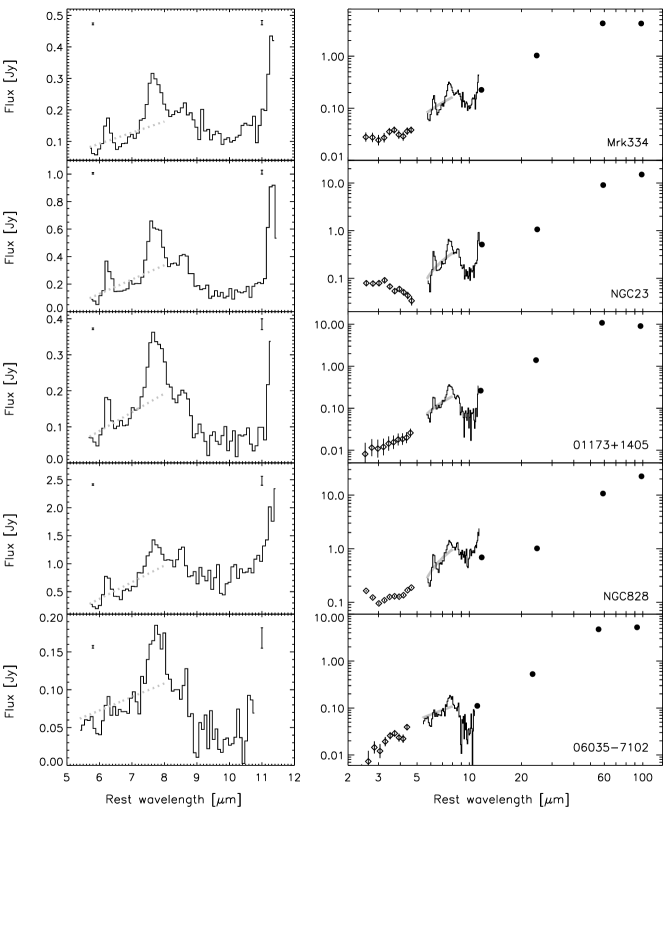
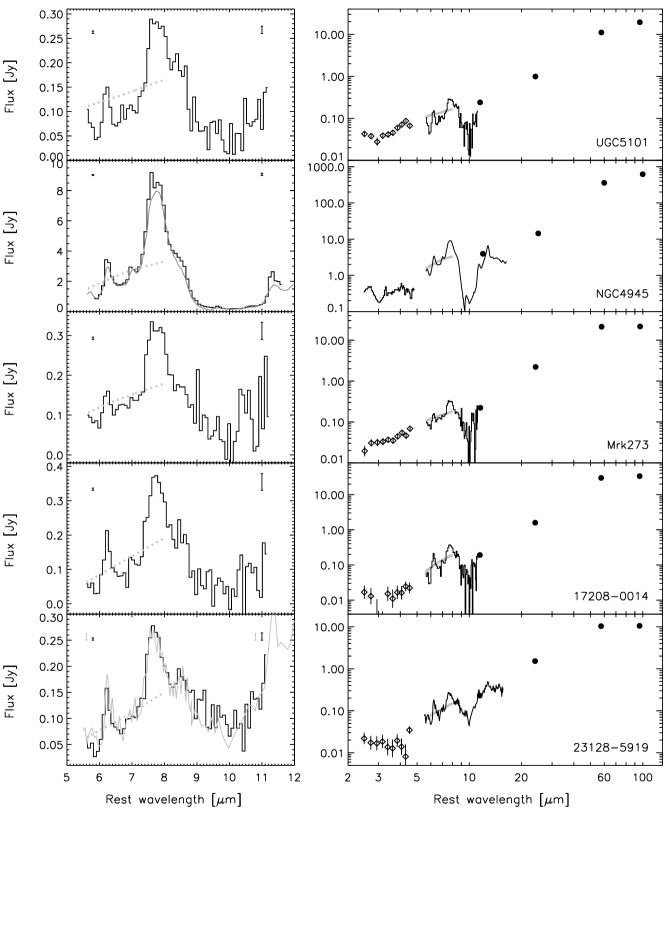
Table LABEL:optdepths lists the classification for all 18 ice galaxies. For completeness we also list galaxies with 3.0 m ice absorption in their nuclear spectra: NGC 253, M 82 and NGC 4945 (Sturm et al. Sturm (2000); Spoon et al. Spoon00 (2000)). Only for NGC 4945 has the usually far weaker 6.0 m feature also been detected – at similar strength as the 3.0 m one. This apparent inconsistency may be due to aperture size effects (the 3.0 m feature was measured by ISO-PHT-S; the 6.0 m feature by ISO-CAM-CVF) or due to dilution by less obscured emission, filling in the water ice features.
Within our sample of 103 galaxies with good S/N spectra and sufficient wavelength coverage we also recognize three other classes of spectra:
-
•
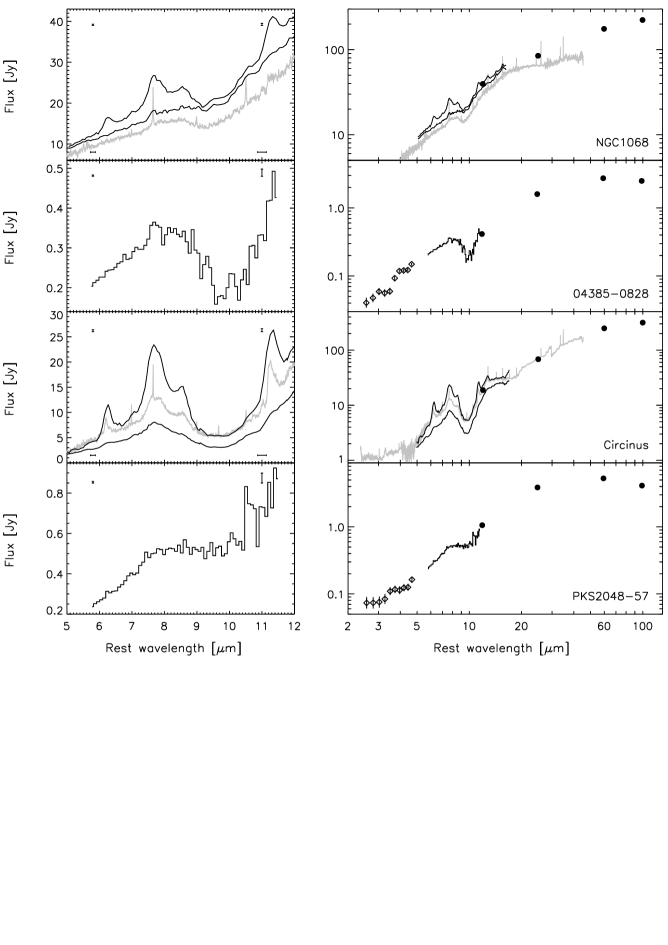
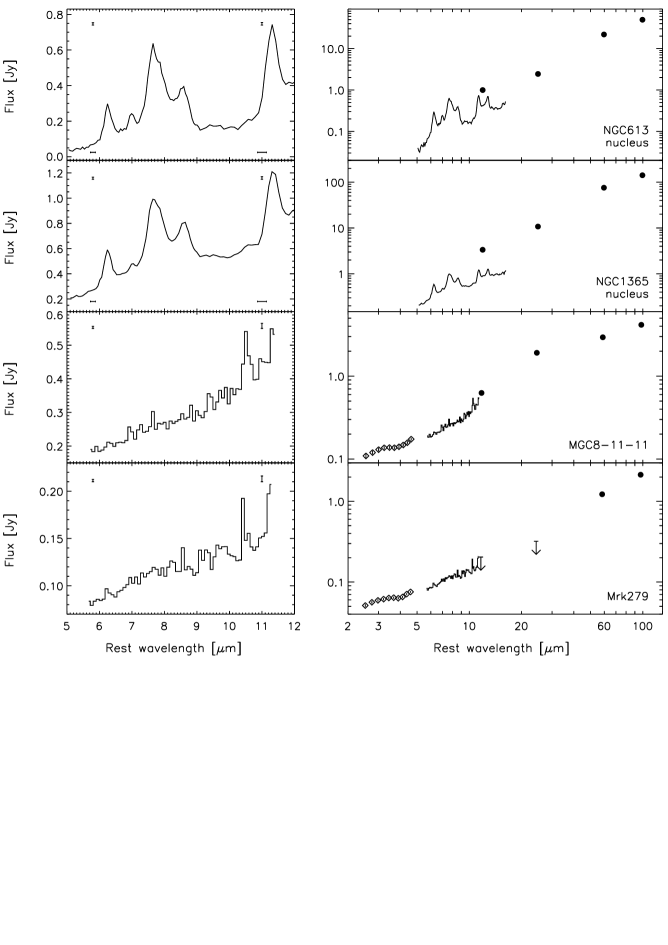
Class 4: These galaxies (Fig. 9) show a smooth featureless continuum in the 5–6 m range as well as definite signs of 9.7 m silicate absorption. The presence of silicate absorption is most easily determined by interpolating the 6 m ISO and the 12 m IRAS flux points (or in case of ISO-CAM-CVF, using the 13–15 m continuum instead).
-
•
Class 5: These galaxies (Fig. 10) show a smooth featureless continuum in the 5–6 m range without clear signs of 9.7 m silicate absorption. The absence of a clear silicate absorption feature is most easily determined by interpolating the 6 m ISO and the 12 m IRAS flux points (or in case of ISO-CAM-CVF, using the 13–15 m continuum instead).
-
•
Class 6: These galaxies (Fig. 2) clearly show 5.25 and 5.7 m PAH features, without clear signs of 9.7 m silicate absorption. The absence of a clear silicate absorption feature is most easily determined by interpolating the 6 m ISO and the 12 m IRAS flux points (or in case of ISO-CAM-CVF, using the 13–15 m continuum instead).
Table LABEL:iceless_stats lists the observed mid-IR features for the 13 out of 28 Class 4–6 galaxies displayed in this paper. It is hard to quantify consistently the limits on ice absorption in these three classes because of the presence of PAH features. For Class 4 and 5 we estimate 0.1–0.3. For Class 6, in all spectra the presence of weak 5.7 m and strong 6.2 m features may easily mask ice features as strong as =0.3. We note that among the Class 6 galaxies, both NGC 253 and M 82 do have a weak 3.0 m water ice feature (Sturm et al. Sturm (2000)), but the 6.0 m ice limit is =0.3 for both galaxies.
The total number of ISO galaxies classified into Classes 1–6 is small: just 46 out of 250 galaxies in our sample. The combination of both a good coverage of the 5.5–6.0 m range and a good S/N over 5.5–6.5 m proves to be a hard requirement to meet. With its superior sensitivity and better coverage of the 6 m region, SIRTF can be expected to refine our classification, find new members and provide a larger sample for statistical analyses.
5 Absorption and emission profile analysis
5.1 Model fits
The model described in Sect. 3 is now applied to the Class 1–3 sources presented in Sect. 4. The flat continuum of Sect. 3 is replaced by the 5–8 m continua derived individually for each source (thick grey lines in Figs. 5 – 8). For Class 2 and 3 sources, the continua were determined by interpolating the ISO-PHT-S short wavelength spectrum (2–5 m) linearly or logaritmically (depending on the SED shape) to the long wavelength IRAS data, ignoring the presence of PAH emission features. For Class 1 sources we followed another recipe. In the absence of contamination by PAH emission bands, we assumed the 8 m flux peak to represent the local 8 m continuum (see Sect. 6 for a discussion on the nature of the 8 m flux peak). For the three sources observed with ISO-CAM-CVF we then derived the 5–8 m continuum by interpolating to the observed 5 m flux. For NGC 4418 and I 15250+3609 we interpolated to the reddest 2–5 m ISO-PHT-S data point, assuming a continuum shape similar to that of I 00188–0856. Note that for all Class 1 sources we included a 6.85 m absorption feature due to hydrogenated amorphous carbon (HAC; Furton et al. Furton (1999)). A (strong) 6.85 m absorption feature is commonly observed towards Galactic lines of sight (Chiar et al. Chiar (2000); Keane et al. Keane (2001)).
Fig. 11 displays the model fits to all the sources, except for the three sources discussed below (Fig. 12). The grey histogram represents the model and in all cases the model spectra match very well the observed data. For two sources, Arp 220 and NGC 4945, the ISO-CAM-CVF spectra have also been included (thin line). Reading from left to right, of the first 5 panels in Fig. 11 a HAC absorption feature has been included for four of the sources. This profile matches very well the strong absorption feature seen near 6.85 m in these sources. In the case of I 00188–0856, absorption between 6.4 and 7.4 m is not consistent with the 6.85 m absorption profile and therefore only the 6.0 m H2O profile is modeled. We are not aware of any other valid or likely candidate that can give rise to the absorption observed in I 00188–0856. For the remainder of the sources, this feature has been omitted from the model. A qualitative comparison of the panels of Fig. 11, reveals that the observed features at 6.0 m and 6.2 m are successfully reproduced for all sources.
For three of our ice galaxies (Mrk 231, NGC 828, Mrk 334) proving the presence of 6.0 m ice absorption – the very key to membership of Classes 1–3 – turned out to be non-trivial. For each of these galaxies (see Fig. 12) the number of pixels in the blue wing is small, as is the depth of the ice feature. In all cases continua exist which do not require the presence of 6.0 m ice absorption. However, such continua, which are defined here as the superposition of hot dust plus PAH continua, must give a good fit in the 6–8 m range (i.e., any emission above or below the continuum level should be accounted for by known emission and absorption features) and the continuum should join smoothly to the long wavelength (12 m) data. In the case of Mrk 231, there is a preference for the fit requiring the presence of water ice (Fig. 12, left panel). This fit adopts a much more realistic continuum (cf. Fig. 6) and it provides a more realistic value for the 6.2 m/7.7 m PAH ratio than the fit not requiring the presence of water ice (Fig. 12, right panel). Moreover, the fit without water ice would result in a very broad 7.7 m PAH feature which does not resemble PAH features in Galactic sources. However, the total amount of ice absorption is difficult to quantify. A slightly lower but still permissible continuum can reduce the ice optical depth by a factor 2. For the other two galaxies (NGC 828, Mrk 334) the fits with and without water ice are equally viable.
5.2 Derived physical parameters
Table LABEL:optdepths summarizes the physical parameters of the detected features. The range in optical depths of the absorption band is large, extending from small depths of =0.13 (I 05189–2524) to very deep features with =1.3 (UGC 5101). The optical depths of the band were converted to column densities by dividing the peak optical depth by the intrinsic peak strength (4.2 molecules-1; Hagen et al. Hagen (1983)). The derived column densities are comparable to column densities determined for Galactic molecular clouds (Keane et al. Keane (2001)). All sources in Class 1, except for I 00188–0856, also show evidence for additional absorption features centred at 6.85 m, 7.3 m, 7.67 m. The 6.85 m feature resides in the long wavelength wing of the band, and hence the depth of this feature is more accurately determined by dividing out the continuum plus feature rather than just the continuum. For Class 1 galaxies, except for I 00183–7111, the depth of this feature is very strong and is greater than the corresponding optical depths. In Galactic dense molecular clouds, on the other hand, the water ice absorption is always the stronger of the two (Keane et al. Keane (2001)). The origin of the 6.85 m feature is unknown. The presence of a 7.3 m feature in some spectra suggests it is carried by HAC residing in the diffuse ISM, very much like the Galactic Centre (Chiar et al. Chiar (2000)). An absorption feature at 7.3 m is present in the spectra of I 15250+3609 and NGC 4418 (Spoon et al. Spoon01 (2001)). On the other hand, many Galactic young stellar objects show a strong 6.85 m feature due in part to an unidentified ice component (Keane et al. Keane (2001)). Observations of the 3 m region could distinguish between these two possibilities because HAC material presents a strong 3.4 m absorption feature which is absent in Galactic YSOs (Pendleton et al. Pendleton94 (1994); Pendleton & Chiar Pendleton97 (1997)). A 3.4 m absorption feature observed towards a few extra-galactic sources has been tentatively attributed to HAC (Wright et al. Wright (1996)). Finally, one source, NGC 4418, has an absorption feature at 7.67 m which has been attributed to methane ice (CH4; Spoon et al. Spoon01 (2001)).
Since the 6.2 m feature lies, in general, within the wing of the absorption band and hence slightly beneath the continuum, it is necessary to subtract a combination of the continuum plus from the observational data. After subtraction, the intensity (W cm-2) of the 6.2 m band is determined between 6.0 m and 6.55 m. The derived 6.2 m PAH intensities are listed in Table LABEL:optdepths. Note that for models in which the water ice is mixed with or in front of the PAH emitting region, the intrinsic 6.2 m PAH intensities would be greater.
An estimate of the 9.7 m silicate optical depth () for each of the sources is also given in Table LABEL:optdepths. In order to be able to compute this quantity the 9.7 m continuum was interpolated from the 5–8 m continuum and the long wavelength data (12 m). For some sources the peak absorption of the silicate feature is saturated and the true depth of the band is thus uncertain. In these cases fitting the wings of the feature can be attempted. Given the possibility of additional sources of emission along the line of sight, however, we prefer here to just state lower limits for . The column density of hydrogen is computed from the 9.7 m silicate depth by assuming a Galactic conversion factor:- NH = = ; (Roche & Aitken Roche (1984), Bohlin et al. Bohlin (1978)).
| Target | Galaxy | cz | Class | H2O ice | H2O ice | PAH | HAC | HAC | Silicates | N(H2O) |
|---|---|---|---|---|---|---|---|---|---|---|
| type | 3.0 m | 6.0 m | 6.25 m | 6.85 m | 7.3 m | 9.7 m | ||||
| km/s | 10 | 10 | ||||||||
| Mrk 334 | Sy2 | 6582 | 3 | 0.55 | 2.0 | 0.8 | 12.8 | |||
| NGC 23 | SB | 4566 | 3 | 0.94 | 5.6 | 1.0 | 22.0 | |||
| I 00183–7111 | Ulirg | 98032 | 1 | 0.20 | — | 0.3 | 1.9 | 4.6 | ||
| I 00188–0856 | Ulirg | 38550 | 1 | 0.55 | — | 1.5 | 12.8 | |||
| NGC 253 | SB | 245 | – | 0.25a | ||||||
| I 01173+1405 | SB | 9362 | 3 | 0.70 | 2.5 | 1.3 | 16.3 | |||
| NGC 828 | SB | 5374 | 3 | 0.78 | 11 | 0.8 | 18.1 | |||
| I 05189–2524 | Sy2 | 12760 | 2 | 0.13 | 1.1 | 0.15 | 3.0 | |||
| I 06035–7102 | Ulirg | 23823 | 3 | 0.70 | 0.9 | 1.5 | 16.3 | |||
| UGC 5101 | Ulirg | 12000 | 3 | 1.30 | 2.0 | 1.5 | 30.2 | |||
| M 82 | SB | 203 | – | 0.2a | ||||||
| NGC 4418b | Sy? | 2179 | 1 | 0.90 | — | 1.1 | 2.9 | 21.0 | ||
| Mrk 231 | Ulirg | 12660 | 2 | 0.14 | 1.5 | 0.65 | 3.3 | |||
| NGC 4945 | SB/Sy2 | 560 | 3 | 0.90c | 0.90 | 47 | 3.7 | 21.0 | ||
| Mrk 273 | Ulirg | 11132 | 3 | 0.60 | 1.5 | 1.2 | 14.3 | |||
| I 15250+3609 | Ulirg | 16000 | 1 | 1.20 | — | 1.3 | 3.3 | 28.0 | ||
| Arp 220 | Ulirg | 5450 | 2 | 0.74 | 2.3 | 2.4 | 17.2 | |||
| I 17208–0014 | Ulirg | 12900 | 3 | 1.14 | 3.3 | 2.0 | 26.5 | |||
| I 20551–4250 | Ulirg | 12788 | 2 | 0.70 | 1.4 | 1.8 | 16.3 | |||
| I 23128–5919 | Ulirg | 13371 | 3 | 1.30 | 2.5 | 0.7 | 30.2 | |||
| a Sturm et al. (Sturm (2000)) | ||||||||||
| b Spoon et al. (Spoon01 (2001)) | ||||||||||
| c Spoon et al. (Spoon00 (2000)) | ||||||||||
6 Discussion
Within our sample of 103 galaxies with good S/N and sufficient wavelength coverage shortward of 6.0 m, we have found water ice in up to 18 galaxies and upper limits of better than =0.1–0.3 for the absence of water ice absorption in another 28 galaxies. Although a small sample, it is of interest to correlate galaxy types with the mid-IR absorption/emission characteristics. The results of our analysis are presented in Table LABEL:ice_stats.
Table LABEL:ice_stats suggests that water ice might be a common species in ULIRGs, since 12 out of 19 do show ice. Seyferts, on the other hand, seem to be ice-poor, with ice detected in only 2 out of 62 galaxies. For starburst galaxies the numbers are less obvious, with 4 detections on a total of 21 galaxies.
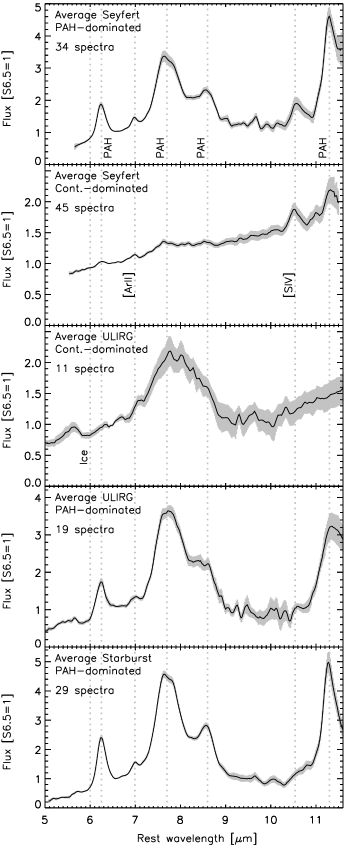
In order to investigate this issue further we have composed average spectra for the three main galaxy types listed in Table LABEL:ice_stats. Since the presence of 5–6 m PAHs in spectra complicates the detection of the 6.0 m water ice feature, we have decided to generate separate average spectra for continuum-dominated Seyferts and ULIRGs and for PAH-dominated Seyferts and ULIRGs. We classify a spectrum as continuum-dominated when the 6.2 m PAH line-to-continuum ratio is less than 0.15 and PAH-dominated when the ratio exceeds this value. The resulting five average spectra are shown in Fig. 13 and are based on 138 out of 250 galaxy spectra in our database. The galaxies included in the averaging process were selected on the basis of their noise after scaling by their individual 6.5 m flux.
The top panel of Fig. 13 shows the average PAH-dominated Seyfert galaxy, composed of 34 galaxy spectra. In addition to the well-known PAH emission features, the spectrum shows the 6.99 m Ar ii and 10.54 m S iv forbidden lines, the latter of which usually is strong in active galaxies. The spectrum bears no trace of 6.0 m water ice absorption. The second panel of Fig. 13 depicts the average continuum-dominated Seyfert, composed of 45 galaxy spectra. The spectrum is dominated by the S iv line, with traces of Ar ii, maybe of 7.65 m Ne vi and of weak PAH emission — the latter in accordance with our selection criterion of 6.2 m-PAH L/C0.15. The 9.7 m silicate absorption feature is strikingly absent, as is the 6.0 m water ice absorption feature. The third panel of Fig. 13 shows the average continuum-dominated ULIRG, composed of 11 galaxy spectra, among which are all Class 1 sources except for NGC 4418, as well as the Class 2 source Mrk 231. The spectrum is dominated by a broad flux peak centered at 8 m. A 6.0 m water ice feature can be easily recognized, starting at 5.6 m and reaching maximum depth at 5.9–6.0 m. The spectrum is noticeably different from the other continuum-dominated spectrum, the Seyfert spectrum, in the panel above. The fourth panel shows the average PAH-dominated ULIRG, composed of 19 galaxy spectra. Among the selected sources are several Class 2 and Class 3 sources. The spectrum shows strong resemblance to the average starburst galaxy (panel below; 29 spectra), with two exceptions: (1) the average PAH-dominated ULIRG shows a clear 6.0 m water ice feature, partially filled in by 6.2 m PAH emission, the average starburst galaxy does not; and (2) the average starburst spectrum shows a hint of 5–6 m PAH features (Fig. 2), where the average PAH-dominated ULIRG as well as the other three average spectra do not. The presence of the 5–6 m spectral structure near 6.0 m forces a higher upper limit to the amount of ice in the average starburst spectrum than in the two average Seyfert spectra.
The average spectra largely confirm our initial findings: ULIRGs have on average more ice than Seyfert and starburst galaxies. The absence of contaminating PAH emission in the continuum-dominated Seyfert spectrum implies a tighter upper limit for the presence of water ice absorption than in the PAH-dominated Seyfert and starburst spectra.
Also of interest is the presence of a broad flux peak centered at 8 m in the continuum-dominated ULIRG (Fig. 13, middle panel). In the absence of strong 6.2 m PAH emission (L/C0.15), the 8 m flux peak cannot be attributed to strong and exceptionally broad PAH emission. We will come back to this issue later this Section.
| Gal. type | PHT-S | CAM-CVF | total |
|---|---|---|---|
| Seyfert | 2/55 | 0/7 | 2/62 |
| ULIRG | 9/12 | 3/7 | 12/19 |
| Starburst | 3/12 | 1/9 | 4/21 |
| Other | 0/1 | 0/0 | 0/1 |
The galaxies in our sample have turbulent and hostile environments (i.e., the diffuse interstellar medium or the immediate surroundings of the central starburst or AGN) which significantly process and often destroy the molecular material that reside in or close to these regions. However, within our ice-galaxy sample, volatile material (which is easily destroyed) is clearly present. This suggests that some shielding from harsh environments must occur. In the diffuse medium supernova shock waves are the predominant destruction mechanism for interstellar dust (Jones et al. Jones (1994)). Refractory grains and most likely PAHs are typically destroyed within 108 yr, whereas ice grains of 1000 can only survive for 106 yr. These lifetimes increase significantly in dense clouds where the molecules are protected from processes such as sputtering by shocks. On the other hand, molecular material in an AGN torus (or in nearby dusty clouds) is exposed to the intense hard X-rays originating from the central engine. Due to their extreme energies, hard X-ray photons are able to penetrate column densities of 10 (e.g. NGC 4945: Iwasawa et al. Iwasawa (1993)). Hence, under such conditions, ice mantles on the dust grains would be unable to survive. PAHs, on the other hand, might be able to survive for lifetimes of 104 yr if the column density is greater than 1023cm-2 (Voit Voit (1992)) and hence it is more likely to see PAHs as opposed to ices in such environments. Nevertheless, the harsh conditions in AGN toroids may well influence the composition of the emitting PAH family. Further modelling and laboratory experiments are required to determine to what extent PAHs and ices are processed by the hard radiation present in AGNs.
ULIRGs are merger systems in which the tidal forces have allowed molecular material from the galaxy disks to accumulate in the nuclei of the system (e.g. Solomon et al. Solomon (1997); Downes & Solomon Downes (1998); Sakamoto et al. Sakamoto (1999); Tacconi et al. Tacconi (1999)). The presence of water ice in ULIRGs thus comes as no surprise. In the many dense shielded cloud cores, that are likely to be present, water ice can survive until these clouds are dispersed by starformation. Clearly, the “icy” ULIRGs still have ample cold dense molecular material to continue star formation for some time. In Galactic dense molecular clouds the 6.0 m water ice absorption feature is seen against the mid-IR continuum of deeply embedded protostars, like W 33A and NGC 7538 IRS9. In external galaxies, the background continuum source might also be provided by hot dust associated with the AGN torus or with starburst activity. The similarity of the average ULIRG spectrum (Fig. 1 of Lutz et al. Lutz98 (1998)) to Class 3 spectra with strong PAHs, suggest that ice absorption in ULIRGs is preferentially linked to a scaled up star formation process. The lower luminosity example of NGC 4418 cautions, however, that this link cannot be generalized to all individual objects: ice absorption may also be seen against AGN.
Little can be derived from our data on the ice absorption properties of lower luminosity starbursts. The very strong PAH emission features prevent the detection of moderately strong 6.0 m features. In fact, given the lower obscuration of starbursts compared to ULIRGs or to Galactic protostars, weaker ice features in starbursts are expected for similar properties of the obscuring matter. The examples of M 82 and NGC 253 (Sturm et al. Sturm (2000)) suggest that the 3 m region may be better suited to quantify such weaker ice absorptions, with the caveat for ground-based observations of the 3 m region being a difficult atmospheric window. Ice is seen in these starbusts at 3 m but not detectable in the heavily structured 6 m spectrum.
The conditions for the existence of water ice near Seyfert nuclei seem to be generally poor. If most of the obscuration occurs in a dense torus that is surrounding the nuclear region and heated by the X-rays from the central engine, ices are unlikely to survive. Indeed, 3 m spectra of AGN (Bridger et al. Bridger (1994); Wright et al. Wright (1996); Imanishi Imanishi00 (2000); Sturm et al. Sturm (2000)) tend to show 3.4 m hydrocarbon absorptions but no ices.
The low number of Seyfert and starburst ice-galaxies, as inferred from the mid-IR spectra, might indicate that dense shielded molecular cloud cores are far less abundant in these systems than in ULIRGs. Likely, most of the absorption in Seyferts originates in the dense toroid surrounding the nuclear region, which is thoroughly energetically or thermally processed by the X-rays of the internal monster and therefore contains no ices.
| Target | Galaxy | cz | 5 m | 9.7 m |
| type | PAH | silicate | ||
| km/s | emission | absorption | ||
| NGC 253 | SB | 245 | ++ | ? |
| NGC 520 | SB | 2281 | ++ | + |
| NGC 613 | SB | 1475 | – | ? |
| NGC 1068 | Sy2 | 1148 | – | + |
| NGC 1365 | Sy1.8 | 1636 | ? | ? |
| I 04385–0828 | Sy2 | 4527 | ++ | |
| NGC 1808 | Sy2 | 1000 | ++ | ? |
| MGC 8–11–11 | Sy1.5 | 6141 | – | |
| M 82 | SB | 203 | ++ | ? |
| M 83 | SB | 516 | ++ | ? |
| Mrk 279 | Sy1.5 | 8814 | – | |
| Circinus | Sy2 | 439 | ? | ++ |
| PKS 2048–57 | Sy2 | 3402 | + | |
| ++ = strongly present | ||||
| + = present | ||||
| ? = maybe present | ||||
| – = absent | ||||
As a corollary and as illustrated by Fig. 9 the presence of silicates does not automatically imply the presence of water ice. If the environment is not sufficiently shielded or is too warm, water ice cannot exist. For the five galaxies displayed (one starburst galaxy and four Seyferts) this might be the case.
Conversely, does water ice correlate with the presence of shielding dust (e.g., silicates) ? Except for I 05189–2524, all our ice-galaxies show a strong 9.7 m silicate absorption feature (see Table LABEL:optdepths), with 1.5 for most sources. The ratio / spans a range of 0.10 for I 00183–7111 to 1.8 for I 23128–5919, with a mean value of 0.67 for the galaxies with a non-saturated silicate feature. In contrast, all five Class 1 galaxies have /0.37. This suggests that silicate and water ice optical depths are not correlated on the galaxy-wide scale that we probe with our ISO observations. We note that low mass protostars in individual clouds (e.g. Taurus) do show a good correlation between ice optical depth and the strength of the silicate feature (Whittet et al. Whittet83 (1983), Whittet88 (1988)). However, for massive luminous protostars in different clouds, no such correlation exists, largely due to the extensive thermal processing of the environment by the newly formed star (cf. Tielens & Whittet Tielens (1997)). Obviously, the abundance of water ice is controlled by special conditions, which in our sample are apparently only met in some of the regions within our Class 1 ice galaxies.
Though originally published as a unique source, it is apparent from our study that some characteristics of NGC 4418 are seen in a larger number of galaxies. Mid-IR absorptions of water ice are detected in about one sixth of the galaxies for which ISO spectra of adequate S/N are available, and perhaps the majority of ULIRGs. These detections range from spectra dominated by an absorbed continuum (Class 1) over spectra mainly showing absorption signatures but also clear PAH emission (Class 2) to spectra that resemble normal PAH emission spectra subjected to additional dust and ice obscuration (Class 3).
Short of full spectral modelling, empirical criteria help to assess the relative importance of emission and absorption in shaping these spectra. First and most important is the distinction between a 6.2 m PAH emission and the 6.5–6.7 m pseudo maximum in an absorption dominated spectrum (Spoon et al. Spoon01 (2001)). Second, there are differences in the shape of the maximum in the 8 m region. PAH dominated spectra exhibit relatively narrow 7.7 and 8.6 m emissions (e.g. Helou et al. Helou (2000), Rigopoulou et al. Rigopoulou (1999)). Also, they show a very steep rise between 7.2 and 7.7 m. Obscuration of such a spectrum (assumed to be intrinsically unchanged) affects mainly the relative strengths of such features but keeps the 7.7 m peak narrow (0.6m FHWM, e.g. Fig. 3; Fig. 6 of Rigopoulou et al. Rigopoulou (1999)) and its ascent steep. In contrast, absorption dominated spectra tend to show a wider, less well defined peak around 8 m (e.g. Fig. 14), with significant variation depending on continuum shape and optical depth of the various features.
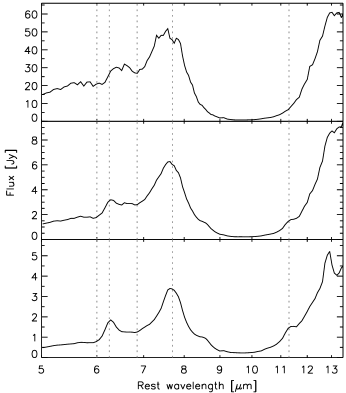
The change from an absorbed continuum to an absorbed PAH spectrum is illustrated further in spectra of three adjacent positions in the Galactic star forming complex W 3 (Fig. 15 , D. Cesarsky, priv. comm.). The top panel towards the infrared source is dominated by a continuum absorbed by ice, HAC, and silicates with a broadish 8 m bump. The middle panel is an intermediate case and the bottom shows an obscured PAH spectrum. These spectra illustrate that the qualitative features discussed above and outlined in the schematic views of Fig. 3 and Fig. 14 can indeed originate from radiation transfer through a dense and dusty medium, and that star formation in our own galaxy can reproduce the full range of phenomena.
Differences in the shape of the 8 m maximum may help in understanding the vast majority of sources that are not pure absorbed continua. Is the frequently observed weakness of the 6.2 m feature (compared to the 7.7/8 m maximum) due to obscuration of a PAH-dominated spectrum or due to superposition of a little obscured PAH spectrum and a strongly obscured continuum? The intrinsic 6.2/7.7 PAH ratio is quite stable for many Galactic sources (Peeters et al. Peeters (2002)) as well as the ISM in normal and starburst galaxies (Helou et al. Helou (2000); Rigopoulou et al. Rigopoulou (1999), our Fig. 2). Lutz et al. (Lutz98 (1998)) and Rigopoulou et al. (Rigopoulou (1999)) argued in favour of obscuration as cause of the 6.2 weakness, using an observed correlation between 6.2/7.7 feature ratio and extinction to the starburst region, as measured from independent mid-IR emission line data (Genzel et al. Genzel (1998)). On the other hand, suggestions have been made of an effectively unobscured ’surface layer’ producing most of the PAH emission, CII line emission, and submm continuum of ULIRGs (e.g. Fischer et al. Fischer (2001), Haas et al. Haas (2001)). Such an approach tackles problems like the observed C ii deficit of ULIRGs at the expense of breaking the link between PAHs and the star formation observed in the mid-infrared fine structure lines, and of introducing an unknown fully obscured component.
Water feature optical depths of 1 (Table LABEL:optdepths) are sufficient to modify the ratio of the 6.2 and 7.7 m PAH features by a factor 2. While this is enough to explain the weakness of the 6.2 m feature in many objects by obscuration, both the uncertainty in the optical depth values and the lack of knowledge to which extent the ice features apply to the PAHs and/or an underlying continuum make conclusions for individual objects very difficult. Here, use of the shape of the feature near 7.7/8 m can help with breaking the degeneracy. As long as the intrinsic shapes of the PAH features are assumed to remain constant, a wider than usual peak near 8 m argues for a considerable contribution of a heavily absorbed continuum. Our Class 1 and 2 spectra (Fig. 5 and 6) suggest that this is the case for a number of galaxies. In a future paper (Spoon et al. in prep.) we will derive quantitative fits to the high quality Class 2 spectrum of Arp 220, arguing for a best fit with a considerable contribution by an absorbed continuum. The existence of Class 1 and Class 2 sources implies that estimates of the PAH contribution on the basis of a line-to-continuum ratio (Genzel et al. Genzel (1998)) or of fits with extinction laws that do not include ices (Tran et al. Tran (2001)) will overestimate the importance of PAHs, more noticeably for the simple line-to-continuum ratio. This effect is highly relevant for some of the Class 1 and 2 spectra, but less so for Class 3 or the ULIRGs in general. High S/N spectra, extended wavelength coverage, and fits of the entire wavelength range with PAHs and continua obscured by dust and ices are needed for quantitative progress.
The issue of broad 8 m features is complicated further by the presence of yet another category of ”8 m maxima” in addition to PAHs and absorbed spectra: Several luminous AGN-like ULIRGs (Tran et al. Tran (2001); Taniguchi et al. Taniguchi (1997)) show broad 8 m maxima on top of a smooth mid-infrared continuum, with PAH absent or very weak. Clear examples for this include I 09104+4109, I 00275–2859, I 22192–3211, and I 23529–2119. The key difference to our Class 1 and Class 2 spectra with broad 8 m maxima is that these objects do not show the very deep silicate feature of the absorbed Class 1 and 2 spectra. Tran et al. (Tran (2001)) discussed these features in terms of self-absorbed silicate emission or a modified PAH origin, without definite conclusion. Recent surveys of galactic PAHs (Peeters et al. Peeters (2002); Verstraete et al. Verstraete (2001)) fail to observe similar profiles even under unusual conditions. The nature of these features remains uncertain.
It is interesting to speculate in analogy to Galactic sources that our classification might reflect an evolutionary sequence. If an evolved starburst is represented by a a PAH spectrum, while strong mid-infrared continua are typical for the -region continuum of intense compact starbursts (Laurent et al. Laurent (2000)) or AGN, then Class 1 may trace the deeply embedded beginnings of star formation (or AGN activity), while the latter classes reflect more advanced and less enshrouded stages.
Finally, a point of caution. Since the 3.0 m water ice absorption extends over a difficult part of the L band, its definition is not easy in ground based spectra like those of Imanishi et al. (Imanishi01 (2001)). Its short end is outside the L band and its long end coincides with the 3.3 m PAH emission and 3.4 m hydrocarbon absorption. A gradually increasing continuum from 3.15 to 4.0 m is however visible in their spectrum of UGC 5101. Depending on the location along the line of sight, the water ice absorption will strongly affect measured quantities like the 3.3 m continuum, the 3.3 m PAH flux, its equivalent width and the 3.3 m-PAH-to-far-IR flux ratio. Hence, in galaxies with water ice absorption (like UGC 5101, =1.3), both uncorrected 3.3 m and 6.2 m PAH fluxes will provide underestimates when used as star formation indicators. For the 3.3 m PAH, aperture losses of present instruments are an additional reason for underestimates as in the case of UGC 5101 where the north-south oriented 1.2 slit of Imanishi et al. (Imanishi01 (2001)) is perpendicular to the orientation of the 2 star forming region (Genzel et al. Genzel (1998)).
7 Conclusions
Following the discovery of water ice in NGC 4418 (Spoon et al. Spoon01 (2001)), we have searched our sample of ISO galaxy spectra for galaxies showing similar signs of 6.0 m water ice absorption. We have found in total 18 galaxies, which we grouped into three classes. The classification is based on the presence of ice absorption, 6.2 m PAH emission, and the nature of the 7.7–8 m feature: PAH emission or absorbed mid-IR continuum, or a combination of the two. We also looked for galaxies showing no signs of water ice absorption. This sample contains 28 galaxies with water ice upper limits ranging from =0.1–0.3, depending on the S/N and the complexity of the 5–7 m spectrum. We classified these galaxies in another three classes (Class 4–6), depending on the presence of 9.7 m silicate absorption and 5–6 m PAH emission.
We have modeled the complicated interplay of 6.0 m water ice absorption and 6.2 m PAH emission, which in ISO-PHT-S spectra takes place at the blue end of the PHT-SL range and, hence, only can be recognized in galaxies with a redshift in excess of 3000 km/s. For spectra obtained with the ISO-CAM-CVF instrument no such limitations apply. Our modeling supports the presence of ice in the Class 1–3 sources, except in a few cases where ice is not strictly required to obtain an acceptable fit to the observed spectrum.
Based on a subsample of 103 good S/N ISO galaxy spectra with sufficient wavelength coverage blueward of 6 m, a substantial fraction of ULIRGs (12 out of 19) contain detectable amounts of water ice. On the other hand, the majority of Seyfert (2 out of 62) and starbursts galaxies (4 out of 21) probably do not. These results are confirmed by the spectral structure seen in our average spectra of Seyfert, ULIRG and starburst galaxies: water ice absorption is only obvious in the average ULIRG.
Class 1 & 2 ice galaxies are dominated by a broad feature near 8 m which indicates a strong contribution by a dust and ice-absorbed continuum, similar to that seen in NGC 4418. These observation stress the need for high S/N data and refined diagnostic methods, to properly discriminate spectra dominated by PAH emission and spectra dominated by heavy obscuration.
The interplay of the broad 8 m feature and PAH emission, as seen in our ice galaxies, shows strong similarities with features seen in Galactic star forming clouds. This leads us to believe that our classification of ice galaxy spectra in three classes might reflect an evolutionary sequence from strongly obscured beginnings of star formation (and AGN activity) to a less enshrouded stage of advanced star formation (and AGN activity), as the PAHs get stronger and the broad 8 m feature weakens.
Acknowledgements.
The authors wish to thank Diego Cesarsky, Els Peeters and Eckhard Sturm for discussions. This research has made use of the NASA/IPAC Extragalactic Database (NED) which is operated by the Jet Propulsion Laboratory, California Institute of Technology, under contract with the National Aeronautics and Space Administration.References
- (1) Allamandola L.J., Bregman J.D., Sandford S.A., et al., 1989, ApJ 345, L59
- (2) Bohlin R.C., Savage B.D. & Drake J.F., 1978, ApJ 224, 132
- (3) Bridger A., Wright G.S. & Geballe T.R., 1994, in Infrared Astronomy with Arrays, I. McLean (ed.), Kluwer-Dordrecht, 537
- (4) Cesarsky C.J., Abergel A., Agnèse P., et al., 1996, A&A 315, L32
- (5) Chiar J.E., Tielens A.G.G.M., Whittet D.C.B., et al., 2000, ApJ 537, 749
- (6) Clavel J., Schulz B., Altieri B., et al., 2000, A&A 357, 839
- (7) Dartois E. & d’Hendecourt L., 2001, A&A 365, 144
- (8) De Graauw Th., Haser L.N., Beintema D.A., et al., 1996, A&A 315, L49
- (9) Downes D. & Solomon P.M., 1998, ApJ 507, 615
- (10) Draine B.T., 1989, in Infrared Spectroscopy in Astronomy, B.H. Kaldeich (ed.), ESA-SP 290, 93
- (11) Fischer J., 2001, in The promise of the Herschel Space Observatory, ESA-SP460, G.L. Pilbratt, J. Cernicharo, A.M. Heras, T. Prusti, R. Harris (eds.), ESA-SP460, 131
- (12) Furton D.G., Laiho J.W. & Witt A.N., 1999, ApJ 526, 752
- (13) Genzel R., Lutz D., Sturm E., et al., 1998, ApJ 498, 579
- (14) Haas M., Klaas U., Müller S.A.H., Chini R. & Coulson I., 2001, A&A 367, L9
- (15) Hagen W., Tielens A.G.G.M. & Greenberg J.M., 1983, A&AS 51, 389
- (16) Helou G., Lu N.Y., Werner M.W., Malhotra S., et al., 2000, ApJ 532, L21
- (17) Hudgins D.M., Sandford S.A., Allamandola L.J. & Tielens A.G.G.M., 1993, ApJS 86, 713
- (18) Imanishi M., 2000, MNRAS 319, 331
- (19) Imanishi M., Dudley C.C. & Maloney P.R., 2001, ApJ 558, L93
- (20) Iwasawa K., Koyama K., Awaki H., et al., 1993, ApJ 409, 155
- (21) Jones A., Tielens A.G.G.M., Hollenbach D.J. & McKee C.F., 1994, ApJ 433, 797
- (22) Keane J.V., Tielens A.G.G.M., Boogert A.C.A., et al., 2001, A&A in press
- (23) Kessler M.F., Steinz J.A., Anderegg M.E., et al., 1996, A&A 315, L27
- (24) Laurent O., Mirabel I.F., Charmandaris V., et al., 2000, A&A 359, 887
- (25) Lemke D., Klaas U., Abolins J., et al., 1996, A&A 315, L64
- (26) Lutz D., Spoon H.W.W., Rigopoulou D., et al., 1998, ApJ 505, L103
- (27) Lutz D., 1999, In: The Universe as seen by ISO, P. Cox, M.F. Kessler (eds.), ESA-SP 427, 623
- (28) Maldoni M.M., Smith R.G., Robinson G. & Rookyard V.L., 1998, MNRAS 298, 251
- (29) Moorwood A.F.M., Lutz D., Oliva E., et al., 1996, A&A 315, L109
- (30) Moutou C., Sellgren K., Léger A., et al., 1998, in Star Formation with the Infrared Space Observatory, J.L. Yun, R. Liseau (eds.), ASP Conf. Series 132, 47
- (31) Peeters E., Hony S., Van Kerckhoven C., et al., 2002, A&A accepted
- (32) Pendleton Y.J., Sandford S.A., Allamandola L.J. & Tielens A.G.G.M., 1994, ApJ 437, 683
- (33) Pendleton Y.J. & Chiar J.E., 1997, in The Nature and Evolution of Interstellar Organics From Stardust to Planetesimals., Y.J. Pendleton & A.G.G.M. Tielens (eds.), ASP Conf. Ser. 122, 179
- (34) Rigopoulou D., Spoon H.W.W., Genzel R., et al., 1999, AJ 118, 2625
- (35) Roche P.F. & Aitken D.K., 1984, MNRAS 208, 481
- (36) Sakamoto K., Scoville N.Z., Yun M.S., Crosas M., et al., 1999, ApJ 514, 68
- (37) Solomon P.M., Downes D., Radford S.J.E. & Barrett J.W., 1997, ApJ 478, 144
- (38) Spoon H.W.W., Koornneef J., Moorwood A.F.M., et al., 2000, A&A 357, 898
- (39) Spoon H.W.W., Keane J.V., Tielens A.G.G.M., Lutz D. & Moorwood A.F.M., 2001, A&A 365, L353
- (40) Sturm E., Lutz D., Tran D., et al., 2000, A&A 358, 481
- (41) Tacconi L.J., Genzel R., Tecza M., Gallimore J.F., Downes D., Scoville N.Z., 1999, ApJ 524, 732
- (42) Taniguchi Y., Sato Y., Kawara K., et al., 1997, A&A 318, L1
- (43) Tielens A.G.G.M. & Whittet D.C.B., 1997, in Molecules in Astrophysics: Probes and Processes, E.F. van Dishoeck (ed.), Kluwer-Dordrecht, 45
- (44) Tran Q.D., Lutz D., Genzel R., et al., 2001, ApJ 552, 527
- (45) Verstraete L., Pech C., Moutou C. et al., 2001, A&A 372, 981
- (46) Voit G.M., 1992, MNRAS 258, 841
- (47) Whittet D.C.B., Bode M.F., Baines D.W.T., et al., 1983, Nature 303, 218
- (48) Whittet D.C.B., Bode M.F., Longmore A.J., et al., 1988, MNRAS 233, 321
- (49) Whittet D.C.B., Schutte W.A., Tielens A.G.G.M., et al., 1996, A&A 315, L357
- (50) Wright G.S., Bridger A., Geballe T.R. & Pendelton Y.J., 1996, in Cold Dust and Galaxy Morphology, D.L. Block, J.M. Greenberg (eds.), 143, Kluwer-Dordrecht