The XMM-Newton Bright Serendipitous Source Sample (XMM-Newton BSS)
Abstract
The XMM-Newton Survey Science Center is constructing a large ( 1000 sources) and complete sample of bright serendipitous XMM-Newton sources at high galactic latitude, so as to allow both the discovery of sources of high individual interest as well as statistical population studies. The sample, known as “The XMM-Newton Bright Serendipitous Source Sample” (XMM-Newton BSS), has a flux limit of erg cm-2 s-1 in the 0.5–4.5 keV energy band and will be fundamental in complementing other medium and deep survey programs (having fluxes 10 to 100 times fainter) in order to: a) characterize the X-ray sky and its constituents, b) understand the evolution of the population selected and c) define statistical identification procedures to select rare and interesting populations of X-ray sources (e.g. high z clusters of galaxies, BL Lacs, type 2 QSOs, etc..). We discuss here the scientific rationale and the details of the project and we present some preliminary results.
keywords:
Missions: XMM-Newton – X-rays: general – Galaxies: Active1 Introduction and Scientific Rationale
X-ray selection provides a well-proven and efficient mean of finding some of the astrophysically most interesting and energetic objects in the Universe, like Active Galactic Nuclei (AGN) and clusters of galaxies.
The XMM-Newton Survey Science Center (SSC) 111 The XMM-Newton SSC is an international collaboration involving a consortium of several institutions. The XMM-Newton SSC was appointed by ESA to exploit the XMM-Newton serendipitous detections for the benefit of the international scientific community ([\astronciteWatson et al.2001]). See http://xmmssc-www.star.le.ac.uk for a full description of the program and the Barcons et al., contribution at this meeting for an updated status of the XMM-Newton XID program. is assembling a large (about 1000 sources) sample of bright serendipitous XMM-Newton sources at high galactic latitude (), following well defined criteria (completeness, representativeness, etc..) so as to allow both a detailed study of sources of high individual interest as well as statistical population studies.
The sample, known as “The XMM-Newton Bright Serendipitous Source Sample” (XMM-Newton BSS), is designed to have a flux limit of erg cm-2 s-1 in the 0.5–4.5 keV energy band. The major scientific goals of this project are to study the mix of different kinds of AGN, and the cosmological evolution of clusters of galaxies.
AGN are expected to be the most numerous class of X-ray sources. The majority of the XMM-Newton BSS sources will have enough statistics (hundreds of counts) to allow X-ray spectral investigations (see e.g. [\astronciteDella Ceca et al.2000] for the discovery of a Type 2 AGN from X-ray data only). Such X-ray spectral information is fundamental to determine, source-by-source, the amount of metal absorption, the spectral shape, and the presence of reprocessed features (e.g. FeK line). Moreover, at the X-ray limiting flux of the XMM-Newton BSS sample the optical counterparts of the X-ray sources have magnitudes bright enough to allow relatively high-quality optical and near-infrared spectroscopy even with a 4 meter class telescope. X-ray data, combined with optical and near-infrared spectroscopic information, will allow us to investigate the poorly understood relationships (e.g., [\astronciteMaiolino et al.2001]) between narrow- and broad-line AGN in the optical regime, and absorbed and unabsorbed AGN in the X-ray regime. The completeness of our sample should place our investigations on firm and solid statistical ground. The large area covered by the XMM BSS will allow us also to investigate in detail rare source population (e.g. the long sought type 2 QSOs).
Another crucial issue for cosmology is the evolution of the XLF of clusters of galaxies. Early claims of a negative evolution with redshift are still being tested and refined. For example, the ROSAT results from the RDCS survey (e.g. [\astronciteRosati et al.1998]; [\astronciteBorgani et al.2001]) show that the negative evolution, if any, is mostly concentrated on the high luminosity ( erg s-1) part of the XLF. About 120 (in case of negative evolution) and 160 (in case of no evolution) clusters are expected in the XMM-Newton BSS. The largest discrepancy is on the predicted number of high-luminosity ( erg s-1) systems: 45 are expected in the no evolution case while 15 are expected in the negative evolution case. These numbers, although indicative, illustrate the power of the XMM-Newton BSS as a tool to solve a long-standing problem of the modern physical cosmology. Medium and deep surveys, covering a smaller area of the sky, will sample more efficiently the low luminosity part of the XLF which is already well sampled by the RDCS and for which no strong evidence of cosmological evolution is found (e.g. [\astronciteRosati et al.1998]). We stress here that the search for rare high-luminosity clusters is best done in shallow surveys covering a large area, such as the XMM-Newton BSS.
When combined with the results from other XMM-Newton medium and deep survey programs (in the same energy band, e.g. AXIS, [\astronciteBarcons et al.2002]; or in different energy selection bands, e.g. HELLAS2XMM - [\astronciteBaldi et al.2002]; [\astronciteHasinger et al.2001]) the XMM-Newton BSS will extend the baseline for all evolutionary studies (as e.g. the AGN and cluster of galaxies luminosity function) as well as it will allow us to investigate selection effects in the source population due to the used energy selection band. The importance of a large baseline in luminosity and redshift has been already shown by [\astronciteMiyaji et al.(2000)] who have combined several surveys of different depth and solid angle carried out with ROSAT to investigate in deeper detail than previously possible the cosmological properties of the AGN population.
An important part of our work with the XMM-Newton BSS will be to define statistical identification procedures to select rare and interesting populations of X-ray sources, enabling the application of these procedures to the vast amount of XMM-Newton serendipitous data that will be accumulated during the lifetime of the mission.
This paper is organized as follows. In section 2 we describe the strategy used to define the source sample. Preliminary results from this project are presented in Section 3, while the summary and conclusions are reported in Section 4.
2 Survey Strategy
The bright catalogue is designed to contain about 1000 sources with an X-ray flux limit in the 0.5–4.5 keV energy band of 10-13 erg s-1 cm-2. The size of the sample is dictated by the need to reveal and to characterize statistical properties also for minority populations (e.g. high-z clusters of galaxies, BL Lacs objects etc..).
2.1 Why the 0.5-4.5 keV energy band ?
The choice of the 0.5–4.5 keV energy band is motivated by the desire to avoid the very soft photons (minimizing non-uniformities introduced by the different values of Galactic absorbing column densities along the line of sight) and by the need of compromising between a broad passband (to favour throughput) and a narrow passband (to minimize non-uniformities in the selection function due to different source spectra). Furthermore in the 0.5–4.5 keV band XMM-Newton has the highest throughput.
2.2 Which primary selection camera?
We have decided to use only data from the EPIC MOS2 detector to define the source sample. The main reasons for this choice are:
-
1.
unlike the EPIC pn, the EPIC MOS detectors have a circular symmetry that simplifies the analysis of the field. For example, in the case of the EPIC MOS detectors the source target is, in the large majority of the observations, in the central chip;
-
2.
the PSF in the 2 EPIC MOSs is narrower than the PSF in the EPIC pn. In particular, the EPIC MOS2 has the narrowest PSF (FWHM4.4′′ and HEW13.0′′ at 1.5 keV, see [\astronciteEhle et al.2001]). As a comparison, the EPIC pn PSF has FWHM6.6′′ and HEW15.2′′;
-
3.
the dead spaces between the EPIC MOS chips are narrower than the gaps in the EPIC pn detector, simplifying source detection and analysis and maximizing the search area;
-
4.
unlike with the EPIC pn camera, we can use the EPIC MOS2 observations in large- and small-window mode excluding the area occupied by the central chip. Since 30% of the observations have been performed in window mode, retaining these observations will maximize the searched area, speeding up the creation and definition of the source sample.
The major disadvantage of the EPIC MOS2 camera when compared to the EPIC pn camera is the reduced sensitivity. The effective area of EPIC MOS is smaller than that of EPIC pn, and this is particularly true at high (E5 keV) and low (E1.5 keV) energies (note that for the selection band adopted, 0.5–4.5 keV, only the reduced effective area at E1.5 keV is important). However, since the sample contains relatively bright sources, and considering a minimum exposure time of 5000 s (see below) this lower efficiency does not affect the source selection. Obviously, once the source is detected and included in the sample, additional information using data from the EPIC MOS1 and pn detectors can be collected in order to increase the statistics for the X-ray spectra and morphology analysis.
2.3 Criteria for field selection
Not all the available EPIC MOS2 pointings are adequate for producing the bright source catalogue. We have defined a set of selection criteria in order to avoid problematic regions of the sky, to maximize the availability of ancillary information at other frequencies (i.e. optical and radio) and to speed up the optical identification process. The fields will be thus selected on the basis of the following criteria:
-
1.
availability to SSC (XMM-Newton fields with PI granted permission 222This restriction of course only applies during the proprietary period of the XMM-Newton observations. plus XMM-Newton public fields);
-
2.
high Galactic latitude (20∘) to avoid crowded fields, to obtain a relatively “clean” extragalactic sample and to have magnitude information for the optical counterparts from the Digital Sky Survey (DSS) material (the Automated POSS Machine - APM - catalogue is almost complete for 20∘);
-
3.
galactic absorbing column density along the line of sight less than 1021 cm-2, to minimize non-uniformities introduced by large values of the Galactic ;
-
4.
exclusion of fields centered on bright and/or extended X-ray targets and/or containing very bright stars. In the first case the effective area of sky covered and the actual flux limit are difficult to estimate correctly, making the derivation of the sky-coverage more uncertain; in the latter case the search for the optical counterpart of the X-ray sources could be very difficult or even impossible due to the presence of the bright star;
-
5.
good time interval (GTI) exposure 5ks. With this constraint all the sources with a count rate (0.5 - 4.5) keV 0.01 cts/s will be detectable across the whole field of view considered ensuring a flat sensitivity;
-
6.
finally, we have also excluded EPIC MOS2 pointings suffering from a high background rate (i.e. accumulated during particle background flares).
Note that we have also considered the EPIC MOS2 observations in large- and small-window mode satisfying the criteria discussed above; in these cases we exclude the central chip from the investigated area but use the area covered from the other six CCDs.
2.4 Source detection
The EPIC MOS2 observations appropriate for this project have been processed through the pipeline processing system, using tasks from the XMM-Newton Science Analysis Software. Full details about the pipeline processing system, the pipeline products as well as the source searching procedures, flux measurements, etc.. can be found in [\astronciteWatson et al.2001] and http://xmmssc-www.star.le.ac.uk.
2.5 Criteria for source selection
Having decided the field-selection criteria, we define here the criteria for the source selection within each EPIC MOS2 field:
-
1.
0.5–4.5 keV count-rate 0.01 cts/s. This count-rate, already corrected for vignetting and PSF corresponds, for a source with a power-law spectrum with energy index =0.9 (see Section 3.3), to a flux (0.5 - 4.5 keV) of 10-14 erg s-1 cm-2;
-
2.
sources with a distance from the EPIC MOS2 center between an inner radius () and an outer radius (). depends on a) the actual size and brightness of the target and b) on the window mode. ranges between 0 (e.g. survey fields with no “target”) and 8 arcmin (bright/extended X-ray sources and/or large- and small-window mode). In this way the area of the detector “obscured” by the presence of the target and/or not exposed is excluded from the analysis. is, for the large majority of the fields, equal to 13 arcmin;
-
3.
we have also excluded the sources too close to the edges of the field of view or to the gaps between the CCDs. We note that these sources could have either the flux and/or the source centroid affected by the proximity to the edges and/or the gaps, and therefore could represent a problem in the subsequent analysis and/or interpretation of the data. The excluded area has been taken into account in the computation of the sky coverage;
-
4.
finally, in order to guarantee that all the sources in the catalogue are truly serendipitous we have excluded the target and the sources physically related to the target.
3 Preliminary Results
At the time of this writing (January, 2002) 104 suitable XMM-Newton fields have been already analyzed and a first sample of 185 sources selected. Some general considerations, tested and verified using this initial sample, are in order:
-
•
the majority of the X-ray sources have enough statistics (hundreds of counts when data from EPIC MOS1 and pn are also considered) to allow X-ray studies in terms of energy distribution, source extension and flux variability;
-
•
the optical counterpart, for the large majority (85% - 90%) of the objects, has a magnitude above the POSS II limit (R ), thus allowing spectroscopic identification at a 4m class telescope. Furthermore, given the positional accuracy of XMM-Newton for the bright sources (90% error circle of 2-5 arsec) and the magnitude of the optical counterparts, only one object needs to be observed to secure the optical identification. Among the blank fields, rare and interesting classes of X-ray sources (e.g. high z clusters of galaxies, BL Lacs, highly absorbed AGN) could be present;
-
•
about of the sources are identified through a literature search (NED, SIMBAD);
-
•
for all the sources north of radio information is available down to a few mJy level (NRAO VLA Sky Survey, NVSS; [\astronciteCondon et al.1998]). Information at other wavelength, although incomplete will be abundant (e.g. the 2MASS survey, optical colors).
3.1 The number-counts relationship
In Figure 1 we show (filled circles) a binned representation of the number-flux relationship, obtained by folding the sky coverage with the flux of each source. As already said, the sky coverage of the XMM-Newton BSS at the flux limit used to define the sample, is flat and up to now sq.deg. have been covered. A conversion factor appropriate for a power-law spectral model with energy index equal to 0.9 (see Section 3.3), filtered by an cm-2, has been used in the conversion between the count rate and the flux [1 cts/s (0.5–4.5 keV) = ergs cm-2 s(0.5–4.5 keV)]. This count rate to flux conversion factor is accurate for all the energy spectral indices in the range between 0.0 and 2.0 and for all the in the range between cm-2 and cm-2.
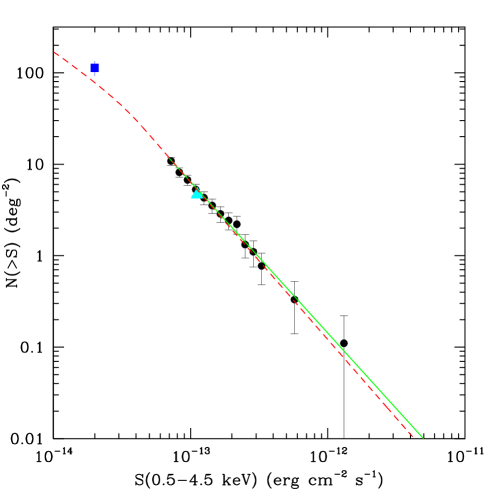
Because we are primarily interested in the extragalactic number-flux relationship we have excluded from the computation the sources classified as (or suspected to be) stars. In the same figure we also report a parametric representation (green solid line) of the LogN(S)–LogS obtained by applying the maximum likelihood method to the unbinned data (see [\astronciteGioia et al.1990] for details). The fit has been performed from a flux of ergs cm-2 s(the faintest flux) to a flux of ergs cm-2 s. For fluxes brighter than this limit we may not be complete since most of the “bright” X-ray sources were chosen as target of the observation and then excluded, by definition, from the survey. However we note that the space density of sources with flux greater than ergs cm-2 sis such that fewer than 2 sources are expected given the sky coverage area.
The LogN(S)–LogS can be described by a power-law model N(S) = K with best-fit value for the slope ( confidence interval). The normalization K is determined by rescaling the model to the actual number of objects in the sample and, in the case of the “best” fit model, is equal to K = deg-2.
The red dashed line represents the extragalactic ROSAT (0.5 – 2.0 keV) Log(NS)-LogS adapted from [\astronciteHasinger et al.1998] and converted to the 0.5–4.5 keV energy band using a power-law spectral model having . The sky-blue filled triangle at ergs cm-2 srepresents the extragalactic number density at the flux limit of the EMSS [\astronciteGioia et al.1990] converted from the original (0.3–3.5 keV) to the 0.5–4.5 keV energy band using the same spectral model as before. Finally, the blue filled square at ergs cm-2 srepresents the extragalactic surface density obtained from the XMM-Newton AXIS Medium Survey team in the same energy range of the XMM-Newton BSS ([\astronciteBarcons et al.2002]).
As the figure clearly shows, a very good agreement with previous and new results is obtained assuring us about data analysis and selection. Consistent results are also obtained from a comparison with the HELLAS2XMM survey ([\astronciteBaldi et al.2002]).
3.2 Optical identification and classification
The XMM-Newton BSS sample assembled so far is composed of 185 sources. Up to now 59 source have been spectroscopically identified; 39 of these identifications come from the literature (NED, SIMBAD) while 20 from the XMM-Newton XID AXIS project ([\astronciteBarcons et al.2002]). The optical breakdown is the following: 30 broad line AGN (QSOs/Seyfert 1), 3 type 2 AGNs, 1 optically “normal” galaxy, 5 clusters of galaxies, 1 BL Lac object and 19 stars. However we stress that this sample of identified objects is probably not representative of the whole population. A flavour of the dominant X-ray source population in the 0.5–4.5 keV energy range at an X-ray flux limit of ergs cm-2 smay be obtained from the almost complete (93%) spectroscopic identification of a small sample of 29 X-ray sources selected from two XMM-Newton fields studied in the AXIS project ([\astronciteBarcons et al.2002]).
3.3 Spectral properties
A “complete” spectral analysis for all the sources in the bright sample (using data from the two EPIC MOSs and the EPIC pn) is in progress. In the meantime and in order to gain X-ray spectral information we present here a “Hardness Ratio” analysis of the single sources using only EPIC MOS2 data; this latter method is equivalent to the “color-color” analysis largely used at optical wavelengths.
We have used the hardness ratios as defined from the XMM-Newton pipeline
processing:
and
where C(0.52 keV), C(24.5 keV) and C(4.57.5 keV) are the count rates 333Note that the count rates have been computed using the exposure-map in each energy band, so that energy dependent vignetting is approximately corrected. in the 0.52, 24.5 and 4.57.5 keV energy bands, respectively. We have not used here HR1 which is defined using C(0.150.5 keV) and C(0.52 keV) energy band since the count rate in the (0.150.5 keV) energy band is a strong function of the Galactic absorbing column density along the line of sight. Note that the effect on HR2 and HR3 due to the different for the objects in the sample (which range between to cm-2) is completely negligible.
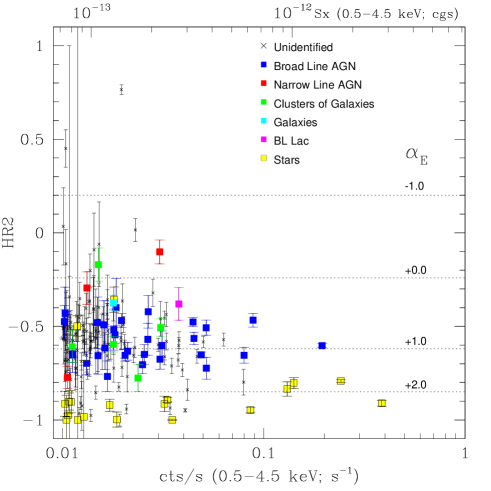
In Figure 2 we show the HR2 as a function of the count rate in the (0.5 – 4.5) keV energy band. On the top, we have reported the flux scale computed assuming a conversion factor appropriate for , which is the mean energy spectral index of the “extragalactic” sample in the 0.5–4.5 keV energy band (see below). We have used different colors to mark the spectroscopically identified and classified objects. It is worth noting that a) all but 2 () of the sources classified as stars have an HR2 less than and b) none of the X-ray sources identified so far with extragalactic objects have HR2 below . If we assume a simple Raymond-Smith thermal model, HR20.8 corresponds to temperatures below keV, in very good agreement with the stellar identification. This is a first nice result on the statistical broad band properties of the sample; this criterion, if confirmed from better statistics, could be used to select (or exclude depending on the scientific goal) the stars from the XMM-Newton source database. We are at the moment investigating the combination of this criteria with the usual X-ray to optical flux ratio.
No obvious trend of the source spectrum as a function of the count rate is clearly visible. If we exclude the objects classified as stars the weighted average is HR2 corresponding to . For comparison the weighted average of the sources classified as Broad Line AGN, clusters of galaxies and unidentified objects is HR2, HR2 and HR2, respectively. Two of the three sources identified as Narrow Line AGN seem to have an energy spectral index flatter than that of the cosmic X-ray background ( corresponding to HR2); on the contrary none of the X-ray sources identified as Broad Line AGN seem to have a spectra flatter than . Finally among the unidentified sources about 13% seem to be described by an energy spectral index below .
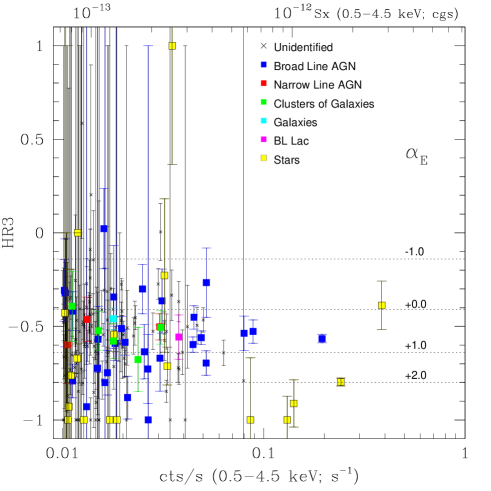
In Figure 3 we report HR3 as a function of the count rate in the (0.5 – 4.5) keV energy band (symbols and flux scale on the top are as in Figure 2). This hardness ratio is much noisier since many of the sources are detected with poor statistics (or even undetected) in the 4.5–7.5 keV energy band. No separation between the different classes of X-ray sources is clearly visible although the large errors could prevent us from finding possible differences. With the same caveat, no obvious trend of the source spectra as a function of the count rate is clearly visible; the median HR3 of the “extragalactic” population is HR3 corresponding to .
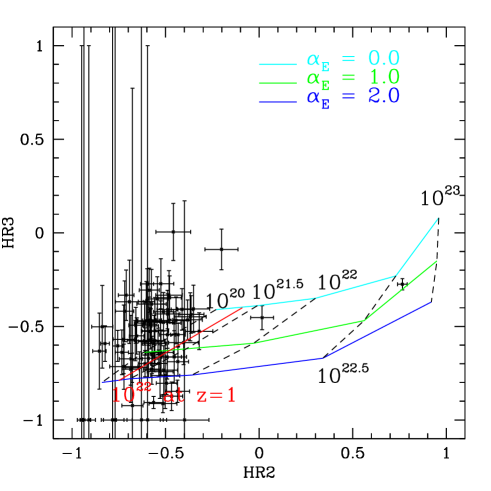
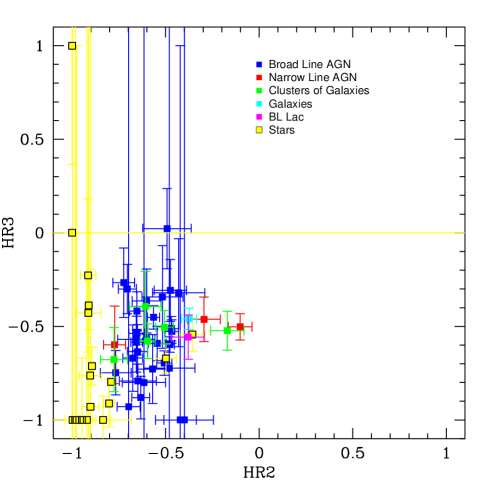
Combining the information on HR2 and HR3 we can study the broad band (0.5–7.5 keV) spectral properties of the sample as well as the selection function of the XMM-Newton BSS. In Figure 4 we report the position of the unidentified objects in the HR2-HR3 plane. Because of the large errors on HR3 for some of the sources, we have plotted here only the 85 unidentified sources with at least 100 net counts in the 0.5–4.5 keV energy band. We have also reported in this figure the expected HR2 and HR3 values for a simple absorbed power-law model as a function of and . In this simple model the absorption has been assumed at ; for comparison the red line corresponds to an absorption with cm-2at z=1. Finally in Figure 5 we report the position of the identified objects in the HR2 - HR3 plane.
Useful information can be extracted by comparing the position of the sources with the “locus” expected from a simple absorbed power-law model. The “bulk” of the sources are strongly clustered in the region where “unabsorbed” objects are expected. There are very few objects with hardness ratios consistent with those expected from an absorbed power-law model having (at z=0) in the range between and cm-2 (four more objects are present in this area if we consider also the unidentified sources with less than 100 counts). It is too early to speculate whether the paucity of these objects is due to selection effects (energy band, flux limit, etc..) or it is intrinsic. It will be instructive to compare the results obtained from the XMM-Newton BSS with the results obtained from other samples selected at harder energies e.g. in the 5–10 keV energy range.
Indeed we are able to detect absorbed objects; for example we already have 3 Narrow Line AGN and two of these sources have the hardest spectra amongst the identified objects, highly suggestive of intrinsic absorption. It is worth noting that the class of “Compton thick” absorbed AGN, which could represent a considerable fraction of the absorbed AGN population ([\astronciteBassani et al.1999]; [\astronciteRisaliti et al.1999]), could have X-ray spectral properties similar to that expected from unabsorbed AGN (see [\astronciteDella Ceca et al.1999]). Moreover an absorbed AGN at z=1 having cm-2 should have hardness ratios around the red line reported in Figure 4; at the flux limit of the XMM-Newton BSS this AGN should have an intrinsic X-ray luminosity erg s-1 i.e. in the type 2 QSOs regime. Therefore, some Type 2 QSOs could be already present among the unidentified sources. For these objects the XMM-Newton BSS will be fundamental since, for many of them, it will be possible to compare their X-ray spectral properties (e.g. presence of Fe lines, spectral slope, etc..) with the optical ones (e.g. presence of broad and/or narrow line, colors etc..).
4 Summary and Conclusions
In this paper we have discussed “The XMM-Newton Bright Serendipitous Source Sample” (XMM-Newton BSS). This sample is designed to contain sources at high galactic latitude having a flux limit of erg cm-2 s-1 in the 0.5–4.5 keV energy band 444Given a density of about 1.8 XMM-Newton BSS source per EPIC MOS2 field we need about 600 suitable EPIC MOS2 data set to build up the sample. At the actual XMM-Newton observation rate we expect to complete the selection and definition of the XMM-Newton BSS sample ( sources) in two years. . The main scientific goals of the project are the study of the mix of the different kind of AGN, the investigation of the cosmological evolution of clusters of galaxies and the definition of a statistical identification procedure to select rare and interesting populations of X-ray sources using the “huge” amount of data that will be accumulated by XMM-Newton in the next few years.
We have discussed the survey strategy with respect to the energy selection band, primary selection camera (EPIC MOS2 detector), criteria for field and source selection.
From the analysis of 104 EPIC MOS2 fields, a first sample of 185 X-ray sources has been selected.
A preliminary analysis indicates that:
a) the optical counterpart of the majority (85-90%) of these X-ray sources has an optical magnitude above the POSS II limit (R ), thus allowing spectroscopic identification on a 4 meter telescope;
b) given the X-ray positional accuracy of such bright sources (2-5 arcsec at the 90% confidence level) and the magnitude of the optical counterpart only one object needs to be observed to obtain the optical identification;
c) the majority of the X-ray sources have enough statistics (hundreds of counts if data from EPIC MOS1, MOS2 and pn are combined) to allow X-ray studies in terms of energy distributions, source extent and flux variability.
Fifty-nine sources (32% of the sample) have been identified so far. The large majority of the identified objects are broad line AGN (30); we have also found 3 narrow line AGN, 1 optically “normal” galaxy, 5 clusters of galaxies, 1 BL Lac object and 19 stars. However please note that the sample of identified objects is not statistically representative of the full sample.
Using the sample of 185 sources, we have investigated the number-flux relationship, which is well described by a power law model, N(S) = K , with best fit value for the slope of ( confidence interval). A very good agreement with previous and new results is obtained making us confident of the correctness of data selection and analysis.
We have investigated the broad band spectral properties of the sample using the hardness ratio method. No obvious trend of the source spectra as a function of the count rate is clearly visible. The average spectra of the “extragalactic” population corresponds to an energy spectral index of ; about 13% of the sources seem to be described by an energy spectral index flatter than that of the CXB ().
A nice result is the finding of a clear separation, in the hardness ratio diagram, between galactic stars and extragalactic sources.
Using the position of the sources in the hardness ratio diagram we have also discussed the possible composition of the XMM-Newton BSS as a function of intrinsic absorption. Apparently we found very few sources which seem to be described by an absorbed power-law having (at z=0) in the range between and cm-2. To shed light on the CXB modeling it will be important to compare the source composition of this sample with the source composition of complete samples selected at harder energies (e.g. 5–10 keV energy range). On the other hand our sample could contain “Compton thick” local sources and/or high luminosity type 2 AGN. In this respect the XMM-Newton BSS will be, once fully identified, an important tool to investigate and to compare in detail X-ray and optical/infrared spectral properties.
Finally the XMM-Newton BSS will be instrumental to investigating the cosmological evolution properties of clusters of galaxies. Up to now only 5 X-ray sources have been identified as clusters of galaxies. On the basis of known cosmological properties we expect between 120 (in the case of negative evolution) and 160 (in the case of no evolution) clusters of galaxies; the largest discrepancy is on the predicted number of clusters in the high luminosity - high z plane, a region not well sampled yet. An appropriate source detection algorithm for extended sources (e.g. wavelet) is under investigation.
Acknowledgements.
This work is based partly on observations with XMM-Newton, an ESA Science Mission with instruments and contributions directly funded by ESA Members States and the USA (NASA). The XMM-Newton project is supported by the Bundesministerium für Bildung und Forschung / Deutsches Zentrum für Luft- und Raumfahrt (BMBF/DLR), the Max-Planck Society and the Heidenhain-Stiftung. This research has made use of the NASA/IPAC Extragalactic Database (NED; which is operated by the Jet Propulsion Laboratory, California Institute of Technology, under contract with the National Aeronautics and Space Administration) and of the SIMBAD database (operated at CDS, Strasbourg, France). RDC, TM and AC acknowledge partial financial support by the Italian Space Agency (ASI) and by the MURST (Cofin00-32-36). PS acknowledge partial financial support by the Italian Consorzio Nazionale per l’Astronomia e l’Astrofisica (CNAA). XB and FJC acknowledge financial support from the Spanish MCyT under project AYA2000-1690. AS was supported by the DLR under grant 50 OX 9801 3.References
- [\astronciteBaldi et al.2002] Baldi, A., Molendi, S., Comastri, A., Fiore, F., Matt, G., & Vignali, C. 2002, Ap.J., 564, 190
- [\astronciteBarcons et al.2002] Barcons, X., Carrera, F.G., Watson, M.G., et al., 2002, A&A, 382, 522
- [\astronciteBassani et al.1999] Bassani, L., Dadina, M., Maiolino, R., Salvati, M., Risaliti, G., Della Ceca, R., Matt, G., & Zamorani, G. 1999, Ap.J. Supp., 121, 473
- [\astronciteBorgani et al.2001] Borgani, S. et al. 2001, Ap.J, 561, 13
- [\astronciteCondon et al.1998] Condon, J. J., Cotton, W. D., Greisen, E. W., Yin, Q. F., Perley, R. A., Taylor, G. B., & Broderick, J. J. 1998, A.J., 115, 1693
- [\astronciteDella Ceca et al.1999] Della Ceca, R., Castelli, G., Braito, V., Cagnoni, I., & Maccacaro, T. 1999, Ap.J., 524, 674
- [\astronciteDella Ceca et al.2000] Della Ceca, R., Maccacaro, T., Rosati, P., & Braito, V. 2000, A&A, 355, 121
- [\astronciteEhle et al.2001] Ehle, M., et al. 2001, XMM-Newton Users’ Handbook
- [\astronciteGioia et al.1990] Gioia, I. M., Maccacaro, T., Schild, R. E., Wolter, A., Stocke, J. T., Morris, S. L., & Henry, J. P. 1990, Ap.J. Supp., 72, 567
- [\astronciteHasinger et al.1998] Hasinger, G., Burg, R., Giacconi, R., Schmidt, M., Trumper, J., & Zamorani, G. 1998, A&A, 329, 482
- [\astronciteHasinger et al.2001] Hasinger, G., et al. 2001, A&A, 365, L45
- [\astronciteMaiolino et al.2001] Maiolino, R., Marconi, A., Salvati, M., Risaliti, G., Severgnini, P., Oliva, E., La Franca, F., & Vanzi, L. 2001, A&A, 365, 28
- [\astronciteMiyaji et al.(2000)] Miyaji, T., Hasinger, G. ;., & Schmidt, M. 2000, A&A, 353, 25
- [\astronciteRisaliti et al.1999] Risaliti, G., Maiolino, R., & Salvati, M. 1999, Ap.J, 522, 157
- [\astronciteRosati et al.1998] Rosati, P., Della Ceca, R., Norman, C., & Giacconi, R. 1998, Ap.J. Lett., 492, L21
- [\astronciteWatson et al.2001] Watson, M. G. et al. 2001, A&A, 365, L51