22institutetext: Mount Wilson Observatory, 740 Holladay Road, Pasadena, CA 91106, U.S.A.
33institutetext: Currently at: LAEFF-INTA, ESA Satellite Tracking Station, PO 50727, E-28080 Madrid, Spain
44institutetext: Instituto de Astrofísica de Canarias, E-38200 La Laguna, Tenerife, Spain
55institutetext: Main Astronomical Observatory of Academy of Sciences of Ukraine, Golosiiv woods, Kyiv-127, 03680, Ukraine
66institutetext: Consejo Superior de Investigaciones Científicas, Madrid, Spain
77institutetext: McDonald Observatory and Department of Astronomy, University of Texas, Austin, TX 78712-1083, U.S.A.
88institutetext: Institute for Astronomy, Univ. of Hawaii at Manoa, Honolulu, HI 96822, U.S.A.
99institutetext: Departamento de Astrofísica, Universidad de La Laguna, E-38206 La Laguna, Tenerife, Spain
Lithium and H in stars and brown dwarfs of Orionis ††thanks: Based on observations made with the following telescopes: 3.5-m telescope at the Spanish-German Calar Alto Observatory (Spain) operated by the Max-Planck-Institut für Astronomie in Heidelberg (Germany); 2.5-m Isaac Newton telescope operated on the island of La Palma by the Isaac Newton Group in the Spanish Observatorio del Roque de Los Muchachos of the Instituto de Astrofísica de Canarias; 2.1-m Otto Struve telescope at McDonald Observatory (U.S.A.); and the 10-m Keck II telescope of the W. M. Keck Observatory, which is operated as a scientific partnership among the California Institute of Technology, the University of California and the National Aeronautics and Space Administration (the Observatory was made possible by the generous financial support of the W. M. Keck Foundation).
We present intermediate- and low-resolution optical spectra around H and Li i 6708 Å for a sample of 25 low mass stars and 2 brown dwarfs with confirmed membership in the pre-main sequence stellar Orionis cluster. Our observations are intended to investigate the age of the cluster. The spectral types derived for our target sample are found to be in the range K6–M8.5, which corresponds to a mass interval of roughly 1.2–0.02 on the basis of state-of-the-art evolutionary models. Radial velocities (except for one object) are found to be consistent with membership in the Orion complex. All cluster members show considerable H emission and the Li i resonance doublet in absorption, which is typical of very young ages. We find that our pseudo-equivalent widths of H and Li i (measured relative to the observed local pseudo-continuum formed by molecular absorptions) appear rather dispersed (and intense in the case of H) for objects cooler than M3.5 spectral class, occurring at the approximate mass where low mass stars are expected to become fully convective. The least massive brown dwarf in our sample, S Ori 45 (M8.5, 0.02 ), displays variable H emission and a radial velocity that differs from the cluster mean velocity. Tentative detection of forbidden lines in emission indicates that this brown dwarf may be accreting mass from a surrounding disk. We also present recent computations of Li i 6708 Å curves of growth for low gravities and for the temperature interval (about 4000–2600 K) of our sample. The comparison of our observations to these computations allows us to infer that no lithium depletion has yet taken place in Orionis, and that the observed pseudo-equivalent widths are consistent with a cluster initial lithium abundance close to the cosmic value. Hence, the upper limit to the Orionis cluster age can be set at 8 Myr, with a most likely value around 2–4 Myr.
Key Words.:
circumstellar matter — stars: abundances — stars: evolution — stars: late-type — stars: low mass, brown dwarfs — stars: pre-main sequence — open clusters and associations: Orionis1 Introduction
Deep photometric and spectroscopic searches in various nearby star-forming regions and young open clusters have revealed populations of very low mass stars (0.3 ), brown dwarfs (see Basri basri00 (2000) for a review) with masses below the hydrogen-burning mass limit (0.075 ) and planetary-mass objects (Najita, Tiede, & Carr najita00 (2000); Lucas et al. lucas01 (2001); Zapatero Osorio et al. osorio00 (2000)) smaller than the deuterium-burning threshold at 0.013 (Saumon et al. saumon96 (1996)). Age is one of the most relevant parameters for their study and characterization. Traditionally, mass estimates of cluster members rely on evolutionary models, which predict luminosities and effective temperatures (hereafter ) as a function of time and mass. This procedure, namely isochrone fitting to observational photometric diagrams, is highly age dependent for the smallest objects because they coold down very quickly (e.g., D’Antona & Mazzitelli dantona94 (1994); Burrows et al. burrows97 (1997); Chabrier et al. chabrier00 (2000)). To better constrain masses, it is desirable to date clusters with higher accuracy.
Lithium absorption features in optical spectra can be used as a tracer of the stellar internal structure. In addition, lithium is valuable to assess the age of stars in clusters. Dating young clusters and field objects based on lithium analysis is a procedure nearly independent of distance and reddening, in marked contrast to the isochrone-fitting technique. Moreover, lithium isochrones do not significantly depend on metallicity (D’Antona dantona00 (2000)), rendering the lithium dating technique very powerful. Pre-main sequence stars with large convective regions burn lithium efficiently on short time scales (see Pinsonneault pin97 (1997) for a review) as soon as the temperature at the base of the convective zone becomes hot enough to undergo the nuclear reaction 7Li + p 4He + . Stars smaller than the Sun require only about 10–15 Myr to deplete this element by one order of magnitude, and all M-type stars are observed to have destroyed their lithium at ages around 20–40 Myr (e.g., Pinsonneault, Kawaler & Demarque pin90 (1990); D’Antona & Mazzitelli dantona94 (1994), dantona97 (1997); Baraffe et al. baraffe98 (1998)). Furthermore, lithium detections in fully convective objects near and below the substellar limit have been successfully used to constrain the ages of clusters like the Pleiades (Basri, Marcy & Graham basri96 (1996); Martín et al. martin98a (1998); Stauffer, Schultz, & Kirkpatrick stauffer98 (1998)), Persei (Stauffer et al. stauffer99 (1999)), and IC 2391 (Barrado y Navascués et al. barrado99 (1999)). Lithium dating, which is fundamentally a nuclear age calibrator, can be considered reliable even though some uncertainties (rotation, activity, mixing processes) may affect theoretical calculations.
Recently, various groups have investigated the stellar and substellar populations around the bright, massive and multiple O9.5V-type star Orionis, which gives its name to the association (Walter et al. walter94 (1994); Wolk wolk96 (1996); Walter, Wolk, & Sherry walter98 (1998); Béjar, Zapatero Osorio, & Rebolo bejar99 (1999); Zapatero Osorio et al. osorio99 (1999), osorio00 (2000); Béjar et al. bejar01a (2001)). These authors have adopted a cluster age between 1 Myr and 7 Myr (Blaauw blaauw64 (1964); Warren & Hesser warren78 (1978); Brown, de Geus, & de Zeeuw brown94 (1994)). This is the age interval estimated for the O9.5V-type star based on its physical properties, evolutionary stage (still burning hydrogen on the main sequence) and membership in the Orion OB1b subgroup (Blaauw blaauw91 (1991)). Other properties of the Orionis cluster, e.g., distance (352 pc) and reddening ( mag), are discussed in Béjar et al. (bejar01a (2001)). Here we examine low mass stars and brown dwarfs with confirmed membership to determine the most likely age of the cluster. We report on observations of intermediate- and low-resolution optical spectroscopy in Sects. 3 and 4. A discussion and main conclusions are given in Sects. 5 and 6, respectively.

| Object | (J2000) | Obs. date | Observ. | Disp. | Wl. range | Exp. time | |
|---|---|---|---|---|---|---|---|
| () () | (mag) | (UT) | (Å/pix) | (Å) | (s) | ||
| 4771–1075 | 05 39 05.3 –2 32 30 | 12.66 | 20 Nov 1998 | CAHA | 0.55 | 6220–7297 | 700 |
| 4771–1097 | 05 38 35.7 –2 30 43 | 12.43 | 20 Nov 1998 | CAHA | 0.55 | 6220–7297 | 800 |
| r053907–0228 | 05 39 07.6 –2 28 23 | 14.33 | 20 Nov 1998 | CAHA | 0.55 | 6220–7297 | 21200 |
| S Ori J053958.1–022619 | 05 39 58.1 –2 26 19 | 14.19 | 21 Nov 1998 | CAHA | 0.55 | 6220–7297 | 21200 |
| S Ori J053920.5–022737 | 05 39 20.5 –2 27 37 | 13.51 | 21 Nov 1998 | CAHA | 0.55 | 6220–7297 | 21200 |
| r053833-0236∗ | 05 38 33.9 –2 36 38 | 13.71 | 21 Nov 1998 | CAHA | 0.55 | 6220–7297 | 21500 |
| 22 Nov 1998 | CAHA | 2.41 | 6194–10000 | 650 | |||
| 26 Jan 1999 | ORM | 0.84 | 6034–6840 | 1200 | |||
| S Ori J053949.3–022346 | 05 39 49.3 –2 23 46 | 15.14 | 21 Nov 1998 | CAHA | 0.55 | 6220–7297 | 1800 |
| 4771–1051∗ | 05 38 44.1 –2 40 20 | 12.33 | 21 Nov 1998 | CAHA | 0.55 | 6220–7297 | 900, 535 |
| 26 Jan 1999 | ORM | 0.84 | 6034–6840 | 1200 | |||
| S Ori J053715.1–024202 | 05 37 15.1 –2 42 02 | 15.07 | 21 Nov 1998 | CAHA | 2.41 | 6194–10000 | 600 |
| S Ori J053951.6–022248 | 05 39 51.6 –2 22 48 | 14.59 | 22 Nov 1998 | CAHA | 2.41 | 6194–10000 | 2600 |
| S Ori 45 | 05 38 25.5 –2 48 36 | 19.59 | 21 Dec 1998 | Keck | 0.85 | 6324–8025 | 31800 |
| S Ori 27 | 05 38 17.3 –2 40 24 | 17.07 | 21 Dec 1998 | Keck | 0.85 | 6324–8025 | 21200 |
| r053820–0237∗ | 05 38 20.3 –2 37 47 | 12.83 | 25 Jan 1999 | ORM | 0.84 | 6034–6993 | 21200 |
| r053831–0235∗ | 05 38 31.4 –2 35 15 | 13.52 | 25 Jan 1999 | ORM | 0.84 | 6034–6840 | 600, 1800 |
| 4771–899∗ | 05 38 47.9 –2 27 14 | 12.08 | 25 Jan 1999 | ORM | 0.84 | 6034–6840 | 300 |
| S Ori J053847.5–022711 | 05 38 47.5 –2 27 11 | 14.46 | 26 Jan 1999 | ORM | 0.84 | 6034–6840 | 21800 |
| S Ori J054005.1–023052 | 05 40 05.1 –2 30 52 | 15.90 | 26 Jan 1999 | ORM | 0.84 | 6034–6840 | 22700 |
| S Ori J054001.8–022133 | 05 40 01.8 –2 21 33 | 14.32 | 26 Jan 1999 | ORM | 0.84 | 6034–6840 | 21200 |
| r053838-0236∗ | 05 38 38.0 –2 36 38 | 12.37 | 27 Jan 1999 | ORM | 0.84 | 6034–6840 | 2100 |
| 4771–41 | 05 38 27.1 –2 45 10 | 12.82 | 27 Jan 1999 | ORM | 0.84 | 6034–6840 | 21200 |
| 4771–1038∗ | 05 39 11.5 –2 36 03 | 12.78 | 28 Jan 1999 | ORM | 0.84 | 6034–6840 | 22400 |
| r053840-0230∗ | 05 38 40.2 –2 30 19 | 12.80 | 28 Jan 1999 | ORM | 0.84 | 6034–6840 | 22400 |
| r053820–0234 | 05 38 20.4 –2 34 09 | 14.58 | 29 Jan 1999 | ORM | 0.84 | 6034–6840 | 900, 1800 |
| r053849–0238∗ | 05 38 49.0 –2 38 21 | 12.88 | 03 Dec 1999 | McDonald | 0.70 | 6150–6850 | 51200 |
| r053923–0233∗ | 05 39 22.7 –2 33 33 | 14.16 | 03 Dec 1999 | McDonald | 0.70 | 6150–6850 | 81200 |
| S Ori J053827.4–023504 | 05 38 27.4 –2 35 04 | 14.50 | 05 Dec 1999 | McDonald | 0.70 | 6150–6850 | 121200 |
| S Ori J053914.5–022834 | 05 39 14.5 –2 28 34 | 14.75 | 06 Dec 1999 | McDonald | 0.70 | 6150–6850 | 21200 |
| S Ori J053820.1–023802 | 05 38 20.1 –2 38 02 | 14.41 | 06 Dec 1999 | McDonald | 0.70 | 6150–6850 | 101200 |
∗ Also detected in X-rays (Wolk wolk96 (1996)).
| Run | Observ. | Teles. | Spectrograph | Grating | Detector | Spatial res. | Slit width |
|---|---|---|---|---|---|---|---|
| 20 Nov 1998 | CAHA | 3.5-m | TWIN | T06 | SITe 2000800 pix | 0.56″/pix | 1.2″ |
| 21 Nov 1998 | CAHA | 3.5-m | TWIN | T11 | SITe 2000800 pix | 0.56″/pix | 1.2″ |
| 20 Dec 1998 | Keck | Keck II | LRIS | 900/5500 | 20482048 pix | 0.22″/pix | 1.0″ |
| 25–28 Jan 1999 | ORM | INT | IDS | R1200Y | Tektronix 10241024 pix | 0.70″/pix | 1.7″ |
| 03–06 Dec 1999 | McDonald | 2.1-m | ES2 | #25 | Craf/Cassini 10241024 pix | 2.72″/pix | 2.1″ |
2 Sample selection
Our list of 28 targets (12.3 19.6, 4200–2400 K) comprises Orionis solar-mass and low mass stars, and brown dwarfs selected from different surveys (see Table 1). All have been identified as genuine cluster members using various techniques. Stars labelled with “4771” and “r” were first identified by Wolk (wolk96 (1996)). photometry, spectroscopy, and strong X-ray detections (in many cases) are available. Wolk (wolk96 (1996)) provided equivalent widths of the Li i resonance doublet for a few of these stars. However, his spectroscopic data of relatively faint sources have poor signal-to-noise (S/N) ratios, which severely affects the measurements. We decided to re-observe them to improve the quality of the spectra. S Ori targets (IAU nomenclature) have been selected from the survey of Béjar (bejar01b (2001)). They nicely fit in the cluster optical-infrared sequence. Albeit we lack previous spectroscopic data for them, the spectra presented here confirm them as very active, young sources, and therefore, they have to be cluster members. The two brown dwarfs in our sample, S Ori 27 and 45, have been taken from Béjar et al. (bejar99 (1999)), where they are discussed at length.


Names, coordinates and magnitudes of our sample are provided in Table 1. Their location in the optical color-magnitude diagram is illustrated in Fig. 1, where photometry has been taken from Wolk (wolk96 (1996)), Béjar et al. (bejar99 (1999)) and Béjar (bejar01b (2001)). Overplotted are the solar metallicity, and “no-dust” 3 Myr and 5 Myr isochrones of D’Antona & Mazzitelli (dantona97 (1997)) and Baraffe et al. (baraffe98 (1998)), respectively. Masses as predicted by the models are indicated in the figure. Comparisons with other tracks are provided in Béjar et al. (bejar99 (1999)). Our targets have masses ranging from 1.2 down to roughly 0.02 .


3 Observations and data reduction
We acquired intermediate- to low-resolution optical spectra using the following telescopes: the 3.5-m telescope at Calar Alto (CAHA) Observatory in Almería (Spain), the 2.5-m Isaac Newton telescope (INT) at the Roque de los Muchachos Observatory (ORM) on the island of La Palma (Spain), the 10-m Keck II telescope at Mauna Kea Observatory on the island of Hawaii (U.S.A.), and the Otto Struve 2.1-m telescope at McDonald Observatory in west Texas (U.S.A.). Observing campaigns, spectrographs attached to the Cassegrain focus of each telescope, detectors, gratings and slit widths used for collecting data are summarized in Table 2. The red arm of the TWIN instrument (CAHA) and the 235 mm camera of the IDS spectrograph (ORM) were chosen. Table 1 shows the journal of the observations, which includes the nominal dispersions of the instrumental setups. No binning of the pixels along the spectral direction and the projection of the slits onto the detectors yielded spectral resolutions of 1.54 Å ( 4400, CAHA, first run), 4.82 Å ( 1600, CAHA, second run), 1.68 Å ( 3800, ORM), 2.89 Å ( 2500, Keck), 1.4 Å ( 4600, McDonald), and spatial resolutions as listed in Table 2. A binning of 8 pixels along the spatial direction was applied to the CCD at McDonald. Filters blocking the light blueward of 5000Å were used at the CAHA and ORM telescopes. No order-blocking filter was used at the Keck II telescope; nevertheless, the two targets observed are very red and the contribution of their blue light to the far-red optical spectrum is negligible (Martín et al. martin99 (1999)). Weather conditions during the four runs (CAHA, ORM, Keck and McDonald) were spectroscopic. The seeing in the visible was stable at around 1″ at Keck, and 1.5″–2″ at CAHA and ORM. The spatial resolution at McDonald was 2.72″/pix due to some technical problems related to the instrumentation.
Raw images were reduced with standard procedures including bias subtraction and flat-fielding within noao iraf111IRAF is distributed by National Optical Astronomy Observatory, which is operated by the Association of Universities for Research in Astronomy, Inc., under contract with the National Science Foundation.. We extracted object and sky spectra using the optimal extraction algorithm available in the apextract package. A full wavelength solution from calibration lamps taken immediately after each target was applied to the spectra. The of the fourth-order polynomial fit to the wavelength calibration is typically 5–10% the nominal dispersion. To complete the data reduction, we corrected the extracted spectra for instrumental response using data of spectrophotometric standard stars (HD 19445, Feige 34, G 191 B2B, BD+26 2606) obtained on the same nights and with the same instrumental configurations. These stars have fluxes available in the iraf environment (Massey et al. massey88 (1988)).
The resulting spectra are depicted in Figs. 2–5. They are ordered by increasingly late spectral type and shifted by a constant for clarity. The region around the Li i 6708 Å line is amplified in Figs. 6–9. In Fig. 7 we have included the spectrum of the field M6-type spectroscopic standard star Gl 406 for a better comparison.


4 Analysis and results
4.1 Spectral types
We inferred spectral types by comparing our target spectra to data of spectroscopic standard stars (Gl 820A, K5V; Gl 820B, K7V; Gl 338A, M0V; Gl 182, M0.5V; Gl 767A, M1V; Gl 767B, M2.5V; Gl 569A, M3V; Gl 873, M3.5; Gl 402, M4V; Gl 905, M5V; and Gl 406, M6V). The reference spectra were obtained with similar instrumentations in previous campaigns. In addition, we observed several K- and M-type standards with the McDonald telescope. For the spectral classification, we also used molecular indices that are based on the relative strengths of CaH and TiO bands (Kirkpatrick, Henry & McCarthy kirk91 (1991); Prosser, Stauffer & Kraft prosser91 (1991)), and the pseudocontinuum PC3 index given in Martín, Rebolo & Zapatero Osorio (martin96 (1996)), which is valid for types later than M3. Our measurements, with an uncertainty of half a subclass, are provided in Table 3. The spectral types of S Ori 27 and 45 have been taken from Béjar et al. (bejar99 (1999)). The final adopted spectral classes are in the range K6–M8.5.
| Objecta | Sp. T.b | MJDc | pEWd (H) | pEWe (Li i) | log | Template | |||
|---|---|---|---|---|---|---|---|---|---|
| (–51000) | (Å) | (Å) | (km s-1) | ||||||
| 4771–1075 | 12.66 | 0.87 | K7.0 | 137.9536 | 0.70.1 | 0.590.09 | –4.250.09 | 29.77 | 4771–1051 |
| 4771–1097 | 12.43 | 0.79 | K6.0 | 137.9686 | 2.20.8 | 0.470.07 | –3.770.19 | 34.97 | 4771–1051 |
| r053907–0228 | 14.33 | 1.41 | M3.0 | 137.9881 | 3.60.7 | 0.670.08 | –3.630.13 | 39.07 | 4771–1051 |
| J053958.1–022619 | 14.19 | 1.41 | M3.0 | 138.0676 | 4.00.8 | 0.730.10 | –3.590.13 | 47.47 | 4771–1051 |
| J053920.5–022737 | 13.51 | 1.34 | M2.0 | 138.1046 | 3.20.7 | 0.650.10 | –3.660.14 | 33.07 | 4771–1051 |
| r053833–0236 | 13.71 | 1.54 | M4.0 | 138.1237 | 14.02.0 | 0.600.10 | –3.100.11 | 35.87 | 4771–1051 |
| M3.0 | 139.1788 | 2.70.3 | 0.470.05 | –3.820.10 | 35.87 | – | |||
| M3.5 | 204.0726 | 2.20.8 | 0.610.08 | –3.900.19 | 35.610 | 4771–1051 | |||
| J053949.3–022346 | 15.14 | 1.80 | M4.0 | 138.1696 | 42.06.0 | 0.710.15 | –2.780.11 | 38.07 | 4771–1051 |
| 4771-1051 | 12.33 | 0.79 | K7.5 | 138.2073 | 6.41.0 | 0.580.09 | –3.310.12 | 32.87 | Gl 14 |
| K8.0 | 204.0912 | 5.51.0 | 0.590.05 | –3.370.13 | 32.87 | – | |||
| J053715.1–024202 | 15.07 | 1.63 | M4.0 | 138.9739 | 4.90.5 | 0.420.08 | –3.610.10 | 35.925 | r053833–0236 |
| J053951.6–022248 | 14.59 | 1.91 | M5.5 | 139.0881 | 60.07.0 | 0.350.10 | –2.710.10 | 40.525 | r053833–0236 |
| S Ori 45 | 19.59 | 2.88 | M8.5 | 168.4644 | 33.09.0 | 2.401.00 | –3.740.16 | –13.015 | vB 10 |
| S Ori 27 | 17.07 | 2.13 | M6.5 | 168.5276 | 5.70.5 | 0.740.09 | –3.890.09 | 35.510 | vB 10 |
| r053820–0237 | 12.83 | 0.94 | M5.0 | 203.8482 | 10.20.8 | 0.660.10 | –3.090.09 | 50.710 | 4771–1051 |
| r053831–0235 | 13.52 | 1.09 | M0.0 | 203.8849 | 4.50.5 | 0.470.07 | –3.440.10 | 35.110 | 4771–1051 |
| 4771–899 | 12.08 | 0.82 | K7.0 | 203.9329 | 3.10.5 | 0.480.07 | –3.610.12 | 31.010 | 4771–1051 |
| J053847.5–022711 | 14.46 | 1.74 | M5.0 | 203.9476 | 7.81.0 | 0.530.08 | –3.470.11 | 40.510 | 4771–1051 |
| J054005.1–023052 | 15.90 | 1.80 | M5.0 | 204.0101 | 20.56.0 | 0.720.15 | –3.090.17 | 33.610 | 4771–1051 |
| J054001.8–022133 | 14.32 | 1.52 | M4.0 | 204.0382 | 46.59.0 | 0.650.15 | –2.570.13 | 41.910 | 4771–1051 |
| r053838–0236 | 12.37 | 0.86 | K8.0 | 205.9079 | 2.90.5 | 0.530.05 | –3.680.12 | 41.610 | 4771–1051 |
| 4771–41 | 12.82 | 0.82 | K7.0 | 205.9222 | 53.59.0 | 0.500.06 | –2.380.12 | 47.710 | 4771–1051 |
| 4771–1038 | 12.78 | 0.90 | K8.0 | 206.0002 | 2.00.5 | 0.580.09 | –3.790.15 | 38.710 | 4771–1051 |
| r053840–0230 | 12.80 | 0.94 | M0.0 | 206.0299 | 6.70.6 | 0.520.05 | –3.270.09 | 46.310 | 4771–1051 |
| r053820–0234 | 14.58 | 1.59 | M4.0 | 207.0720 | 28.04.0 | 0.450.15 | –2.830.11 | 47.710 | 4771–1051 |
| r053849–0238 | 12.88 | 1.00 | M0.5 | 515.2615 | 2.60.3 | 0.550.05 | –3.670.10 | 29.010 | Gl 873, Gl 182 |
| r053923–0233 | 14.16 | 1.23 | M2.0 | 515.3933 | 4.10.5 | 0.540.08 | –3.510.10 | 31.010 | Gl 873, Gl 182 |
| J053827.4–023504 | 14.50 | 1.33 | M3.5 | 517.4297 | 21.23.0 | 0.520.05 | –2.830.11 | 36.710 | Gl 873, Gl 182 |
| J053914.5–022834 | 14.75 | 1.48 | M3.5 | 518.2596 | 4.20.7 | 0.44 | — | 31.310 | Gl 873, Gl 182 |
| J053820.1–023802 | 14.41 | 1.60 | M4.0 | 518.3899 | 9.62.0 | 0.570.07 | –3.300.14 | 29.210 | Gl 873, Gl 182 |
a Note the drop of “S Ori” for some objects.
b Uncertainty of half a subclass.
c Modified Julian date at the beginning of the exposure.
d In emission. Whenever more than one spectrum available,
the pEW has been measured over the combined data.
e In absorption. Whenever more than one spectrum available,
the pEW has been measured over the combined data.
We note that our spectral classification relies on field dwarf objects with high gravities. The gravity of Orionis cluster members is expected to be around log = 4.0 (CGS units) according to the evolutionary models of Baraffe et al. (baraffe98 (1998)) and D’Antona & Mazzitelli (dantona94 (1994)). Older K-type stellar counterparts in the field (5 Gyr) display similar gravities, but early-M and late-M stars have values 0.5 dex and 1.0 dex larger, respectively. Cool giants are characterized by very low gravities (log = 1.5–2, Bonnell & Tell bonnell93 (1993); van Belle vanbelle99 (1999)). Therefore, it is reasonable to base the spectral classification of young late-type objects on a scheme intermediate between that of dwarfs and that of giants. Luhman (luhman99 (1999)) successfully applied this exercise to members of the young cluster IC 348, inferring that the spectral classification of objects like those of Orionis can be obtained from dwarfs with an accuracy up to half a subclass. We have confirmed this by comparing the optical spectrum of our M8.5 brown dwarf with brown dwarfs of identical types in Oph and IC 348 (Luhman, Liebert & Rieke luhman97 (1997); Luhman luhman99 (1999)). The three spectra overlap very nicely. We are confident that the spectral types given in Table 3 are reliable within the quoted uncertainty.
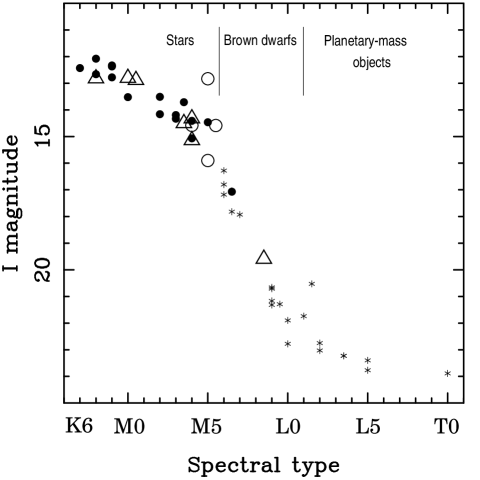
Since the spectral classification reflects effective temperatures, cluster members should lie along a defined sequence in magnitude vs spectral type diagrams. The Orionis spectroscopic sequence is depicted in Fig. 10, where we have combined data presented here with data taken from Béjar et al. (bejar99 (1999)), Barrado y Navascués et al. (2001a ) and Martín et al. (martin01 (2001)). We note that the figure covers a wide range of masses: stars, brown dwarfs and planetary-mass objects. Free-floating low mass stars and isolated planetary-mass objects in the Orionis cluster have luminosities in the -band that differ by about 3 orders of magnitude. Because substellar objects contract and fade very rapidly, such a difference becomes incredibly large at older ages, e.g., 8 orders of magnitude at 100 Myr (Chabrier et al. chabrier00 (2000)).
4.2 Rotational velocities
Given the poor velocity resolution of our spectra (68 km s-1, CAHA, first run; 176 km s-1, CAHA, second run; 78 km s-1, ORM; 120 km s-1, Keck; and 65 km s-1, McDonald), we are able to detect extremely fast rotators. These are defined as objects with projected rotational velocities, , larger than 55 km s-1. The only case in Table 3 is 4771–1097, which was observed with the largest dispersion. This star (K6) is the most massive object in our sample (0.9–1.2 ). We measured the rotational velocity by comparing its spectrum to a slowly rotating template selected from our sample. The spectrum of 4771–1075 (observed with the same instrumentation) has very sharp lines and a similar spectral type, as can be seen from Fig. 6. The full width at half-maximum of the atomic lines of this “reference” star indicates that its spectral broadening is mainly instrumental. Our procedure was to produce a set of artificial spectra spinned up to velocities of 75, 80, 95 and 110 km s-1. We then compared the observed spectrum of 4771–1097 to the synthetic rotational spectra and performed an analysis using the minimum squares technique. Spectral regions free of emission lines and telluric absorptions were considered. We derived = 8015 km s-1. Wolk (wolk96 (1996)) found clear evidence of optical photometric variability in 4771–1097 and inferred a likely rotational period of 1 day. Combining these results with predicted radii for masses in the range 0.9–1.2 and ages between 3 and 5 Myr (D’Antona & Mazzitelli dantona94 (1994); Baraffe et al. baraffe98 (1998)), we conclude that 4771–1097 is rotating with an inclination of = 50∘–90∘.
4.3 Radial velocities
We computed radial velocities via Fourier cross-correlation of the target spectra with templates of similar spectral type. Our CAHA and ORM measurements were calibrated with the radial velocity standard star Gl 14 ( = 3.30.3 km s-1, Marcy & Benitz marcy89 (1989); Marcy & Chen marcy92 (1992)), which was observed with the largest dispersion at CAHA on 1998 Nov. 20. We used this star to derive the radial velocity of 4771–1051, and then correlated the rest of our CAHA targets of the same resolution against it. We also adopted 4771–1051 as the template for the ORM data. Whether this star has a variable radial velocity is unknown to us. Thus, our ORM radial velocities might be shifted by a certain amount. However, this is unlikely (at least within the error bars of the measurements) since there is another Orionis member, r053833–0236, observed at CAHA and ORM. After correlating the ORM spectra of these two stars, we obtained for r053833–0236 a heliocentric radial velocity similar to the one derived from the CAHA data. We note that the relative radial velocity of each target with respect 4771–1051 is reliable. We adopted r053833–0236 as the reference star for the low-resolution CAHA spectra, and the M8 field star vB 10 was used as the template ( = 35.31.5 km s-1, Tinney & Reid tinney98 (1998)) for the Keck spectra. The spectrum of vB 10 was taken from Martín et al. (martin96 (1996)). Our McDonald spectra were cross-correlated against the radial velocity standard stars Gl 182 ( = 32.41.5 km s-1, Jeffries jeffries95 (1995)) and Gl 873 ( = 0.470.24 km s-1, Marcy, Lindsay & Wilson marcy87 (1987)), which were observed with the same instrumentation and on the same nights.
Radial velocities, their uncertainties and the templates used are provided in Table 3. We took special care in cross-correlating spectral windows (e.g. 6100–6800 Å, 8400–8800 Å) that are not affected by telluric absorptions and that contain many photospheric lines. In addition, we considered only parts of the spectra free of emission lines. The error bars in the table point to a possible 1/4 pixel uncertainty in the Fourier cross-correlation technique (Martín et al. martin99 (1999); Lane et al. lane01 (2001)). We have checked this by cross-correlating the McDonald spectra against two reference stars. The spectrum of S Ori 45 is rather noisy, and the quoted error bar comes from the dispersion observed after cross-correlating different spectral regions. The majority of our radial velocities are obtained to an accuracy of the order of 10 km s-1. After discarding the largest and smallest radial velocity values from Table 3 (i.e., r053820–0237 and S Ori 45, respectively), the mean heliocentric radial velocity of our Orionis sample is = 37.3 km s-1 with a standard deviation of 5.8 km s-1. This is comparable to the systemic radial velocity of the cluster’s central star, which has been determined to be in the range 27–38 km s-1 (Bohannan & Garmany bohannan78 (1978); Garmany et al. garmany80 (1980); Morrell & Levato morrell91 (1991)). Additionally, these velocities (except for one, see Sect. 5) are consistent with our sample belonging to the Orion OB association (Alcalá et al. alcala00 (2000)), and their distribution is significantly different from that of field stars.
4.4 H emission
We derived H pseudo-equivalent widths via direct integration of the line profile with the task splot in iraf. We note that given the cool nature of our sample, equivalent widths in the optical are generally measured relative to the observed local pseudo-continuum formed by (mainly TiO) molecular absorptions (Pavlenko pav97 (1997)). We will refer to these equivalent widths as “pseudo-equivalent widths” (pEWs).
Because of the resolution of our observations, broad H lines appear blended with other nearby spectral features. The results of our measurements, given in Table 3, have been extracted by adopting the base of the line as the continuum. The error bars were obtained after integrating over the reasonable range of possible continua. Although this procedure does not give an absolute equivalent width, i.e., measured with respect the real continuum, it is commonly used by various authors, and allows us to compare our values with those published in the literature. We note that all of our program objects show H in emission and that no significant H variability is found in any of them, except for r053833–0236 and S Ori 45. We also note that the H emission of the fast rotator 4771–1097 is not stronger than that of other similar-type cluster members.

Figure 11 shows the distribution of H pEWs as a function of spectral type. Effective temperatures are given on the basis of the temperature—spectral-type relationships by Leggett et al. (leggett96 (1996)), Jones et al. (jones95 (1995)) and Bessell (bessell91 (1991)). Masses as inferred from the 5 Myr evolutionary isochrone of Baraffe et al. (baraffe98 (1998)) are also indicated in the figure. In general, there is a trend of increasing H emission for cooler spectral classes, i.e., for lower masses. This behavior has been observed in various young clusters, like the Pleiades and Hyades (Stauffer et al. stauffer94 (1994)), IC 4665 (Prosser prosser93 (1993)), Persei (Prosser prosser94 (1994)), and Praesepe (Barrado y Navascués, Stauffer & Randich barrado98 (1998)). The relative increase of H in M-dwarfs may be (at least partially) explained by the drop of the flux continuum and the larger TiO molecular absorptions in the optical as a consequence of cooler s. We note that, on average, H for a given spectral type is slightly larger in Orionis than in other open clusters. This is very likely a direct consequence of the marked youth of Orionis.

In Fig. 11 H emission appears very strong (pEWs 20 Å) and dispersed for late spectral classes (M3.5), corresponding to masses below 0.25 at the age of Orionis. Various authors have found an apparent “turnover” in the distribution of H emission in the Pleiades (Stauffer et al. stauffer94 (1994); Hodgkin, Jameson & Steele hodgkin95 (1995)) and Persei (Zapatero Osorio et al. osorio96 (1996)). Pleiades and Per stars with spectral types later than M3.5–M4 show a lower level of emission than stars with warmer classes. The authors suggest that this turnover is due to the transition from radiative to convective cores. By inspecting D’Antona & Mazzitelli (dantona94 (1994)) pre-main sequence evolutionary models, we find that this transition takes place at masses 0.3–0.2 regardless of age. In Orionis we do not see a drop in the H emission of fully convective objects, but an enhacement. The source of such large emission clearly diminishes by the age of the Persei cluster (90 Myr, Stauffer et al. stauffer99 (1999)). However, the emission level of more massive stars remains with similar strengths.

Three stars in our sample, namely 4771–41 (K7), S Ori J054001.8–022133 (M4) and 4771–899 (K7), show profiles of H emission similar to those of classical T Tauri (CTT) stars, i.e., double peak structure and very broad lines spanning over 300 km s-1 from the line center. We illustrate in Fig. 12 the region around H for these objects. While the emission intensity is rather large in 4771–41 and S Ori J054001.8–022133 (pEWs above 45 Å), it is moderate in 4771–899.
| [O i] | [N ii] | He i | [S ii] | ||||||
| Object | MJDa | 6300 Å | 6364 Å | 6548 Å | 6583 Å | H | 6678 Å | 6716 Å | 6731 Å |
| (–51000) | (Å) | (Å) | (Å) | (Å) | (Å) | (Å) | (Å) | (Å) | |
| r053833–0236 | 138.1237 | 2.290.10 | 0.750.05 | 0.800.05 | 2.500.10 | 14.02.0 | 0.1 | 1.150.08 | 1.650.08 |
| 138.1433 | 2.000.10 | 0.570.05 | 0.880.05 | 2.540.10 | 14.12.0 | 0.150.05 | 0.850.05 | 1.490.05 | |
| J053949.3–022346 | 138.1696 | 1.800.50 | 0.2 | 1.0 | 0.350.08 | 42.06.0 | 1.180.08 | 0.15 | 0.15 |
| S Ori 45b | 168.4644 | – | 1.5 | 1.5 | 5.03.0 | 33.09.0 | 1.5 | 5.03.0 | 3.562.0 |
| J054001.8–022133 | 204.0382 | 1.270.10 | 0.330.05 | 0.260.05 | 0.330.05 | 47.09.0 | 1.050.08 | 0.15 | 0.15 |
| 204.0531 | 0.450.10 | 0.1 | 0.100.05 | 0.150.05 | 46.09.0 | 0.380.08 | 0.15 | 0.15 | |
| 4771–41 | 205.9222 | 0.960.10 | 0.1 | blended | 0.250.05 | 53.29.0 | 0.210.05 | 0.160.08 | 0.420.05 |
| 205.9366 | 1.000.10 | 0.180.08 | 0.1 | 0.300.05 | 54.09.0 | 0.420.07 | 0.1 | 0.450.05 | |
| r053840–0230 | 206.0299 | 0.15 | 0.15 | 0.420.05 | 1.100.10 | 6.50.6 | 0.1 | 0.15 | 0.310.05 |
| 206.0582 | 0.550.05 | 0.150.05 | 0.540.05 | 1.100.10 | 6.90.6 | 0.1 | 0.15 | 0.310.05 | |
| r053849–0238 | 515.2615 | 0.360.10 | 0.1 | 0.1 | 0.320.05 | 2.60.3 | 0.1 | 0.1 | 0.1 |
| J053827.4–023504 | 517.4297 | 1.250.50 | 0.3 | 0.3 | 0.3 | 21.23.0 | 0.260.08 | 0.3 | 0.3 |
a Modified Julian date at the beginning of the exposure.
b Measures over the combined spectrum. Individual H
pEWs were 20.0, 49.4 and 22.07.0 Å, respectively.
We have calculated the H luminosity () for our sample as in Herbst & Miller (herbst89 (1989)) and Hodgkin et al. (hodgkin95 (1995)). The ratio of to bolometric luminosity () is independent of the surface area and represents the fraction of the total energy output in H. To derive we have used bolometric corrections provided by Monet et al. (monet92 (1992)) and Kenyon & Hartmann (kenyon95 (1995)). The logarithmic values of are listed in Table 3; uncertainties take into account errors in photometry and in H pEWs. Figure 13 shows the distribution of log () with spectral type. For comparison purposes, we have also included the Pleiades mean values (Hodgkin et al. hodgkin95 (1995)). In the Pleiades, the ratio clearly increases to a maximum at around the M3 spectral type and then turns over. This is not observed in the Orionis cluster, where cooler objects present larger H output fluxes than the older Pleiades spectral counterparts. Discarding Orionis members with log () –3.2 dex, cluster data appear to display a flat distribution from late K to late M (i.e., no dependence on color and mass) at around log () = –3.61 dex, with a standard deviation of 0.18 dex.
4.5 Other emission lines
Our targets are pre-main sequence objects characterized by significant H emission and the presence of lithium in their atmospheres (see Sect. 4.6.2). All show properties that resemble T Tauri stars. The nominal definition of weak-lined T Tauri (WTT) stars is usually based on H emission: pEWs smaller than 10 Å for K and early-M stars (Herbig & Bell herbig88 (1988)) and smaller than 20 Å for later M-types (Martín martin98 (1998)). This is accomplished by many of our objects.
Some of our program targets display, however, other permitted (He i 6678 Å) and forbidden ([O i] 6300 Å, [N ii] 6548, 6583 Å, [S ii] 6716, 6731 Å) emission lines. We have measured their pEWs; values are given in Table 4 as a function of Julian date. We note that some contamination from terrestrial night-sky emission lines may be expected in the measurements of the faintest sources. The objects of Table 4 are plotted with different symbols in various figures of this paper, except for r053833–0236 (for this star we have used the “quiet” ORM data). The majority of the targets from Wolk (wolk96 (1996)) are, in addition, classified as strong X-ray emitters by this author. In contrast to the younger CTT stars, WTT objects are not accreting mass from disks. However, the presence of He i and [O i], [N ii], [S ii] emission lines is related to jets and outflows, which are typical of CTT stars and accretion processes (Edwards et al. edwards87 (1987); Hartigan, Edwards & Ghandour hartigan95 (1995)). These lines are generally detected in objects with strong H emissions (pEWs 10 Å, see Fig. 11). The coexistence of Orionis members with properties of WTT and CTT stars is indeed indicative of ages of a few Myr. It may also indicate that small objects are accreting for longer periods than are more massive stars (Hillenbrand et al. hillenbrand98 (1998); Haisch, Lada & Lada haisch01 (2001)), provided that their strong H emissions are due to disk accretion.
The star r053833–0236 shows strong H emission and noticeable forbidden lines of [O i], [N ii] and [S ii] in two consecutive CAHA spectra (Fig. 2, upper panel). However, its H intensity clearly decreased, and no other emission lines were present in data collected on the following night (Fig. 2, lower panel) or with the INT (Fig. 3). The sources of this episodic flarelike event are not continuous in r053833–0236, probably indicating inhomogeneus mass infall onto the star surface.
The case of the brown dwarf S Ori 45 (0.02 ) is particularly interesting and noteworthy. Albeit the detection of [N ii] and [S ii] emission lines is affected by large uncertainties because of the modest quality of the Keck spectrum, this finding is very encouraging. It suggests that substellar objects, even those with very low masses, can sustain surrounding disks from which matter is accreted. Muzerolle et al. (muzerolle00 (2000)) has recently reported on the evidence for disk accretion in a T Tauri object at the substellar limit. The presence of disks around brown dwarfs in the Trapezium cluster (1 Myr) has been proved by Muench et al. (muench01 (2001)). The emission lines observed in S Ori 45 indicate that “substellar” disks can last up to ages like those of the Orionis cluster. It is also feasible that the probable binary nature of S Ori 45 (see Sect. 5) triggers the formation of these emission lines. Nevertheless, further spectroscopic data will be very valuable to confirm the presence of forbidden emission lines in S Ori 45. The rapid H variability of this brown dwarf is also remarkable.
4.6 Li i absorption
4.6.1 Synthetic spectra
We have computed theoretical optical spectra in the wavelength range 6680–6735 Å around the Li i 6708 Å resonance doublet for gravity log = 4.0 (CGS units) and for = 4000–2600 K by running the WITA6 code described in Pavlenko (pav00 (2000)). This code is designed to opperate in the framework of classical approximations: local thermodynamic equilibrium (LTE), a plane-parallel geometry, neither sources nor drops of energy. The synthetical spectra have been obtained using the atmospheric structure of the NextGen models published in Hauschildt, Allard, & Baron (haus99 (1999)). We have adopted a microturbulent velocity value of = 2 km s-1, solar elemental abundances (Anders & Grevesse anders89 (1989)), except for lithium, and solar isotopic ratios for titanium and oxygen atoms. The ionization-dissociation equilibria were solved for about 100 different species, where constants of chemical equilibrium were taken from Tsuji (tsuji73 (1973)) and Gurvitch et al. (gurvitch79 (1979)). For the particular case of the TiO molecule, we have adopted a dissociation potential of = 7.9 eV and the molecular line list of Plez (plez98 (1998)). The atomic line parameters have been taken from the VALD database (Piskunov et al. piskunov95 (1995)), and the procedure for computing damping constants is discussed in Pavlenko et al. (pav95 (1995)) and Pavlenko (pav01 (2001)).
Synthetic spectra were originally obtained with a step of 0.03 Å in wavelength, and were later convolved with appropiate Gaussians to match a resolution of 1.68 Å, which corresponds to the majority of our data. We have produced a grid of theoretical spectra for nine different abundances of lithium [log (Li) = 1.0, 1.3, …, 3.1, 3.4, referred to the usual scale of log (H) = 12] and seven values of (4000, 3600, 2400, 3200, 3000, 2800 and 2600 K), covering the spectral sequence of our program targets. Determinations of the meteoritic lithium abundance (Nichiporuk & Moore nichiporuk74 (1974); Grevesse & Sauval grevesse98 (1998)) lie between log (Li) = 3.1 and 3.4. Extensive lithium studies performed in solar metallicity, intermediate-age clusters like the Pleiades (Soderblom et al. soderblom93 (1993)), Per (Balachandran, Lambert & Stauffer balachandran96 (1996)), Blanco 1 (Jeffries & James jeffries99 (1999)), NGC 2516 (Jeffries, James & Thurston jeffries98 (1998)), and IC 2602 and IC 2391 (Randich et al. randich01 (2001)), as well as in the Taurus star-forming region (Martín et al. martin94 (1994)) show that non-depleted stars preserve an amount of lithium compatible with a logarithmic abundance between 2.9 dex and 3.2 dex. We will adopt the mean value of log (Li) = 3.1 as the cosmic “initial” lithium abundance.

| log (Li) | ||||||
|---|---|---|---|---|---|---|
| (K) | 1.0 | 1.6 | 1.9 | 2.5 | 3.1 | 3.4 |
| 2600 | .357 | .444 | .479 | .552 | .617/.644∗ | .656/.694∗ |
| 2800 | .346 | .440 | .475 | .551 | .623/.675∗ | .669/.728∗ |
| 3000 | .312 | .404 | .441 | .522 | .596/.666∗ | .652/.741∗ |
| 3200 | .296 | .386 | .423 | .504 | .578/.639∗ | .637/.729∗ |
| 3400 | .266 | .350 | .385 | .456 | .544/.634∗ | .604/.720∗ |
| 3600 | .262 | .337 | .373 | .442 | .536/.566∗ | .609/.665∗ |
| 4000 | .189 | .281 | .319 | .403 | .507/.537∗ | .588/.620∗ |
NOTES — pEWs are given in Å. In all computations we have used log = 4.0 and solar metallicity, except for the columns labelled with an asterisk, where we have used log = 4.5.
Figure 14 depicts some of our theoretical spectra for different values of lithium abundance and surface temperature. The observed spectrum of S Ori 27 is compared to a few computations in Fig. 15. Optical spectra at these cool temperatures are clearly dominated by molecular absorptions of TiO. Only the core of the lithium line is observable, since the doublet wings are completely engulfed by TiO lines (Pavlenko pav97 (1997)). We have obtained the theoretical Li i 6708 Å pEWs via direct integration of the line profile over the spectral interval 6703.0–6710.8 Å. Many of the lithium LTE curves of growth employed in this work are presented in Table 5. Various authors (e.g., Magazzù, Rebolo & Pavlenko magazzu92 (1992); Martín et al. martin94 (1994); Pavlenko et al. pav95 (1995); Pavlenko pav98 (1998)) have shown that the differences between LTE and non-LTE calculations for cool temperatures are negligible compared to uncertainties of pEW, and gravity. Similarly, the effects of chromospheric activity on the line formation are found to be of secondary importance (Pavlenko et al. pav95 (1995); Houdebine & Doyle houdebine95 (1995); Pavlenko pav98 (1998)) and have not been included in our calculations. The Li i resonance doublet appears to have very light dependence on the temperature structure of the outer layers (see also Stuik, Bruls & Rutten stuik97 (1997)). We find a rather poor agreement between the predicted Li i pEWs of Table 5 and those provided in Pavlenko & Magazzù (pav96 (1996)). These authors’ values are considerably larger because they measured theoretical equivalent widths (note the drop of “pseudo”) relative to the computed “real” continuum, while we have determined pEWs relative to the computed pseudo-continuum formed by molecular absorptions.

4.6.2 Observed spectra
We have also obtained the Li i 6708 Å pEWs from our observed spectra. To compensate for the different resolution of the data, the integration of the line profile has always been performed over the spectral range 6703.0–6710.8 Å. Our measurements and their uncertainties are listed in Table 3. Li i is detected in absorption in all of our program objects, except for S Ori J053914.5–022834 (M3.5). It might be a cluster non-member, but its optical spectrum is the noisiest amongst the McDonald data, and even the Ca i line at 6717 Å lies barely undetected (see Fig. 9). We impose a 1 upper limit of pEW = 0.44 Å by considering the strongest possible feature in the region around the line and taking into account the S/N ratio and resolution of the spectrum.

Li i pEWs are plotted against spectral type in Fig. 16. S Ori J053914.5–022834 is excluded from the diagram. Overplotted onto the data are the theoretical pEWs for log = 4.0 and two different lithium abundances: log (Li) = 3.1 (“initial”) and log (Li) = 1.9 (about one order of magnitude of destruction). We have also included in the figure the “initial” curve of growth for a slightly larger gravity, log = 4.5. The trend of the observations is nicely reproduced by the log (Li) curves, implying that lithium is still preserved at the age of the Orionis cluster. We will discuss this issue further in section 5.2. We note the differences due to gravity in the Li i curves of growth. Although these differences are rather small (pEW 0.03 Å) for 3700 K, they become twice as large for cooler temperatures. Given the error bars of the observed Li i pEWs, we cannot easily discriminate between gravities.
The scatter of the Li i pEWs is considerable for spectral types cooler than M3.5 (Fig. 16). The problem of the lithium star-to-star dispersion occurring at 5300 K has been widely discussed in the literature (e.g., Soderblom et al. soderblom93 (1993); Pallavicini et al. pallavicini93 (1993); Russell russell96 (1996); Randich et al. randich98 (1998); Barrado y Navascués et al. 2001b ). Nevertheless, this phenomenon still remains obscure and proves challenging to explain theoretically. The dispersion could be ascribed to a variability in the Li i line as a consequence of stellar activity, different mixing processes, presence or absence of circumstellar disks, binarity, or different rotation rates from star to star. Recently, Fernández & Miranda (fernandez98 (1998)) have found that the Li i 6708 Å line in the WTT star V410 Tau varies according to its rotational period. From Figs. 11 and 16 we observe that the region of the largest lithium scatter coincides with that of the strongest H emissions. This might indicate that some hot continuum is “veiling” the optical spectra (Joy joy45 (1945); Basri & Batalha basri90 (1990); Basri, Martín & Bertout basri91 (1991)), thereby affecting our pEW measurements. We note, however, that if any “veiling” exists around H and Li i in our spectra, it has to be small compared with that of many other CTT stars, because there is no clear correlation between strong H emission and low values of Li i pEWs (except for S Ori J053951.6–022248). There are other possible explanations for the significant Li i pEW scatter, such as different gravities (objects with low Li i pEWs might have lower gravities, and therefore, younger ages), and contamination by lithium-depleted interlopers.
5 Discussion
5.1 Radial velocity: binarity
Lithium detections guarantee youth and the very likely membership of our sample in the Orionis cluster. With radial velocities we may be able to study possible multiplicity. However, the large uncertainties and having only one epoch of observations for the majority of the targets prevent us from carrying out a detailed analysis. In general, the radial velocities in Table 3 are in the interval 30–50 km s-1. Walter et al. (walter98 (1998)) obtained radial velocities of 104 pre-main sequence stars within 30′ from the Orionis star. These authors find a sharp distribution peaking at around 25 km s-1 and covering a range from 10 km s-1 up to 50 km s-1. Our measurements are in full agreement with this wide radial velocity survey. Figure 17 depicts our radial velocities against magnitudes. Neither drift nor an increasing dispersion are obvious at the faintest magnitudes, indicating that the very low mass stars and brown dwarfs of Orionis are not yet affected by internal dynamical evolution, and that these objects still share the bulk motion of the group.

Only the brown dwarf S Ori 45 clearly shows a rather discrepant radial velocity, which differs by more than 2.5 with respect to the cluster mean velocity. With a mass estimated at around 0.02 (Béjar et al. bejar99 (1999)), S Ori 45 is the smallest object in our sample. It might belong to another kinematical group of young stars, like the Taurus star-forming region or the Gould Belt. On the basis of its multi-wavelength photometry and spectroscopy, S Ori 45 is probably not a member of Taurus. The distance modulus to Taurus is 5.76 (Wichmann et al. wichmann98 (1998)), which would make S Ori 45 incredibly overluminous by 2.2 mag in the HR diagram. Guillout et al. (guillout98 (1998)) and Alcalá et al. (alcala00 (2000)) have shown that the distribution of candidate members of the Gould Belt for the particular direction towards Orion lies at 200–300 pc from the Sun and well to the southwest of the Orion A cloud. This is relatively far away from Orionis (55 pc). S Ori 45 fits the photometric and spectroscopic sequences of the Orionis cluster very nicely (Béjar et al. bejar99 (1999), bejar01a (2001)), supporting its location in the Orion complex. Furthermore, this brown dwarf displays strong H emission and lithium in its atmosphere, which is typical of ages much younger than that of the Gould Belt (30–80 Myr, Alcalá et al. alcala00 (2000); Moreno, Alfaro & Franco moreno99 (1999)), and it does not show a radial velocity consistent with membership in either Taurus or the Gould Belt. Alternatively, S Ori 45 might be a runaway object of the Orionis cluster resulting from encounters with other cluster members; it may have been dynamically ejected from the multiple system where it originated (Kroupa kroupa98 (1998); Portegies Zwart et al. zwart99 (1999); Reipurth & Clarke reipurth01 (2001); Boss boss01 (2001)), or S Ori 45 might be a brown dwarf close binary. So far none of these hypotheses can be discarded. Further radial velocity measurements are needed to assess the possible binary nature. If S Ori 45 is proved to be a spectroscopic binary, the dynamical masses of the components will be valuable for testing theoretical evolutionary tracks at very young ages and substellar masses.
From Fig. 10 we observe that r053820–0237 (M5) appears remarkably overluminous with respect to the cluster photometric sequence. In addition, its radial velocity is the largest amongst our measurements. These two properties suggest that this star is an equal mass binary.
5.2 The age of the Orionis cluster
We do not observe from Fig. 16 that our Orionis targets have undergone appreciable lithium destruction. Actually, the Li i curves of growth that neatly reproduce the observations are those computed with the “initial” lithium abundance. More massive F- and G-type stars in the Orion complex have similar lithium contents (Cunha, Smith & Lambert cunha95 (1995)). The lower envelope to the distribution of the Li i pEWs shown in Fig. 16 could be described by the log (Li) = 1.9 curve of growth, i.e., lithium depleted by about one order of magnitude. We shall discuss the likely age of the Orionis cluster on the basis of no lithium destruction, and depletions by factors of 3 (logarithmic abundance of 2.5 dex) and 10 (logarithmic abundance of 2.0 dex).

According to various evolutionary models available in the literature, very low mass stars ( 0.3 ) burn lithium very efficiently by one order of magnitude at ages older than 15 Myr (D’Antona & Mazzitelli dantona94 (1994), dantona97 (1997); Pinsonneault et al. pin90 (1990); Baraffe et al. baraffe98 (1998)). Stars with masses in the interval 0.5–0.8 do it in a shorter time scale. This is summarized in Fig. 18, which shows surface curves for a given lithium abundance as a function of age and stellar mass. The age of the Orionis cluster will be constrained by late-K and early-M stars. More massive members ( 0.9 ) need longer times to deplete some lithium, so they are not useful for our purposes.
Lithium depletion by a factor of 10 will impose a rather conservative upper limit on the age of the cluster. From Fig. 18 we infer that this upper limit is around 10 Myr (based on Baraffe et al. baraffe98 (1998) and Pinsonneault et al. pin90 (1990) models), because this is the time required by 0.6–0.8 -stars to consume their lithium from initial abundance down to log (Li) = 2.0. Models by D’Antona & Mazzitelli (dantona94 (1994), dantona97 (1997)) predict values that are twice as young, i.e., around 5 Myr. However, since no lithium depletion is apparent in any cluster member, it seems reasonable to establish shorter upper limits. If we adopt the surface curve corresponding to a factor of 3 lithium depletion, the plausible oldest age of the Orionis cluster is 8 Myr (as given by Baraffe et al. baraffe98 (1998) and Pinsonneault et al. pin90 (1990) models). We have also inspected the lithium depletion tracks provided by Proffitt & Michaud (proffitt89 (1989)) and Soderblom et al. (soderblom98 (1998)) obtaining very similar values. Our result fully agrees with the maximum age expected for the central, most massive cluster star to blow up as a supernova (Meynet et al. meynet94 (1994)). Orionis low mass stars span an age range similar to that of the early-type members, i.e., the low and high mass populations are essentially coeval. Similar upper limits are found for other associations in Orion, like the star-forming region around the Orionis star (7–8 Myr, Mathieu, Dolan & Robert mathieu01 (2001)), and Orion WTT stars (Alcalá, Chavarría-K., & Terranegra alcala98 (1998)). We could adopt as the mean cluster age the oldest isochrone for which lithium is still preserved within 0.2 dex across the entire mass range. This occurs at roughly 2–4 Myr considering all models, a result in full consistency with previous analysis of theoretical isochrone fitting to the observed photometry (Béjar et al. bejar99 (1999)).
An additional constraint to the age of the cluster comes from the ratio of CTT stars to WTT stars. Based on strong H emission and the presence of forbidden emission lines, this ratio turns out to be in the range 30–40% in Orionis. Follow-up observations of our targets (mid-infrared, radio) are, however, desirable to confirm the presence of circumstellar disks. The ratio obtained in Orionis is slightly smaller than that of younger regions, like the area around the Orion Molecular Cloud (ratio 40%, 1–3 Myr, Rebull et al. rebull00 (2000)), and considerably larger than the one of older clusters and associations, like the Sco-Cen OB association (ratio of 11%), whose population of CTT stars, WTT stars and post-T Tauri stars has been investigated by Martín (martin98 (1998)). This author defines post -T Tauri stars as young, late-type stars that are burning lithium and display moderate H emission. The average age of the whole Sco-Cen OB association is in the range 5–15 Myr, as determined by de Geus, de Zeeuw & Lub (geus89 (1989)). We do not find evidence for the existence of post-T Tauri stars in Orionis, and hence, this cluster is essentially younger than the Sco-Cen OB association.
6 Summary and conclusions
We have presented intermediate- and low-resolution optical spectra between 6100 Å and 7000 Å, covering H and Li i at 6708 Å, for a total of 25 low mass stars and 2 brown dwarfs members of the Orionis young star cluster. Spectral types have been derived and are found to be in the interval K6–M8.5, which corresponds to masses from 1.2 down to 0.02 after comparison with state-of-the-art evolutionary models (Baraffe et al. baraffe98 (1998); Chabrier et al. chabrier00 (2000)). We have measured radial velocities and pseudo-equivalent widths (pEWs) of the H and Li i atomic lines and find that all our targets show remarkable H emission and Li i 6708 Å in absorption. All radial velocities (except for one object) are consistent with membership in the Orionis cluster as well as in the Orion complex. The distribution of H and Li i pEWs against spectral type exhibits a large scatter at classes cooler than M3.5. This phenomenon occurs at the approximate mass, 0.25 , where low mass stars are expected to become fully convective. Some of our objects also show emissions of He i and forbidden emission lines of [O i], [N ii] and [S ii], probably indicating accretion from circumstellar disks. We infer that the likely rate of Orionis low mass members resembling classical T Tauri stars is in the range 30–40%, suggesting that the cluster is only a few Myr old.
We note the intriguing case of the coolest object in our sample, S Ori 45, an M8.5-type brown dwarf with a mass estimated at 0.02 (Béjar et al. bejar99 (1999)). It has a very intense, variable H emission and lithium in absorption. Our tentative detection of forbidden emission lines of [N ii] and [S ii] suggests that S Ori 45 may have a cool, surrounding disk from which it is accreting. This brown dwarf also displays a radial velocity that deviates significantly from the cluster mean velocity.
We have also presented very recent computations of Li i 6708 Å curves of growth for low gravities (log =4.0 and 4.5), cool temperatures ( = 4000–2600 K), and lithium abundances in the interval log (Li) = 1.0–3.4. The distribution of our observed Li i pEWs appears to be well reproduced by the theoretical pEWs computed for the cosmic lithium abundance of log (Li) = 3.1. This leads us to conclude that lithium has not yet been depleted in the Orionis cluster. Therefore, after comparison to various lithium depletion curves available in the literature, we impose an upper limit to the cluster age of 8 Myr, while the most likely age is in the interval 2–4 Myr.
Acknowledgements.
We are thankful to I. Baraffe and colleagues for making electronic files of their evolutionary models available to us, and to Louise Good for correcting the English language used in the manuscript. We also thank the staff at McDonald Observatory, especially David Doss, for their helpful assistance. This research has made use of the SIMBAD database, operated at CDS, Strasbourg, France. Partial financial support was provided by the Spanish DGES PB98-0531-C02-02. YP acknowledges partial financial support from Small Research Grant of American Astronomical Society. CAP acknowledges partial financial support from NSF (AST-0086321).References
- (1) Alcalá, J. M., Chavarría-K, C., & Terranegra, L. 1998, A&A, 330, 1017
- (2) Alcalá, J. M., Covino, E., Torres, G., Sterzik, M. F., Pfeiffer, M. J., & Neuhäuser, R. 2000, A&A, 353, 186
- (3) Anders, E., & Grevesse, N. 1989, Geochim. Cosmochim. Acta, 53, 197
- (4) Balachandran, S., Lambert, D. L., & Stauffer, J. R. 1996, ApJ, 470, 1243
- (5) Baraffe, I., Chabrier, G., Allard, F., & Hauschildt, P. H. 1998, A&A, 337, 403
- (6) Barrado y Navascués, D., Stauffer, J. R., & Randich, S. 1998, ApJ, 506, 347
- (7) Barrado y Navascués, D., Stauffer, J. R., Song, I., & Caillault, J.-P. 1999, ApJ, 520, L123
- (8) Barrado y Navascués, D., García López, R. J., Severino, G., & Gómez, M. T. 2001b, A&A, 371, 652
- (9) Barrado y Navascués, D., Zapatero Osorio, M. R., Béjar, V. J. S., Rebolo, R., Martín, E. L., Mundt, R., & Bailer-Jones, C. A. L. 2001a, A&A, 377, L9
- (10) Basri, G. 2000, ARA&A, 38, 485
- (11) Basri, G. S., & Batalha, C. C. 1990, ApJ, 363, 654
- (12) Basri, G., Marcy, G. W., & Graham, J. R. 1996, ApJ, 458, 600
- (13) Basri, G., Martín, E. L., & Bertout, C. 1991, A&A, 252, 625
- (14) Béjar, V. J. S., Zapatero Osorio, M. R., & Rebolo, R. 1999, ApJ, 521, 671
- (15) Béjar, V. J. S., Martín, E. L., Zapatero Osorio, M. R., et al. 2001, ApJ, 556, 830
- (16) Béjar, V. J. S. 2001, Ph. D. Thesis, Univ. La Laguna, Tenerife, Spain
- (17) Bessell, M. S. 1991, AJ, 101, 662
- (18) Blaauw, A. 1964, ARA&A, 2, 213
- (19) Blaauw, A. 1991, in Physics of Star Formation and Early Stellar Evolution, ed. C. J. Ladda & N. D. Kylafis (NATO ASI Ser. C, 342) (Dordrecht: Kluwer), 125
- (20) Bohannan, B., & Garmany, C. D. 1978, ApJ, 223, 908
- (21) Bonnell, J. T., & Bell, R. A. 1993, MNRAS, 264, 319
- (22) Boss, A. P. 2001, ApJ, 551, L167
- (23) Brown, A. G. A., de Geus, E. J., & de Zeeuw, P. T. 1994, A&A, 289, 101
- (24) Burrows, A., Marley, M., Hubbard, W. B., et al. 1997, ApJ, 491, 856
- (25) Chabrier, G., Baraffe, I., Allard, F., & Hauschildt, P. H. 2000, ApJ, 542, L119
- (26) D’Antona, F. 2000, in Very Low Mass Stars and Brown Dwarfs, Cambridge University Press, eds. R. Rebolo & M. R. Zapatero Osorio, p. 193
- (27) D’Antona, F., & Mazzitelli, I. 1994, ApJS, 90, 469
- (28) D’Antona, F., & Mazzitelli, I. 1997, Memorie della Societa Astronomia Italiana, 68, 807
- (29) Cunha, K., Smith, V. ., & Lambert, D. L. 1995, ApJ, 452, 634
- (30) de Geus, E. J., de Zeeuw, P. T., & Lub, J. 1989, A&A, 216, 44
- (31) Edwards, S., Cabrit, S., Strom, S. E., Heyer, I., & Strom, K. M. 1987, ApJ, 321, 473
- (32) Fernández, M., & Miranda, L. F. 1998, A&A, 332, 629
- (33) Garmany, C. D., Conti, P. S., & Massey, P. 1980, ApJ, 242, 1063
- (34) Grevesse, N., & Sauval, A. J. 1998, Space Sci. Rev., 85, 161
- (35) Guillout, P., Sterzik M. F., Schmitt J. H. M. M., Motch C., & Neuhäuser R. 1998, A&A, 337, 113
- (36) Gurvitch, L. V., Veitz, I. V., Medvedev, V. A. et al. 1979, Thermodynamic properties of the individual materials, Moscow–Nauka, 551
- (37) Haisch, K. E., Jr., Lada, E. A., & Lada, C. J. 2001, AJ, 121, 2065
- (38) Hartigan, P., Edwards, S., & Ghandour, L. 1995, ApJ, 452, 736
- (39) Hauschildt, P. H., Allard, F., & Baron, E. 1999, ApJ, 512, 377
- (40) Herbig, G. H., & Bell, K. R. 1988, in “Third catalog of emission-line stars of the Orion population”, Lick Observatory Bulletin No. 1111
- (41) Herbst, W., & Miller, J. R. 1989, AJ, 97, 891
- (42) Hillenbrand, L. A., Strom, S. E., Calvet, N., Merrill, K. M., Gatley, I., Makidon, R. B., Meyer, M. R., & Skrutskie, M. F. 1998, AJ, 116, 1816
- (43) Hodgkin, S. T., Jameson, R. F. & Steele, I. 1995, MNRAS, 274, 869
- (44) Houdebine, E. R., Doyle, J. G. 1995, A&A, 302, 861
- (45) Jeffries, R. D. 1995, MNRAS, 273, 559
- (46) Jeffries, R. D., James, D. J., & Thurston, M. R. 1998, MNRAS, 300, 550
- (47) Jeffries, R. D., & James, D. J. 1999, ApJ, 511, 218
- (48) Jones, H. R. A., Longmore, A. J., Allard, F., Hauschildt, P. H., Miller, S., & Tennyson, J 1995, MNRAS, 277, 767
- (49) Joy, A. H. 1945, ApJ, 102, 168
- (50) Kenyon, S. J., & Hartmann, L. 1995, ApJS, 101, 117
- (51) Kirkpatrick, J. D., Henry, T. J., & McCarthy, D. W. Jr. 1991, ApJS, 77, 417
- (52) Kroupa, P. 1998, MNRAS 298, 231
- (53) Lane, B., Zapatero Osorio, M. R., Britton, M., Martín, E. L., & Kulkarni, S. K. 2001, ApJ, submitted
- (54) Leggett, S. K., Allard, F., Berriman, G., Dahn, C. C., & Hauschildt, P. H. 1996, ApJS, 104, 117
- (55) Lucas, P. W., Roche, P. F., Allard, F., & Hauschildt, P. H. 2001, MNRAS, 326, 695
- (56) Luhman, K. L. 1999, ApJ, 525, 466
- (57) Luhman, K. L., Liebert, J., & Rieke, G. H. 1997, ApJ, 489, L165
- (58) Magazzù, A., Rebolo, R., & Pavlenko, Ya. 1992, ApJ, 392, 159
- (59) Marcy, G. W., & Benitz, K. J. 1989, ApJ, 344, 441
- (60) Marcy, G. W., & Chen, G. H. 1992, ApJ, 390, 550
- (61) Marcy, G. W, Lindsay, V., & Wilson, K. 1987, PASP, 99, 490
- (62) Martín, E. L. 1998, AJ, 115, 351
- (63) Martín, E. L., Basri, G., Gallegos, J. E., Rebolo, R., Zapatero Osorio, M. R., Béjar, V. J. S. 1998, ApJ, 499, L61
- (64) Martín, E. L., Delfosse, X., Basri, G., Goldman, B., Forveille, T., & Zapatero Osorio, M. R. 1999, AJ, 118, 2466
- (65) Martín, E. L., Rebolo, R., Magazzù, A., & Pavlenko, Ya. 1994, A&A, 282, 503
- (66) Martín, E. L., Rebolo, R., & Zapatero Osorio, M. R. 1996, Apj, 469, 706
- (67) Martín, E. L., Zapatero Osorio, M. R., Barrado y Navascués, D., Béjar, V. J. S., & Rebolo, R. 2001, ApJ, 558, L117
- (68) Massey, P. S., Kevin, B., Jeannette, V., & Anderson, E. 1988, ApJ, 328, 315
- (69) Mathieu, C., Dolan, J., & Robert, D. 2001, AJ, 121, 2124
- (70) Meynet, G., Maeder, A., Schaller, G., Schaerer, D., & Charbonnel, C. 1994, A&AS, 103, 97
- (71) Monet, D. G., Dahn, C. C., Vrba, F. J., Harris, H. C., Pier, J. R., Luginbuhl, C. B., & Ables, H. D. 1992, AJ, 103, 638
- (72) Moreno, E., Alfaro, E. J., & Franco, J. 1999, ApJ, 522, 276
- (73) Morrell, N., & Levato, H. 1991, ApJS, 75, 965
- (74) Muench, A., Alves, J., Lada, C., & Lada, E. 2001, ApJ, 558, L51
- (75) Muzerolle, J., Briceño, C., Calvet, N., Hartmann, L., Hillenbrand, L., & Gullbring, E. 2000, ApJ 545, L141
- (76) Najita, J. R., Tiede, G. P., & Carr, J. S. 2000, ApJ, 541, 977
- (77) Nichiporuk, W., & Moore, C. B. 1974, Geochim. Cosmochim. Acta, 38, 1691
- (78) Pallavicini, R., Cutispoto, G., Randich, S., & Gratton, R. 1993, A&A, 267, 145
- (79) Pavlenko, Ya. 1997, Astrophys. Space Sci., 253, 43
- (80) Pavlenko, Ya. V. 1998, Astron. Rept., 42, 501
- (81) Pavlenko, Ya. 2000, Astron. Rept., 44, 219
- (82) Pavlenko, Ya. 2001, Astron. Rept., 45, 144
- (83) Pavlenko, Ya., & Magazzù, A. 1996, A&A, 311, 961
- (84) Pavlenko, Y. V., Rebolo, R., Martín, E. L., & García López, R. J. 1995, A&A, 303, 807
- (85) Pinsonneault, M. H. 1997, ARA&A, 35, 557
- (86) Pinsonneault, M. H., Kawaler, S. D., & Demarque, P. 1990, ApJS, 74, 501
- (87) Piskunov, N. E., Kupka, F., Ryabchikova, T. A., Weiss, W. W., & Jeffery, C. S. 1995, A&AS, 112, 525
- (88) Plez, B. 1998, A&A, 337, 495
- (89) Portegies Zwart, S. F., Makino, J., McMillan, S. L. W., & Hut, P. 1999, A&A, 348, 117
- (90) Proffitt, C. R., & Michaud, G. 1989, ApJ, 346, 976
- (91) Prosser, C. F. 1993, AJ, 105, 1441
- (92) Prosser, C. F. 1994, AJ, 107, 1422
- (93) Prosser, C. F., Stauffer, J. R., & Kraft, R. P. 1991, AJ, 101, 1361
- (94) Randich, S, Martín, E. L., García López, R. J., & Pallavicini, R. 1998, A&A, 333, 591
- (95) Randich, S, Pallavicini, R., Meola, G., Stauffer, J. R. 2001, A&A, 372, 862
- (96) Rebull, L. M., Hillenbrand, L. A., Strom, S. E., Duncan, D. K., Patten, B. M., Pavlovsky, C. M., Makidon, R., & Adams, M. T. 2000, AJ, 119, 3026
- (97) Reipurth, B., & Clarke, C. 2001, AJ, 122, 432
- (98) Russell, S. C. 1996, ApJ, 463, 593
- (99) Saumon, D., Hubbard, W. B., Burrows, A., Guillot, T., Lunine, J. I., & Chabrier, G. 1996, ApJ, 460, 993
- (100) Soderblom, D. R., Jones, B. F., Balachandran, S., Stauffer, J. R., Duncan, D. K., et al. 1993b, AJ, 106, 105
- (101) Soderblom, D. R., King, J. R., Siess, L., et al. 1998, ApJ, 498, 385
- (102) Stauffer, J. R., Barrado y Navascués, D., Bouvier, J., et al. 1999, ApJ, 527, 219
- (103) Stauffer, J. R., Liebert, J., Giampapa, M., Macintosh, B., Reid, N., & Hamilton, D. 1994, AJ, 108, 160
- (104) Stauffer, J. R., Schultz, G., & Kirkpatrick, J. D. 1998, ApJ, 499, L199
- (105) Stuik, R., Bruls, J. H. M. J., & Rutten, R, J. 1997, A&A, 322, 911
- (106) Tinney, C. G., & Reid, I. N. 1998, MNRAS, 301, 1031
- (107) Tsuji, T. 1973, A&A, 23, 411
- (108) van Belle, G. T., Lane, B. F., Thompson, R. R., et al. 1999, AJ, 117, 521
- (109) Walter, F. M., Vrba, F. J., Mathieu, R. D., Brown, A., & Myers, P. C. 1994, AJ, 107, 692
- (110) Walter, F. M., Wolk, S. J., & Sherry, W. 1998, ASP Conf. Series, 154, CD–1793
- (111) Warren, W. H., & Hesser, J. E. 1978, ApJS, 36, 497
- (112) Wichmann, R., Bastian, U., Krautter, J., Jankovics, I., & Rucinski, S. M. 1998, MNRAS, 301, L39
- (113) Wolk, S. J. 1996, Ph.D. thesis, Univ. New York at Stony Brook
- (114) Zapatero Osorio, M. R., Béjar, V. J. S., Rebolo, R., Martín, E. L., & Basri, G. 1999, ApJ, 524, L115
- (115) Zapatero Osorio, M. R., Béjar, V. J. S., Martín, E. L., Rebolo, R., Barrado y Navascués, D., Bailer-Jones, C. A. L., & Mundt, R. 2000, Science, 290, 103
- (116) Zapatero Osorio, M. R., Rebolo, R., Martín, E. L., García López, R. J. 1996, A&A, 305, 519