Chapter 1 Measurements of The CMB: Current Status and Future Prospects
Abstract
The study of the Cosmic Microwave Background (CMB) is a rapidly maturing field. In remarkable advances in the past two years, experiments have begun to probe the detailed structure of the CMB angular spectrum thereby providing insight into the contents of the universe. We briefly review the BOOMERanG and DASI results with an emphasis on what the data tell us with only minimal cosmological assumptions. After a short discussion of a grand future for CMB physics, key features of the MAP satellite, now in orbit, are described. We also discuss how we anticipate MAP will advance the field beyond what we know now.
1. Introduction
This is a very exciting time for those studying the CMB. The decades of work that have gone into developing sophisticated technologies and observational techniques are beginning to pay off. A number of teams now have measured features in the CMB angular spectrum, measured its frequency spectrum, and have deduced cosmological parameters that are in rough accord with what one obtains with other methods based on entirely different physics.
The CMB is a particularly potent probe of cosmology because its characteristics may be computed to high accuracy and it may be measured to high accuracy. As long as the systematic errors associated with the experimental technique are small, the detected signal has direct cosmological import. Potentially confounding emissions from our galaxy and sources between us and the surface of last scattering are small. To first order, such “foregrounds” may be ignored at many angular scales and frequencies[31]. To the extent the foregrounds do affect a result, they may be measured and subtracted: the CMB frequency spectrum is unique.
2. Current Status
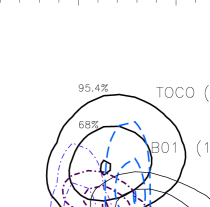
The past two years have seen wonderful measurements of the CMB anisotropy. The first peak, the position and amplitude of which were known within the CMB community in the last millennium (e.g., [2, 1, 9, 19, 17]), has now been made manifestly apparent in high signal to noise maps by the BOOMERanG [25] and and MAXIMA teams [15]. The location of this peak is a measure of the angular diameter of the sound horizon when the photons first decoupled from the primordial baryons. The sound horizon gives a physical length scale in the early universe which, from our vantage, is affected primarily by the geometry of space. In a flat geometry, its angular diameter is ; in a closed geometry, it will appear larger and in an open geometry smaller (e.g.,[10, 18, 3]). The location of the peak at , as shown in Figure 1, indicates that the geometry of the universe is parsimoniously described as flat.
This is a triumph for physical cosmology. The mechanisms leading to a peak have been known for over thirty years and detailed models of the shape predated all detections of the anisotropy. As the net matter density inferred from the distribution and velocities of galaxies is about 1/3 the critical density, there must be 2/3 the critical density in some new form of energy. This conclusion is independent, though similar, to that drawn from the supernovae results as discussed at this conference by Saul Perlmutter.
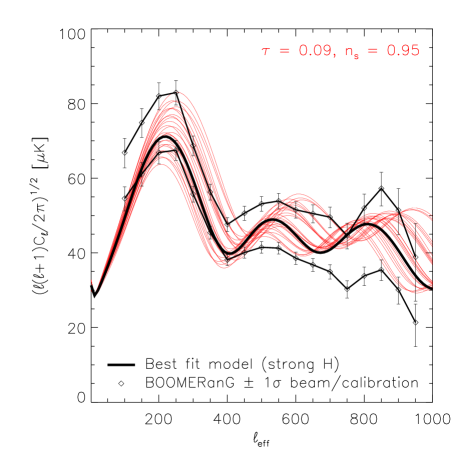

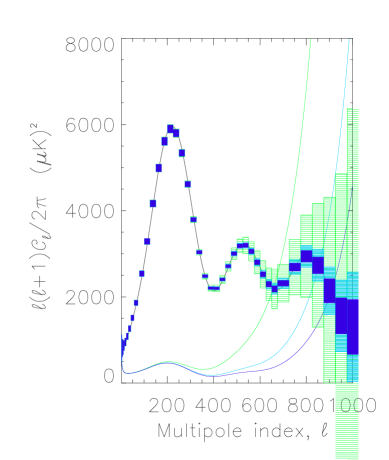
Many of the models that predicted the first peak also predict that there should be higher order peaks or “acoustic oscillations.” The second peak, at , is particularly sensitive to the baryon density. More baryons lead to more inertia in the primordial plasma, in turn leading to relatively more pronounced compression peaks ( and ) than rarefaction peaks ( and ). Though there were early indications from BOOMERanG that a second peak might be suppressed[5], a more complete analysis that included much more data[25] showed evidence of it. Independently, the DASI experiment saw the drop off from the first peak and also showed evidence for the second peak. The data from these experiments, along with calibration and beam errors, is shown in Figures 2 & 3.
The significance of the detection of the second peak depends on one’s prior assumptions and analysis method[24, 12]. A combination of all the data by Wang, Tegmark, and Zaldarriaga[33] shows clear evidence for it. A non-believer might point to the fact that for a fit to a flat line for the data, is 23/11 for BOOMERanG (correlations not published) and is 8.66/4 for DASI (correlations included). In other words, random noise would produce the same fluctuations away from the mean in 5% of the cases for BOOMERanG (from an analysis with correlations [6]) and in 7% of the cases for DASI. The third peak is on less firm footing than the second.
Extracting cosmological parameters from the CMB anisotropy started soon after its discovery[29]. The current CMB data give solutions for roughly three to four cosmological eigenparameters (e.g., [3, 13]) with similar results arising from just the BOOMERanG data or from all data combined. An analysis of all data [33] gives , , , ( 2 ) though the errors are correlated. It is worth keeping in mind that the “lambda adiabatic CDM” model is assumed for all of the parameter extraction.
3. Future Prospects
The future of CMB observations is bright. The recent successes have given us just a glimpse of what may be learned. The MAP satellite, which is discussed in greater detail below, is in orbit and taking data. The Planck satellite, with higher resolution and greater sensitivity than MAP, is planned for a 2007 launch. The frontiers after the primary anisotropy is mapped out include measuring the polarization and, through the “secondary anisotropies,” the onset of cosmic structure formation. A host of balloon and ground based experiments are planned for making the many observations for which space is not necessary and for laying the groundwork for future space missions.
If the currently most favored class of models holds, the polarization in the CMB, through it dependence on gravity waves, will give us information about fundamental fields in the s universe. It may possibly distinguish between such alternatives as inflation and a cyclic universe[30]. As the observable signal is very small, and may be masked by foreground effects, a great deal of work is left to do. Already though, researchers are discussing a dedicated satellite (CMBPOL) for measuring the polarization.
4. MAP
The next large influx of CMB data is expected to come from the MAP satellite. The primary goal of MAP is to produce a high fidelity, polarization sensitive map of the full sky. MAP was successfully launched on June 30, 2001 at 3:46:46 from Kennedy Space Flight Center. The launch by Boeing was within 183 ms of the opening window! So far, the mission has proceeded as planned and the instrument performance is nominal.
Data from MAP will stand apart from previous data sets in a number of ways:
-
•
MAP will produce all sky maps in five frequency bands with more than 45 times the sensitivity of COBE/DMR and 30 times the angular resolution.
-
•
MAP’s maps, to a good approximation, will have the same relative temperature errors on large angular scales () as on small ones (). To extract cosmological parameters, current experiments pin the spectrum at low to COBE.
-
•
Systematic uncertainties will be controlled at new levels. Calibration and/or beam uncertainty dominate all current measurements and there may be lower level systematic errors of which we are not aware. MAP will be calibrated on the CMB dipole to better than 1% and the beams will be mapped in flight multiple times. Because of the long time spent in a very stable orbit, numerous other consistency and systematic checks are possible.
-
•
True maps will be produced with small pixel-to-pixel correlations. The fidelity of a map to the underlying true flux distribution depends on the level of filtering in going from the time stream to the spatial map. To a very good approximation, MAP senses radiation from only the direction in which it is pointing and the reconstruction from the differential data to a map constrains artifacts at the sub-K level. Only the slightest filter is applied. Up to an unknown single additive constant, what you see in the map will be what’s in the sky.
4.1. Essential components of the design
MAP is a differential microwave radiometer. Table 1 gives the approximate characteristics of the instrument though the flight performance may differ slightly. The components of the MAP mission—receivers, optics, scan strategy, thermal design, and attitude control—all work together. Without any one of them, the mission would not achieve its goals. One guiding philosophy, however, is that a differential measurement with a symmetric instrument is highly desirable as discussed, for example, by Dicke (1968). The reason is that in such a system the receivers outputs are, to first order, insensitive to changes in the satellite temperature or other radiative properties.
| Band | (GHz) | Bandwidth (GHz) | # Signals | (deg) | (deg) |
|---|---|---|---|---|---|
| K | 23 | 5.3 | 2 | 0.95 | 0.75 |
| 33 | 7 | 2 | 0.7 | 0.6 | |
| Q | 41 | 8.4 | 4 | 0.45 | 0.5 |
| V | 61 | 12 | 4 | 0.3 | 0.35 |
| W | 95 | 17 | 8 |
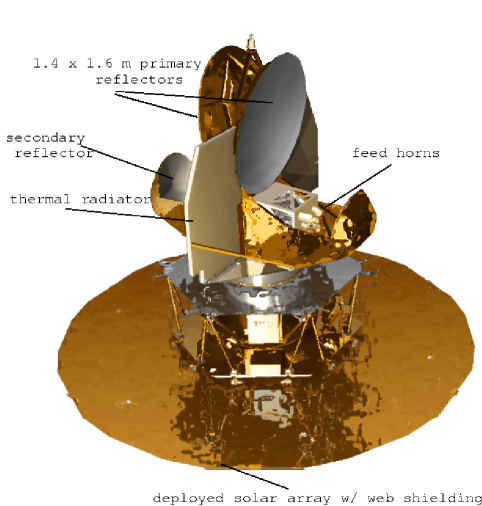
MAP uses a pair of composite back-to-back offset shaped Gregorian telescopes that focus celestial radiation onto ten pairs of back-to-back corrugated feeds. The primary optical axes of the two telescopes are separated by . Separate feeds accept radiation in five frequency bands between 20 and 100 GHz. Two orthogonal polarizations are selected by an orthomode transducer at the base of each feed.
There are two keys to making large area maps with negligible pixel-to-pixel correlations: (a) stable receivers and (b) a highly interlocking scan strategy. One measure of the stability of the receivers is its “” knee. This is the frequency at which the power spectral density (PSD) of the receiver output is double that of the value at a high frequency. Laboratory tests showed that the knee is mHz and that the PSD from 20 mHz to 3 kHz is white. The stability of the test setup limited the low frequency performance; the receivers will be more stable in space.
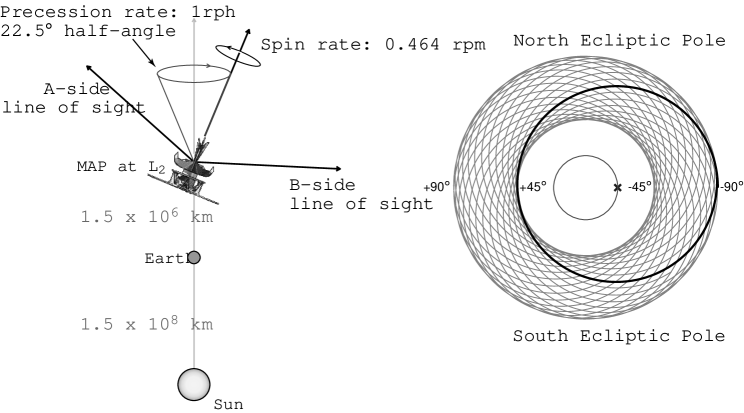
The receiver stability is due to a number of factors. Foremost is the design. MAP uses NRAO HEMT amplifiers in a correlation configuration with 2.5 kHz phase switching. Thus, the detector output is proportional to the difference in polarized flux at 2.5 kHz from two celestial pixels separated by . Second is the thermal stability. The passive thermal design combined with a constant Sun angle and an L2 orbit km from Earth results in a thermal drift rate measured in mK/hr, unattainable from any platform near Earth.
With the highly interlocking scan shown in Figure 5, the value in each pixel on the sky is referenced to that in hundreds of other pixels. As the cross-linking occurs on multiple time scales, there is a highly selective spatio-temporal filter that links the time ordered differential data to an all sky map. There are a number of proven algorithms for processing the data [34, 16] that are used by the MAP team.
4.2. Science from MAP
There is still a large gap between the models that are currently under consideration and the possible models that can describe the CMB. Despite the recent observational advances, the favored model of the late 1990’s is still the most favored model[20] though our confidence in it has been considerably enhanced. Only with a map with negligible systematic artifacts can different models be tested. The following list is a sample of the anticipated science:
-
•
CMB. MAP will measure the CMB angular spectrum to with a cosmic variance limit at , greatly extending COBE’s of . A simulation of the angular spectrum is shown in Figure 6. With the data one can test for Gaussanity, polarization, and the polarization-temperature cross-correlation. MAP can tell if there are significant isocurvature or tensor modes or if just six parameters describe the data points.
- •
-
•
ISM. Is there significant emission from spinning dust?[11], Does a K plasma describe all the free-free emission? Is dust naturally associated with free-free/Hα emission? What is the polarization of the ISM?
- •
-
•
Sources. MAP will give a full sky census of bright extragalactic sources. It will shed light on their emission properties between 30 and 100 GHz and will be sensitive to new classes of sources.
-
•
Calibration. One of the largest systematic errors in many experiments is calibration. MAP will calibrate celestial sources to the Earth’s velocity through the CMB dipole. This enables the precise comparison between multiple cosmic probes.
5. Acknowledgments
Thank you for a wonderful, stimulating, and fun conference. It was great. This work was supported by the NSF and NASA. MAP is a collaboration between NASA (Chuck Bennett [PI], Gary Hinshaw, Al Kogut, & Ed Wollack), Princeton (Chris Barnes, Norm Jarosik, Michele Limon, Lyman Page, David Spergel & David Wilkinson), Chicago (Steve Meyer), UCLA (Ned Wright), UBC (Mark Halpern), and Brown (Greg Tucker). MAP’s success is the result of a dedicated and incredibly hard working spacecraft team at NASA/GSFC led by the Project Manager Liz Citrin. More information may be found at http://map.gsfc.nasa.gov
Bibliography
- [1] Bahcall, N., Ostriker, J. P., Perlmutter, S., & Steinhardt, P. J. 1999, Science, 284, 1481 (astro-ph/9906463)
- [2] Bartlett, J. G., Blanchard, A., Douspis, M., & Le Dour, M. 1998, in Proc Evol of Large Scale Structure (Garching) (astro-ph/9810318)
- [3] Bond, J. R., Crittenden, R., Davis, R. L., Efstathiou, G., & Steinhardt, P. J. 1994, PRL, 72, 1, 13
- [4] J.R. Bond, G. Efstathiou & M. Tegmark, MNRAS, 291, L33-L41, 1997.
- [5] de Bernardis, P. et al. 2000, Nature, 404, 6781, 955
- [6] de Bernardis, P. et al. 2001, Ap. J., in press (astro-ph/0105296)
- [7] Boughn, S, Ap.J, astro-ph/9807308
- [8] Boughn, S & Crittenden, R. astro-ph/0111281
- [9] Dodelson, S. & Knox, L. 2000, Phys. Rev Lett., 84, 3523 (astro-ph/909454)
- [10] Doroshkevich, A. G., Zel’dovich, Ya. B. & Sunyaev, R. 1978, Sov. Astron. 22, 5
- [11] B. T. Draine & A. Lazarian, Review for the Sloan Summit on Microwave Foregrounds, ed. A. de Oliveira-Costa and M. Tegmark astro-ph/9902356.
- [12] Durrer, R., Novosyadlyj, B., Apunevych, S. astro-ph/0111594
- [13] Efstathiou, G., astro-ph/0109151.
- [14] Halverson,N. et al. 2001, Ap.J., in Press (astro-ph/0104489)
- [15] Hanany, S. et al. 2000, Ap.J., 545, 5 (astro-ph/0005123)
- [16] Hivon, E. et al. 2001, Submitted to Ap.J., (astro-ph/0105302)
- [17] Hu, W., Resceu Symposium 1999, astro-ph/0002520.
- [18] Kamionkowski, M. et al. 1994, astro-ph/94010003.
- [19] Knox, L. & Page, L. 2000, PRL, 85, 1366 (astro-ph/0002162)
- [20] Lange, A. et al. PRD, 63, 2001.
- [21] Lee, A. T. et al. 2001, (astro-ph/0104459)
- [22] Miller, A. et al. 1999, Ap.J., 524, L1
- [23] Miller, A. et al. 2001, Accepted for publication, ApJS, astro-ph/
- [24] Miller, C, Nichol, R., Genovese, C., & Wasserman, L., astro-ph/0112049.
- [25] Netterfield C. B. et al. 2001, (astro-ph/0104460) Ap.J., in press
- [26] H. Peiris & D. N. Spergel ApJ, 540, 605-613, 2000.
- [27] Pryke, C. et al. 2001 (astro-ph/0104490)
- [28] Refregier, A., Spergel, D. N., Herbig, T., ApJ 531, 31 (2000) astro-ph/9806349
- [29] Smoot, G. F. et al. 1992, Ap.J., 396, L1
- [30] Steinhardt, P, and Turok, N. hep-th/0111030
- [31] Tegmark, M. & Efstathiou, G. P. 1996, MNRAS, 281, 1297-1314.
- [32] Wang, L., et al. 2000, Ap.J, 530,17 astro-ph/9901388
- [33] Wang, X., Tegmark, M. & Zaldarriaga, M. (astro-ph/0105091)
- [34] Wright, E., Hinshaw, G. & Bennett, C. (astro-ph/9510102)