THE UCSD HIRES/KECK I DAMPED Ly ABUNDANCE DATABASE11affiliation: http://kingpin.ucsd.edu/hiresdla III. An Empirical Study of Photoionization in the Damped Ly System Toward GB1759+7539
Abstract
We investigate the ionization state of the damped Ly system at toward GB1759+7539 through an analysis of ionic ratios sensitive to photoionization: Ar0/S+, Fe++/Fe+, N+/N0, Al++/Al+. Approximately half of the metals arise in a mostly neutral velocity component with H I/H , based on Fe++/Fe+. In contrast, the remaining half exhibits Fe++/Fe+ indicative of a partially ionized medium with H I/H . These conclusions are supported by the observed N+/N0, Al++/Al+, and Ar0/Si+ ratios.
We assess ionization corrections for the observed column densities through photoionization models derived from the CLOUDY software package. In the neutral gas, the ionization corrections are negligible except for Ar0. However for the partially ionized gas, element abundance ratios differ from the ionic ratios by 0.1 – 0.3 dex for (Si+, S+, Ni+, Al+)/Fe+ ratios and more for (N0, Ar0)/Fe+. Independent of the shape of the photoionizing spectrum and assumptions on the number of ionization phases, these ionization corrections have minimal impact dex) on the total metallicity inferred for this damped Ly system. Measurements on the relative elemental abundances of the partially ionized gas, however, have a greater than 0.15 dex uncertainty which hides the effects of nucleosynthesis and dust depletion.
We caution the reader that this damped system is unusual for a number of reasons (e.g. a very low Ar0/S+ ratio) and we believe its ionization properties are special but not unique. Nevertheless, it clearly shows the value of examining photoionization diagnostics like Fe++/Fe+ in a larger sample of systems.
Accepted to the Astrophysical Journal: Feb 5, 2002
1 INTRODUCTION
Through echelle optical spectroscopy of the damped Ly systems – quasar absorption line systems with – one studies the chemical abundances of high redshift galaxies in a manner analogous with UV spectroscopy of the Galactic ISM. These observations yield ionic column density measurements of a series low-ions111The term low-ion refers to the dominant ionic state of a given element in an HI region. including Si+, Fe+, Ni+, Zn+, S+, and N0 (e.g. Lu et al., 1996; Prochaska & Wolfe, 1999; Molaro et al., 2000; Prochaska et al., 2001), often at a greater accuracy than measurements of the Galactic ISM. By studying these chemical abundances, one gains insight into the nucleosynthetic enrichment, dust properties, and metallicity of the damped Ly systems and thereby the high redshift protogalactic population (e.g. Prochaska & Wolfe, 2002).
To date, most damped Ly abundance studies have proceeded under the assumption that the gas has a very low ionization fraction,
| (1) |
In this case, the low-ion species represent the dominant ionization states and ionization corrections for elemental abundances are small, e.g. . There is a good theoretical basis for adopting this assumption. Prochaska & Wolfe (1996) performed a series of radiative transfer calculations and predicted for systems with . Furthermore, the authors compared observed Al++/Al+ and Si3+/Si+ ratios for the damped Ly systems against a series of photoionization models derived from the CLOUDY software package (v. 95; Ferland, 2001) and concluded it has an ionization fraction . Viegas (1995) reached similar conclusions for systems with but warned that ionization corrections could be important in systems with . More recently, Howk & Sembach (1999) argued that photoionization could imply significant corrections for some ionic species in the damped Ly systems, particularly if there were a significant local source of ionization (e.g. recent star formation). Vladilo et al. (2001) have extended this analysis further and concluded that ionization corrections are a concern for only a few of the elements (e.g. Al) observed in the damped systems. Finally, Izotov, Schaerer, & Charbonnel (2001) have presented a specific model for the damped Ly systems which suggests large ionization corrections for a number of elements. This model predicts O0/Si+ ratios, however, which are much lower than those typically observed in the damped Ly systems.
All of these studies have presented theoretical arguments which require idealized physical conditions (e.g. constant volume density, plane-parallel geometry), unknown quantities (e.g. shape, flux of the ionizing radiation), and uncertain physics (e.g. dielectric recombination rates). To overcome many of these uncertainties, one can empirically determine the ionization state of the gas by measuring adjacent ions of several elements (e.g. Fe++/Fe+). Observationally, this requires an analysis of transitions like Si III , Fe III , and N II all of which arise in the Ly forest and typically at observed wavelength Å. Unfortunately, we have not tended to acquire these observations because of the limited wavelength coverage of the HIRES spectrograph in one setting and its poor sensitivity below 4000 Å. Therefore, the large damped Ly databases provided by the Keck community (Lu et al., 1996; Prochaska & Wolfe, 1999; Pettini et al., 1999; Prochaska et al., 2001) have not directly addressed ionization corrections for the damped Ly abundances. Similarly, other studies in the literature (e.g. Fan & Tytler, 1994) have only focused on ratios like C3+/C+ which provide a less precise evaluation of photoionization.
In this paper, we examine the photoionization of a single damped Ly system through observations of a series of ions sensitive to the ionization state of the gas. We present a case study of the damped Ly system toward GB1759+7539 (, V17). This sightline has been previously analysed by Prochaska & Wolfe (1999), Outram, Chaffee, & Carswell (1999), and Prochaska et al. (2001), but none of these studies focused on the ionization state of the damped Ly system. Here, we present observations of a series of metal-line transitions which indicate this damped Ly system is partially ionized. Before proceeding, we emphasize that this damped Ly system was selected on the basis that it exhibits several transitions suggestive of photoionization (e.g. strong Si III 1206 absorption). Therefore, the system may not be representative of the damped Ly population. In fact, there are at least four peculiar characteristics of this damped system:
-
1.
It is the only known damped system with a significantly sub-solar Ar0/Si+ ratio (Prochaska & Wolfe, 2002).
-
2.
It is one of the few systems where the low-ions do not uniformly track one another in velocity space.
-
3.
It is one of the few systems where the Al III profile shows significant departures from the low-ion profiles (Wolfe & Prochaska, 2000).
-
4.
It is one of the few systems where the C II∗ profile does not closely trace the low-ion profiles (Wolfe, Prochaska, & Gawiser, 2002).
Interestingly, these characteristics are in much better general agreement with gas probed in the Galactic ISM than with other damped systems (e.g. Savage and Sembach, 1996). Irrespective of the peculiar nature of the damped system toward GB1759+7539, our analysis emphasizes the importance of observations of Si III, Fe III, N II, Ar I and other transitions for assessing the impact of photoionization on the chemical abundances one derives from low-ion transitions.
| Transition | Ref | ||
|---|---|---|---|
| SIII 1012 | 1012.5020 | 0.03550000 | 1 |
| ArI 1048 | 1048.2199 | 0.26280000 | 3 |
| ArI 1066 | 1066.6600 | 0.06747000 | 3 |
| NII 1083 | 1083.9900 | 0.10310000 | 1 |
| FeIII 1122 | 1122.5260 | 0.16200000 | 3 |
| NI 1134a | 1134.1653 | 0.01342000 | 1 |
| NI 1134b | 1134.4149 | 0.02683000 | 1 |
| NI 1134c | 1134.9803 | 0.04023000 | 1 |
| FeII 1143 | 1143.2260 | 0.01770000 | 2 |
| SiII 1193 | 1193.2897 | 0.49910000 | 1 |
| NI 1199 | 1199.5496 | 0.13280000 | 1 |
| NI 1200a | 1200.2233 | 0.08849000 | 1 |
| NI 1200b | 1200.7098 | 0.04423000 | 1 |
| SiIII 1206 | 1206.5000 | 1.66000000 | 1 |
| SII 1250 | 1250.5840 | 0.00545300 | 1 |
| CII 1334 | 1334.5323 | 0.12780000 | 1 |
| CII* 1335 | 1335.7077 | 0.11490000 | 1 |
| NiII 1370 | 1370.1310 | 0.07690000 | 5 |
| SiIV 1393 | 1393.7550 | 0.52800000 | 1 |
| SiIV 1402 | 1402.7700 | 0.26200000 | 1 |
| SiII 1526 | 1526.7066 | 0.12700000 | 9 |
| CIV 1548 | 1548.1950 | 0.19080000 | 1 |
| CIV 1550 | 1550.7700 | 0.09522000 | 1 |
| FeII 1608 | 1608.4511 | 0.05800000 | 17 |
| FeII 1611 | 1611.2005 | 0.00136000 | 16 |
| AlII 1670 | 1670.7874 | 1.88000000 | 1 |
| NiII 1709 | 1709.6042 | 0.03240000 | 7 |
| NiII 1741 | 1741.5531 | 0.04270000 | 7 |
| SiII 1808 | 1808.0130 | 0.00218000 | 11 |
| AlIII 1854 | 1854.7164 | 0.53900000 | 1 |
| ZnII 2026 | 2026.1360 | 0.48900000 | 13 |
| CrII 2066 | 2066.1610 | 0.05150000 | 13 |
2 IONIC COLUMN DENSITIES
The quasar GB1759+7539 has been observed by at least three groups (Prochaska & Wolfe, 1999; Outram, Chaffee, & Carswell, 1999; Prochaska et al., 2001) with the HIRES spectrograph (Vogt et al., 1994) on the Keck I telescope. We have combined these data to produce a spectrum with nearly continuous wavelength coverage from Å. The Prochaska & Wolfe (1999) and Prochaska et al. (2001) data sets were combined without coadding because the spectral coverage did not overlap. Therefore, the resolution of the original observations was preserved at 6 km/s and 8 km/s respectively. Finally, we included the data Outram, Chaffee, & Carswell (1999) to fill in the inter-order gaps longward of Å. In terms of the damped Ly system at (; Outram et al. 1999), the observations present measurements of transitions ranging from S III 1012 to Cr II 2066.
![[Uncaptioned image]](/html/astro-ph/0202140/assets/x2.png)
Fig1 – cont
In the following sub-sections we derive ionic column densities for the majority of transitions identified for this damped system. We have performed a line-profile fitting analysis using the VPFIT software package222http://www.ast.cam.ac.uk/rfc/vpfit.html kindly provided by R. Carswell and J. Webb. This least-squares routine minimizes a matrix of multiple component Voigt profile fits to observed line profiles. Each velocity component is described by three parameters – column density, redshift, and Doppler parameter (-value) – which can selectively be ’tied’ together from ion to ion. It should be noted that line blending can lead to significant uncertainties in the Doppler parameter and sometimes redshift of various components. On the other hand, our experience is that the column densities remain reasonably robust for unsaturated profiles. It is important to note that we include solutions for a number of heavily saturated profiles. These components are easily identified by their very large reported uncertainties and they have not been included in the analysis. Furthermore, some velocity components have large uncertainties because of a degeneracy in the solution (e.g. two velocity components which nearly overlap). We have taken care to insure that these line blending effects have not influenced our photoionization analysis. Finally, Table 1 presents the atomic data used for the metal-line transitions analysed in this paper.
| ID | aaVelocity relative to z=2.62561 | Ion | ||||||
|---|---|---|---|---|---|---|---|---|
| () | (km/s) | () | (km/s) | |||||
| 1 | 2.624329 | 4.1 | C+ | 13.747 | 0.514 | 20.41 | 12.68 | |
| Al+ | 12.677 | 0.093 | 29.23 | 5.28 | ||||
| 2 | 2.624360 | 0.3 | Si+ | 13.452 | 0.010 | 10.67 | 0.32 | |
| C+ | 14.160 | 0.237 | 11.24 | 2.78 | ||||
| Al+ | 12.428 | 0.164 | 11.48 | 1.65 | ||||
| 3 | 2.624610 | 0.4 | Si+ | 13.164 | 0.042 | 5.84 | 0.65 | |
| C+ | 14.042 | 0.082 | 6.37 | 1.68 | ||||
| Al+ | 12.008 | 0.093 | 4.94 | 0.77 | ||||
| 4 | 2.624832 | 1.3 | Si+ | 13.505 | 0.365 | 8.76 | 1.55 | |
| Fe+ | 13.453 | 0.136 | 6.32 | 1.04 | ||||
| C+ | 14.794 | 1.180 | 7.21 | 5.14 | ||||
| Al+ | 12.383 | 0.409 | 7.77 | 1.82 | ||||
| 5 | 2.625035 | 0.8 | Si+ | 14.902 | 0.050 | 12.40 | 1.69 | |
| Fe+ | 14.331 | 0.039 | 11.03 | 1.12 | ||||
| N0 | 14.401 | 0.038 | 13.72 | 1.19 | ||||
| Al+ | 13.196 | 0.119 | 14.56 | 4.87 | ||||
| Zn+ | 11.732 | 0.153 | 7.69 | 3.42 | ||||
| Ni+ | 13.149 | 0.040 | 15.48 | 1.47 | ||||
| S+ | 14.421 | 0.065 | 12.72 | 2.42 | ||||
| 6 | 2.625289 | 0.3 | Si+ | 15.129 | 0.024 | 8.75 | 0.45 | |
| Fe+ | 14.700 | 0.016 | 11.38 | 0.38 | ||||
| C+ | 16.212 | 8.658 | 11.10 | 23.77 | ||||
| N0 | 14.789 | 0.017 | 14.08 | 0.58 | ||||
| Al+ | 13.537 | 1.752 | 5.32 | 4.91 | ||||
| Zn+ | 12.221 | 0.060 | 11.06 | 2.04 | ||||
| Ni+ | 13.463 | 0.019 | 12.19 | 0.59 | ||||
| Cr+ | 12.991 | 0.094 | 13.78 | 3.83 | ||||
| S+ | 14.786 | 0.035 | 10.78 | 0.79 | ||||
| Ar0 | 13.307 | 0.028 | 9.26 | 1.04 | ||||
| 7 | 2.625612 | 0.1 | +0 | Si+ | 15.057 | 0.014 | 9.77 | 0.37 |
| C+ | 17.831 | 1.661 | 8.07 | 4.93 | ||||
| N0 | 14.627 | 0.018 | 5.93 | 0.26 | ||||
| Al+ | 14.132 | 0.622 | 9.25 | 2.24 | ||||
| S+ | 14.740 | 0.126 | 7.62 | 1.34 | ||||
| Ar0 | 13.432 | 0.021 | 8.49 | 0.67 | ||||
| 8 | 2.625644 | 0.2 | +3 | Fe+ | 14.473 | 0.010 | 8.46 | 0.21 |
| Ni+ | 13.208 | 0.019 | 7.08 | 0.51 | ||||
| Cr+ | 12.826 | 0.110 | 7.89 | 2.73 | ||||
| 9 | 2.625914 | 0.3 | +25 | Si+ | 14.216 | 0.067 | 4.29 | 0.41 |
| Fe+ | 13.602 | 0.019 | 7.80 | 0.47 | ||||
| Al+ | 12.501 | 0.157 | 3.48 | 1.15 | ||||
| Ni+ | 12.498 | 0.097 | 9.41 | 3.10 | ||||
| S+ | 14.479 | 0.540 | 23.68 | 32.07 | ||||
| 10 | 2.625975 | 8.1 | +30 | Si+ | 13.240 | 0.568 | 8.87 | 4.92 |
| C+ | 14.161 | 0.542 | 7.22 | 4.70 | ||||
| Al+ | 12.087 | 0.562 | 7.65 | 4.22 | ||||
| 11 | 2.626142 | 19.9 | +44 | Si+ | 12.784 | 0.533 | 17.23 | 9.25 |
| C+ | 13.499 | 1.107 | 14.30 | 16.84 | ||||
| Al+ | 11.560 | 0.479 | 18.75 | 12.47 |
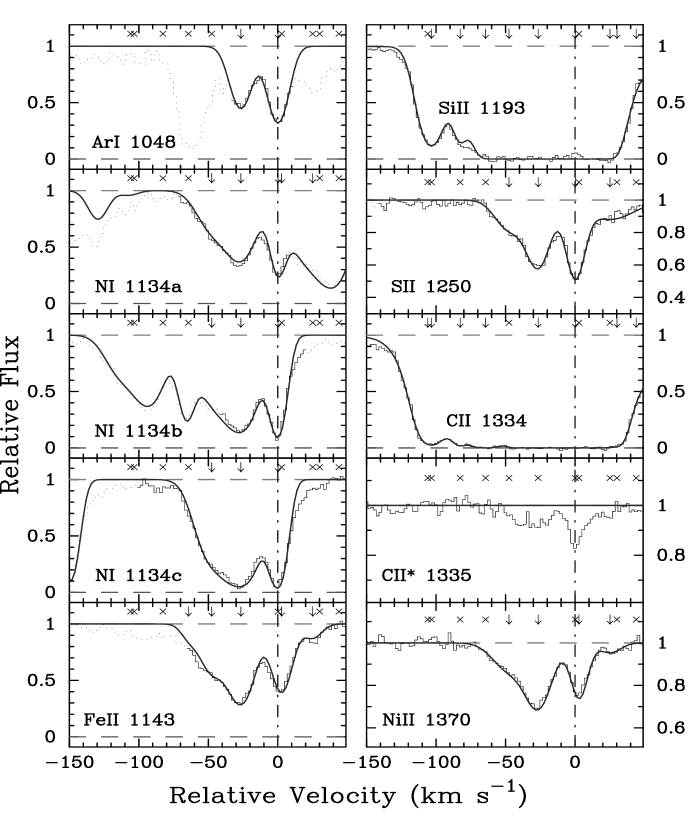
2.1 Low-Ion Profiles
Figure 1 presents velocity profiles for the most important low-ion transitions in our analysis. The velocity profiles are comprised of two main features at and km/s where corresponds to the redshift . Contrary to the majority of damped Ly systems, it is obvious from the figure that the relative abundances of these two components are not constant from ion to ion. The differences are less severe than the visual impression, but are greater than 0.1 dex (i.e. ) in several cases. This is a rare occurrence in the damped Ly systems (see Prochaska et al., 2001) and it raises the likelihood that this system is peculiar.
| ID | aaComponents 1–3,5,8,9 were fixed to have identical redshifts as components observed in the low-ion profiles. | bbVelocity relative to z=2.62561 | Ion | ccComponents with identical values were tied together in the fit. In this case, an error is listed for only one component. | ||||
|---|---|---|---|---|---|---|---|---|
| () | (km/s) | () | (km/s) | |||||
| 1 | 2.624360 | 0.0 | Al++ | 12.264 | 0.049 | 11.64 | 1.07 | |
| 2 | 2.624832 | 0.0 | Al++ | 12.128 | 0.145 | 30.72 | 13.42 | |
| N+ | 13.909 | 0.162 | 30.72 | 0.00 | ||||
| Fe++ | 13.909 | 0.137 | 30.72 | 0.00 | ||||
| 3 | 2.625035 | 0.0 | Al++ | 12.922 | 0.051 | 15.87 | 1.32 | |
| N+ | 14.047 | 0.098 | 15.87 | 0.00 | ||||
| Fe++ | 13.919 | 0.056 | 15.87 | 0.00 | ||||
| 4 | 2.625244 | 0.7 | Al++ | 13.357 | 0.022 | 16.50 | 0.85 | |
| N+ | 14.764 | 0.045 | 16.50 | 0.00 | ||||
| Fe++ | 14.066 | 0.066 | 16.50 | 0.00 | ||||
| 5 | 2.625612 | 0.0 | + 0 | Al++ | 12.629 | 0.157 | 5.27 | 0.89 |
| N+ | 13.838 | 0.232 | 5.27 | 0.00 | ||||
| 6 | 2.625697 | 6.5 | +7 | Al++ | 12.429 | 0.285 | 10.79 | 3.05 |
| N+ | 13.931 | 0.205 | 6.81 | 2.62 | ||||
| 7 | 2.625914 | 0.0 | + 25 | Al++ | 12.105 | 0.058 | 9.29 | 0.70 |
| N+ | 13.918 | 0.034 | 9.29 | 0.00 | ||||
| 8 | 2.626142 | 0.0 | + 44 | Al++ | 11.710 | 0.329 | 27.48 | 26.17 |
| N+ | 13.473 | 0.385 | 27.48 | 0.00 |
Table 2 presents the full VPFIT solution and errors for the low-ion profiles derived with the VPFIT software package. In Figure 1, most of the transitions are overplotted with the profile fit and the marks (arrows and x’s) at the top of each panel indicate all of the velocity components included in the fits. The arrows designate the components included in the analysis of a specific ion whereas the x’s identify excluded components. In general, all of the low-ions were fit with 3–7 components with tied redshifts. In contrast to our previous experience with VPFIT solutions of damped Ly profiles (e.g. Prochaska & Wolfe, 1996), we found a significant improvement in if the Doppler parameters were left untied from ion to ion. Even more unusual, however, is an observed offset in the component between the Fe II, Ni II, and Cr II transitions and the other low-ion transitions. We found a significant improvement in if we fit the former transitions with a velocity component offset by . We have experimented with our VPFIT solution and have been able to shift the centroids of the Ni II and Fe II components by closer to the other ions by introducing another velocity component at . The resulting fit, however, is not a significant improvement in over the present solution. We are concerned with this offset, in particular its implications for analyses which are extremely sensitive to such effects (e.g. Webb et al., 2001). It would have only a small impact on the current analysis, however, and we proceed under the assumption that all of the gas near has the same velocity.
2.2 Intermediate-Ion Profiles
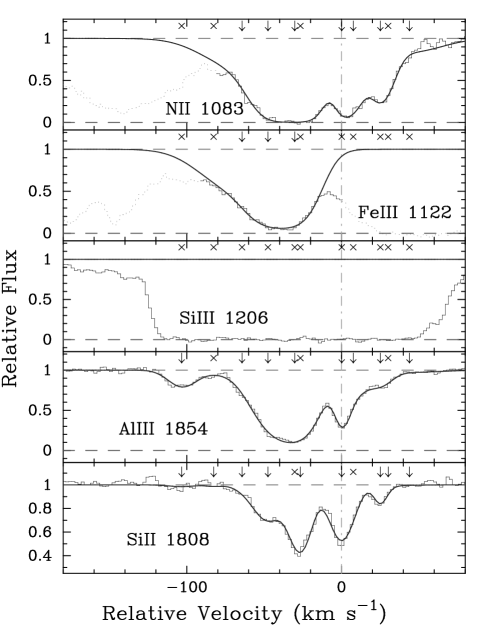
We present a series of intermediate-ion profiles in Figure 2 which includes transitions of Fe++, Si++, Al++, and N+. To facilitate comparison with the low-ion transitions, we also plot the Si II 1808 transition. With the exception of Al III 1854, the profiles are located within the Ly forest and may be contaminated by coincident Ly clouds (we are confident that the dotted regions in Figure 2 are blends). For this reason, one may consider these column density measurements as upper limits except in the case where the profiles are heavily saturated and a precise estimate is impossible. We have fit these transitions with the VPFIT software package except Si III 1206 which we found to be too saturated to include in the analysis. If this ion has a similar component structure to the other intermediate-ions, then the majority of components have . We adopt this limit throughout.
| ID | Ion | |||||||
|---|---|---|---|---|---|---|---|---|
| () | (km/s) | () | (km/s) | |||||
| 1 | 2.624064 | 6.6 | C3+ | 13.082 | 0.097 | 27.54 | 5.58 | |
| 2 | 2.624293 | 0.3 | C3+ | 13.335 | 0.036 | 5.27 | 0.50 | |
| Si3+ | 13.078 | 0.043 | 7.99 | 0.32 | ||||
| 3 | 2.624515 | 0.4 | C3+ | 13.997 | 0.020 | 8.16 | 0.48 | |
| Si3+ | 13.062 | 0.474 | 9.74 | 2.39 | ||||
| 4 | 2.624769 | 4.4 | C3+ | 13.344 | 0.287 | 9.51 | 5.39 | |
| Si3+ | 12.671 | 2.049 | 19.34 | 28.56 | ||||
| 5 | 2.624940 | 4.1 | C3+ | 13.426 | 1.201 | 6.74 | 4.60 | |
| Si3+ | 13.224 | 0.302 | 13.23 | 10.95 | ||||
| 6 | 2.625097 | 2.7 | C3+ | 14.084 | 0.462 | 11.57 | 11.85 | |
| Si3+ | 13.721 | 0.156 | 9.49 | 1.45 | ||||
| 7 | 2.625291 | 2.4 | C3+ | 13.467 | 1.444 | 6.61 | 8.54 | |
| Si3+ | 13.419 | 0.297 | 9.62 | 4.71 | ||||
| 8 | 2.625417 | 11.5 | C3+ | 13.374 | 0.943 | 7.92 | 8.63 | |
| Si3+ | 13.020 | 1.713 | 13.49 | 47.17 | ||||
| 9 | 2.625601 | 5.8 | C3+ | 13.390 | 0.296 | 10.82 | 5.37 | |
| Si3+ | 12.830 | 1.236 | 9.37 | 4.35 | ||||
| 10 | 2.625880 | 2.9 | +22 | C3+ | 13.199 | 0.117 | 9.86 | 2.53 |
| Si3+ | 12.847 | 0.199 | 12.26 | 5.16 | ||||
| 11 | 2.626038 | 2.8 | +35 | C3+ | 12.676 | 0.341 | 7.13 | 3.59 |
| Si3+ | 12.508 | 0.336 | 9.39 | 4.50 | ||||
| 12 | 2.626206 | 1.0 | +49 | C3+ | 12.603 | 0.106 | 5.01 | 1.38 |
| Si3+ | 12.341 | 0.137 | 5.09 | 1.02 | ||||
| 13 | 2.626430 | 0.5 | +68 | C3+ | 12.847 | 0.047 | 16.30 | 2.08 |
| Si3+ | 12.236 | 0.065 | 18.97 | 3.30 |
Similar to Figure 1, the marks at the top of each panel indicate the velocity centroids of the components included in the analysis with the arrows identifying the specific components included for a given ion. As described below, it is an analysis of these ions along with the low-ions which places the tightest constraints on the ionization state of the damped Ly system. Therefore, we have attempted to fit the intermediate-ions with the line-profile solution obtained from the low-ion transitions, i.e., the components are placed at the same velocities as the low-ion solution. We achieved a satisfactory fit for the intermediate-ion profiles except at and . At , the of the fit was significantly improved if the velocity component was offset by from the respective low-ion feature. We contend this offset is a physical effect and its implications on our photoionization modeling are discussed below. Meanwhile, we had to introduce a new component at to account for significant absorption at that velocity in the intermediate-ions. Table 3 presents the full solution for the intermediate-ion profiles.
| Ion | |||||||
|---|---|---|---|---|---|---|---|
| () | (km/s) | () | (km/s) | ||||
| C+ | 2.621580 | 0.6 | 12.775 | 0.035 | 4.36 | 0.96 | |
| C3+ | 2.621484 | 12.1 | 13.030 | 0.876 | 6.62 | 5.17 | |
| C3+ | 2.621580 | 3.0 | 13.455 | 0.337 | 5.45 | 1.33 | |
| Si+ | 2.621590 | 0.5 | 12.387 | 0.031 | 4.64 | 0.85 | |
| Si++ | 2.621584 | 0.3 | 12.526 | 0.028 | 5.00 | 0.44 | |
| Si3+ | 2.621570 | 0.1 | 12.956 | 0.016 | 3.54 | 0.15 | |
| Al++ | 2.621571 | 0.8 | 11.537 | 0.112 | 5.39 | 2.39 | |
| Al+ | … | … |
2.3 High-Ion Profiles
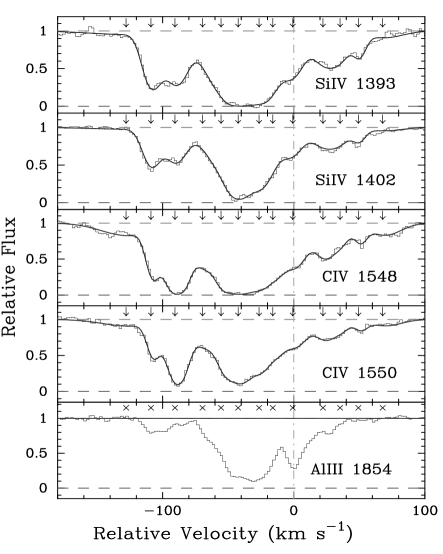
In Figure 3, we present the profiles and VPFIT solution for the high-ion Si IV and C IV transitions. We have tied the redshifts of the velocity components for the two ions but have allowed the -values to vary. We chose to fit the profiles independently of the low and intermediate-ions – even though several of the velocity components have similar redshifts – because we believe the high-ion gas is spatially separated from the low-ion gas (Wolfe & Prochaska, 2000). For comparison, we plot an intermediate-ion Al III transition to emphasize its likeness to the Si IV profiles. The parameters of the solution are listed in Table 4.
2.4 Feature
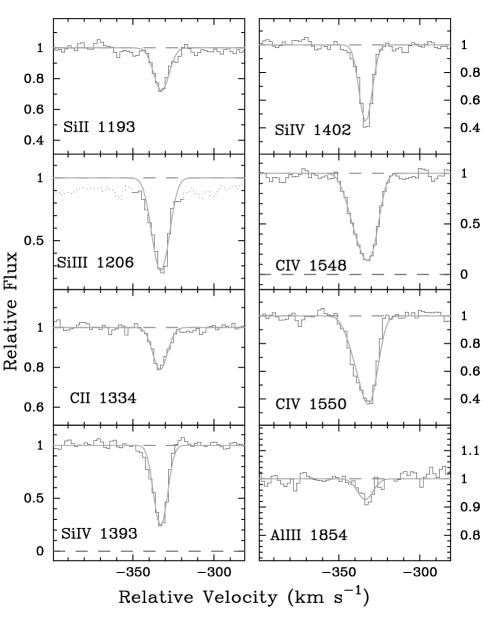
Finally, we analysed a single absorption feature at which exhibits significant Si+, Si++, Si3+, C+, C3+, and Al++ absorption (Figure 4). We fit all of the profiles with a single component except C3+ whose asymmetric shape indicates two components. The centroids of all of the ions are at nearly identical velocity including the stronger component of the C IV profiles. The column densities for these ions are very accurately measured (Table 5) and they provide a precise examination of the ionization state of this gas.
| Ratio | |||||||
| C3+/C+ | … | … | |||||
| Si3+/Si+ | |||||||
| Al++/Al+ | |||||||
| N+/N0 | … | … | … | ||||
| Fe++/Fe+ | … | … | … | ||||
| Si++/Si+ | … | … | … | … | … | ||
| Fe++/Al++ | … | … | … | ||||
| Fe++/N+ | … | … | … | ||||
| Al++/Si+ | |||||||
| Ar0/S+ | … | … | … | … | … | ||
| Si+/Fe+ | … | … | |||||
| Ni+/Fe+ | … | … | … | ||||
| S+/Fe+ | … | … | … | ||||
| Cr+/Fe+ | … | … | … | … | … | ||
| Zn+/Fe+ | … | … | … | … | … | ||
| N0/S+ | … | … | … | … | |||
| N0/Si+ | … | … | … | ||||
| Fe++/Al++ | … | … | … | ||||
| (Si+)] | |||||||
| (S+)] | … | … | … | ||||
| (Fe+)] | … | … | |||||
| (Fe++)] | … | … | … | ||||
| (Al++)] | |||||||
| (N+)] | … | … | |||||
| (N0)] | … | … | … |
2.5 Summary
Table 6 presents an observational summary of various ionic ratios and column densities for the majority of velocity components identified in the metal-line profiles. The velocities listed at the top of the Table designate 10 km/s bins where all of the gas within 5 km/s of the centroid has been summed for the ionic column densities. All ratios are logarithmic values with the square bracket notation indicating values relative to solar abundances, i.e., [X/Y] .
3 ANALYSIS OF THE GAS AT
In this section we consider various diagnostics on the ionization state of the gas at along the sightline. It is important to keep in mind that the absorption at any velocity may be the result of several components which simply overlap in velocity space. These components might each have a unique set of physical characteristics (e.g. metallicity, ionization state) and therefore comparisons of different ions at a given velocity may be open to several interpretations.
3.1 Gas at
As revealed by Figure 4, there is an absorption feature at which exhibits significant absorption for many ions: Si+, Si++, Si3+, C3+, C+, and Al++. The kinematic structure is very simple and we fit the profiles with a single component (Table 5). In fact, the feature is so simple that we are confident the majority of gas is spatially well-localized. The Si3+, C3+, and Al++ ions have significantly higher column densities than their low-ion counterparts indicating the gas is highly ionized. Significant Si3+ and C3+ column densities can arise from a number of physical processes including collisional ionization and photoionization by high energy photons. Because the observed Doppler parameters are small, we place a 2 upper limit on the temperature independently from the C+ and Si3+ measurements: K. In turn, this indicates the gas is not in collisional ionization equilibrium because K is required to produce significant amounts of C3+ (c.f. Sutherland & Dopita, 1993). This naturally suggests the ionization may be dominated by photoionization.
Although this system is well separated by velocity from the damped Ly system, its characteristics are important for several reasons. First, it is possible that this gas is representative of the gas giving rise to the C IV and Si IV profiles presented in Figure 3. Therefore, the gas responsible for the C IV and Si IV profiles makes a negligible contribution to the low-ion column densities – and presumably – of the damped Ly system. A similar conclusion has been inferred from the observed differences in the low and high-ion profiles of many other damped Ly systems (Lu et al., 1996; Wolfe & Prochaska, 2000). We also note that the Si++/Si3+ and Al++/Si3+ ratios are sufficiently small for the component that gas with its ionization characteristics cannot reproduce both the high and intermediate-ion column densities at . If we attribute the C IV and Si IV profiles at in Figure 3 to an ionized gas similar to the component, then we must introduce at least one additional phase of gas for the intermediate-ions independent of the low-ions. Therefore, if the intermediate and low-ions have distinct origins, this indicates the presence of three unique ionization phases at a similar velocity in this damped Ly system.
The absorption feature at is further important because it poses a difficult challenge to ionization models. Because of its simple kinematics and low temperature, the gas is very likely in a single component with a single set of physical conditions. Equilibrium collisional ionization models or more exotic turbulent mixing layers (e.g. Shull & Slavin, 1994) are inconsistent with the temperature of the gas. If the gas is in equilibrium, therefore, then we presume it has been photoionized.
With the range of ions and very accurate column densities observed, we expected to precisely constrain its ionization state. To this end, we performed a series of photoionization calculations using the CLOUDY software package with both an extragalactic UV background spectrum (Haardt & Madau, 1996) and a series of Kurucz (1988) O-star spectra. We varied the HI column density of the plane-parallel ’cloud’, assumed a range of metallicities, and calculated the ionization state at a range of ionization parameters,
| (2) |
where is the volume density of hydrogen, is the surface flux of ionizing photons with Ryd, and is the intensity of the incident radiation at 1 Ryd. The relation in Equation 2 approximately holds for ionizing radiation fields which steeply decline at energies greater than 1 Ryd.
To our surprise, we cannot identify any single-phase (e.g. constant density) photoionization model which can match the observed ratios of the Si ions (Si+ : Si++ : Si3+= 1 : 1.3 : 4). The principal conflict is that models which predict always require in stark contradiction with our observations. This difference between the predicted and observed ratios is generally greater than a factor of 10. It holds independently of the shape or flux of the input spectrum or any assumptions on the metallicity or H I column density. We also note that even if we allow the temperature to be a free parameter, it is impossible to reproduce the Si ionic ratios through a combination of collisional and photoionization. In conclusion, we contend the gas cannot be described by a single ionization phase in equilibrium conditions. While this could be a common occurrence in quasar absorption line systems, it is very surprising for this feature because of its simple kinematics.
Granted the failure of the single-phase equilibrium models, we also considered the prospect that the gas arises in two distinct phases with very different ionization states. If we combine a very neutral component with a highly ionized component, we approach the observed ratios of Si and C but still fail at the c.l. Furthermore, the best fitting model couples an extremely neutral gas with an extremely photoionized gas in a mixture of , which would be unlikely given the extremely simple kinematics of the observed metal-line profiles. It would take a contrived set of physical conditions to couple two-phases of gas with such extreme ionization characteristics at identical velocities and both with K. Finally, this two-phase model predicts an O I column density in conflict with our observed upper limit. To this end, we have failed to appropriately model the ionization state of this velocity component. Although it has no direct bearing on our damped Ly analysis because of its very small metal content, we interpret this failure as a stern warning for the challenges associated with making ionization corrections for highly ionized gas.
Our photoionization models do not accurately predict the ionization structure of the km/s complex; furthermore, collisional ionization equilibrium models cannot provide the required ionization since the upper limits on the kinetic temperature ( K) are too small to allow collisional production of C IV and Si IV in great quantities (Sutherland & Dopita 1993). It is possible that the gas in this component is not in ionization equilibrium. Non-equilibrium ionization can occur, for example, if the cooling time of shock-heated gas is significantly longer than the recombination time (Shapiro & Moore 1976; Sutherland & Dopita 1993). Models of time-dependent ionization of hot gas (e.g., gas hot enough to produce significant amounts of the highly-ionized species observed in this cloud) generically predict much larger ionization fractions of highly-ionized species at the temperatures appropriate for this component than do equilibrium models. Thus another potentially valid model for the km/s gas is that this component was initially shock-heated to high temperatures ( K) and has cooled relatively quickly, with its ionization state lagging its temperature. While the ionization fractions of C3+ and Si3+ can be large even to temperatures as low as K in such scenarios (Sutherland & Dopita 1993), we note that models of non-equilibrium ionization balance are dependent upon the initial conditions of the gas. Thus it is difficult to determine if the ionization structure of the km/s absorption is consistent with this non-equilibrium scenario without unfounded guesses at its initial temperature, density, and abundance.
3.2 Gas at and
The low column density gas with and exhibits significantly different ionization characteristics than the component. Although the ionic ratios (e.g. Si++/Si+, Fe++/Fe+, and N+/N0) all indicate the gas is predominantly ionized ), the C3+ and Si3+ ions comprise a much smaller fraction of the elemental column densities than the component.
The properties of the gas at may have important implications for the intermediate-ion gas observed at . Consider the possibility that the low and intermediate-ion profiles at arise from two ionization phases: (i) a neutral gas phase and (ii) a highly ionized gas with properties similar to the gas at . In this case, we can estimate the contribution of this ionized phase to the total Fe+ column density at from the following treatment. At , we measure a Fe++/Fe+ ratio of dex. If we assume the same ratio applies at , then the value at implies which is of the total value at that velocity. Therefore, an ionized gas component could comprise roughly of the low-ion absorption observed at . We develop this treatment to much greater depth in the following section.
4 ANALYSIS OF THE LOW-ION REGIONS AT
The three velocity components at , and 0 km/s comprise nearly all of the low-ion gas in this damped Ly system. In terms of the system’s chemical abundances, therefore, ionization corrections on the column densities derived from the low-ion profiles at these velocities are the most important.
4.1
It is most instructive to begin with the component where, initially, there are conflicting photoionization diagnostics. On the one hand, the Ar0/S+ ratio is significantly sub-solar which indicates the majority of Ar is ionized (e.g. Sofia & Jenkins, 1998): [Ar0/S+] dex. Therefore, one might expect photoionization is significantly affecting the chemical abundances inferred from all of the low-ion transitions. On the other hand, we have placed a strict upper limit on the Fe++ column density which limits the level of photoionization of this gas. The adopted limit of dex results from the low optical depth observed at in the Fe III 1122 profile (Figure 2). We stress that the absorption present at is probably due to an intervening Ly cloud and therefore the value is possibly lower than . Even adopting our more conservative upper limit, Fe++/Fe+ dex (Tables 2,3), this indicates the gas has a small ionization fraction. Finally, the moderate strength charge-exchange reactions between N and H which roughly couple the column densities of N0, N+, H0, and H+, allow one to crudely estimate the ionization fraction of hydrogen from the observed N+ and N0 column densities. We find N+/(N++ N0) which suggests , although N can be modestly overionized with respect to hydrogen because of its larger ionization cross-section. We contend a similar effect explains the sub-solar Ar0/S+ ratio observed for this predominantly neutral gas.
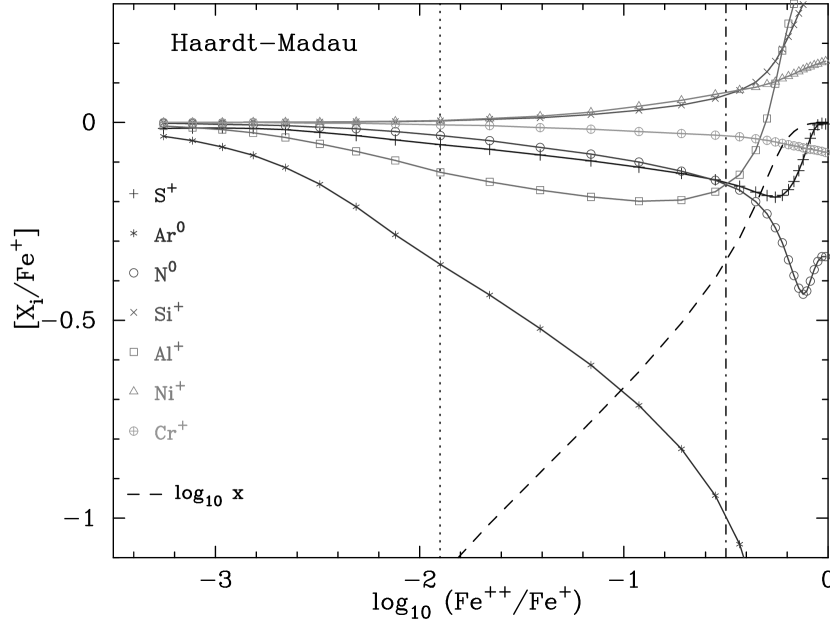
To perform a quantitative analysis of photoionization, we have performed a series of calculations with the CLOUDY software package. We caution that the accuracy of these calculations are limited by a number of uncertainties associated with the physical nature of the absorbing gas and the incident ionization field. We consider here a series of single-phase, constant density models with varying ionization parameter, the Haardt-Madau spectrum, and assume which is roughly consistent with the relative strength of the low-ions and the total H I. In Figure 5, we plot the predicted logarithmic abundance of low-ion Xi relative to Fe+ relative to the intrinsic abundance of these two elements,
| (3) |
against the Fe++/Fe+ ratio. We focus on [Xi/Fe+] instead of [Xi/H0] because we are more concerned with the effects of photoionization on interpretations of relative elemental abundances [X/Y] instead of metallicity [X/H] in the damped Ly systems. Departures of [Xi/Fe+] from zero indicate that photoionization corrections are required to calculate accurate elemental abundance ratios from the low-ion column densities independent of dust depletion. Positive (negative) [Xi/Fe+] values would imply overestimates (underestimates) of [X/Fe] from the low-ion ratios. Finally, the black dashed line plots the ionization fraction, , on the same logarithmic scale.
At Fe++/Fe+ dex, we note indicating the hydrogen gas is less than ionized. Therefore, we are confident that the gas at is predominantly neutral. In turn, we find the ionization corrections are negligible for Si+, Cr+, and Ni+ relative to Fe+ and small for S+, Al+, and N0. Only Ar0 requires a large ionization correction which brings the corrected Ar/S ratio into closer agreement with the solar abundance. This gas resembles the Cen A ISM sightline analysed by Sofia & Jenkins (1998) which shows similarly over-ionized Ar/S in a gas with a relatively large neutral hydrogen fraction. The fact that the inferred Ar/S ratio remains sub-solar even after the ionization corrections implied by Figure 5 may reflect differential depletion but more likely points to an error in our adopted ionization spectrum or possibly uncertainties in the atomic physics of Ar. In either case, the difference reflects an error in our photoionization modeling.
We emphasize that our conclusions on the ionization state of this gas are further supported by the low Al++/Al+ and Fe++/Al++ ratios. Our results are also consistent with the observed Si++/Si+, Si3+/Si+, and C3+/C+ ratios. Furthermore, we have also considered a Kurucz stellar ionizing spectrum with K and more complicated two-phase scenarios and have found no qualitative differences in these analyses. In conclusion, the gas at has a low ionization fraction and ionization corrections to the observed low-ion column densities are nearly negligible except in the case of Ar0. Therefore, the chemical abundances for this gas are accurately represented by the low-ion species.
4.2 and
Now consider the gas at and which exhibits significantly larger N+/N0, Al++/Al+, and Fe++/Fe+ ratios than the gas at . In the case of N+ and Fe++, we stress that these transitions lie in the Ly forest and may suffer from contamination by coincident Ly clouds. In the following, we proceed under the assumption that such contamination is small. Making a crude estimate of the ionization fraction from the observed N+/N0 ratio as above, we find assuming N+/N0 dex. We also note that the Al++/Si+ ratios are high relative to the majority of damped Ly systems (Vladilo et al., 2001). Altogether, we expect this gas to be more highly ionized than the component.
The greatest challenge in accurately assessing the impact of photoionization in the damped Ly systems is our ignorance of the physical nature of the gas ’clouds’ responsible for the absorption. We have no a priori knowledge of the metallicity, HI column density, volume density, or the underlying nucleosynthetic or dust depletion patterns. Furthermore, the absorption at any velocity could very well be the superposition of many clouds each with a unique set of physical characteristics but coincident velocity along the sightline. As such, there may be several clouds with different ionization states giving rise to the various metal-line profiles. Our approach is to consider simplest models first and then qualitatively assess the effects of more sophisticated scenarios.
We consider the two following cases: (1) the gas arises in a single cloud with one ionization phase; and (2) the gas arises in two gas clouds with very different degrees of ionization and possibly metallicity. Before proceeding, we present a line of circumstantial evidence that the ionization corrections to the elemental abundances might be small for this gas. In Table 6, we note that the relative abundances of the low-ion species of S, N, Ar, Si, Fe, Ni, and Cr are relatively uniform over all of these low-ion components. In all cases, the ratios vary by less than 0.2 dex from component to component. If one adopts the unfounded assumption that the gas in the entire damped Ly system shares similar elemental abundances, then one would infer that the ionization corrections are small. Conversely, significant ionization corrections might require large abundance variations, possibly from different chemical enrichment histories or dust depletion patterns.
4.2.1 Single Phase Model
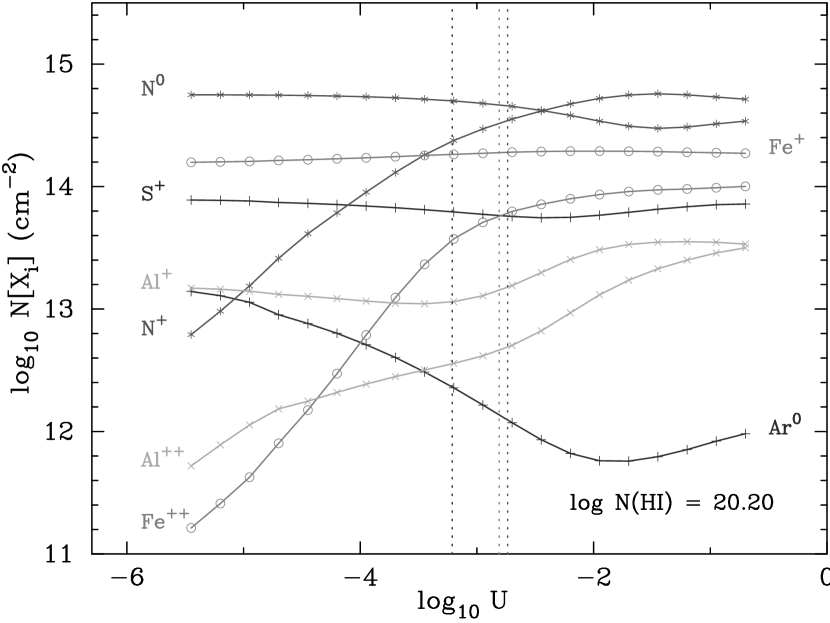
The simplest scenario is that the gas is contained within a single, constant density cloud with one ionization phase333This treatment is identical to the scenario envisioned by Prochaska & Wolfe (1996) and the model designated H1 by Vladilo et al. (2001).. If the cloud is subjected to an external radiation field, there will be a radial variation in the degree of ionization of the gas; the outer layers are highly ionized and the inner regions are primarily neutral. With the exception of Al++ (e.g. Prochaska & Wolfe, 1996), the intermediate-ions arise in the outer layers of the cloud because few high energy photons reach the inner regions. In this important respect, the single-phase model mimics the two-phase scenarios presented next. Because the N+/N0, Fe++/Fe+, and Fe++/Al++ ratios are similar for the gas at and , we consider the two components together. The uncertainties in our photoionization modeling presumably exceed any differences in the ionic column densities of the two velocity components.
Our analysis relies on simulations drawn from the CLOUDY software package. Figure 6 presents the predicted column densities for a series of ionization parameters assuming , a metallicity [Fe/H] = , and the Haardt-Madau EUVB spectrum at . The H I column density and metallicity are reasonably consistent with the total quantities inferred from the entire system. We emphasize that at , the exact value that one assumes has little impact on the single-phase scenarios. We also note that the values presented in Figure 6 are less important than the relative values of the pairs of lines with identical color and symbols (e.g. Fe++/Fe+). The vertical dashed lines indicate the observed ratios of Fe++/Fe+, N+/N0, and Ar0/S+ and the Al++/Al+ upper limit requires dex. We find that all four of these ionization diagnostics are consistent with a single ionization phase where dex. The agreement is not perfect, but it is acceptable given the number of assumptions and uncertainties in the photoionization modeling. For example, a slightly softer ionizing spectrum would help bring the predicted Ar0/S+ ratio into better agreement with the observations at dex.
The implications of the single phase model with are as follows. First, we derive an ionization fraction which indicates the gas is partially ionized. Second, if the metallicity of the velocity components at is constant, then the component may exhibit a larger value than the gas at . Third, the degree of photoionization is significant enough to imply ionization corrections to the relative abundances derived solely from the low-ion species. Referring to Figure 5, one notes that as Fe++/Fe+ dex several of the low-ion ratios [Xi/Fe+] require modest ionization corrections. With the exception of Ar0, the corrections are generally small dex) but significant compared to the typical statistical errors in these measurements. The vertical black dash-dot line in Figure 5 indicates the approximate observed Fe++/Fe+ value of dex. For this value, the low-ion ratios overestimate Si and Ni relative to Fe by dex while Al, S, and N are underestimated by dex. These ionization corrections are relatively small, but can have important implications for the relative elemental abundances of the damped Ly systems. For example, correcting the S and Si abundances gives [S/Si] and [Si/Fe] values for the component which differ by dex from the gas. One concludes, therefore, that the relative elemental abundances may differ significantly within this damped Ly system.
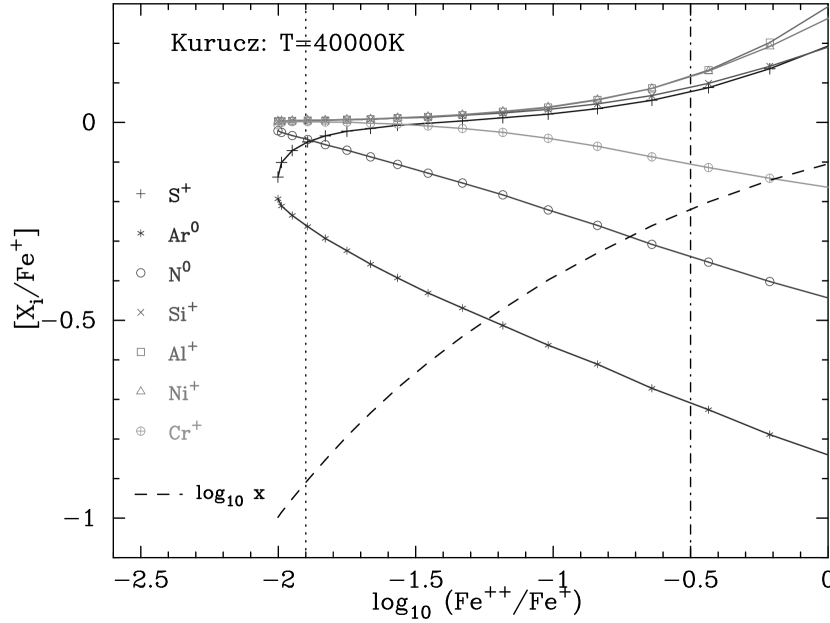
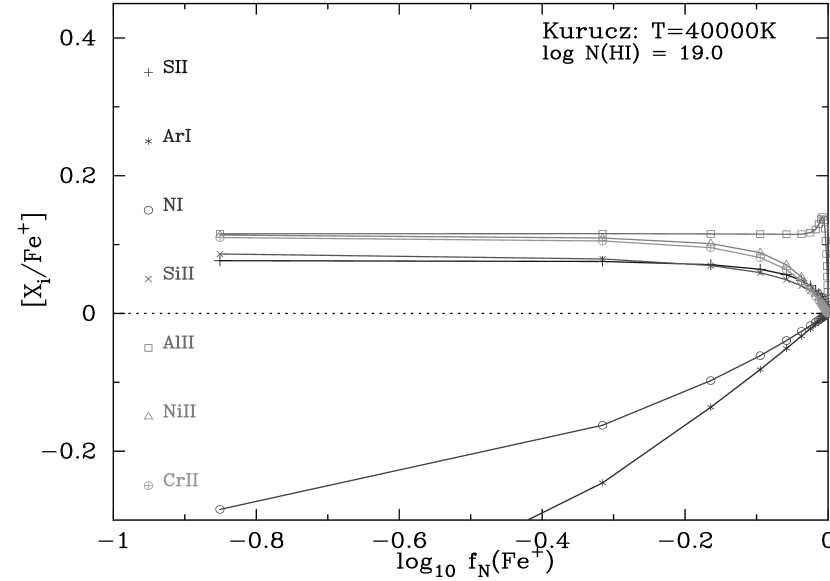
We have also considered a single-phase model with the Kurucz stellar ionizing spectrum and a range of stellar effective temperatures. These models imply similar corrections; compare against Figure 7 which plots a K model with . The principle differences are that [Cr+/Fe+] shows a large offset from solar and that [S+/Fe+] is positive at high Fe++/Fe+ values and significantly negative at Fe++/Fe+ dex. These differences arise from the softer Kurucz ionizing spectra (e.g. a significant fraction of S is in S0 at low ionization potential) and they highlight the uncertainties in our models related to the assumed input spectrum. In theory, one might observe enough ions to discriminate between various ionizing spectra but in practice one must allow for these uncertainties.
4.2.2 Two-Phase Model
Although we found that the single-phase scenario gave reasonable agreement to our set of photoionization diagnostics, we also wish to investigate the effects of a two-phase scenario. In particular, we want to determine if the two approaches yield different estimates for the ionization corrections (e.g Vladilo et al., 2001). We will show that the two models predict similar corrections but with important differences for S+ and Ar0.
Consider the following scenario where the
low and
intermediate-ions arise
in two parcels of gas with unique ionization
characteristics. As discussed in 3.2,
it is possible that gas with properties similar to the ionized gas
at is entirely responsible for
the intermediate-ions but also
contributes a significant percentage of the low-ion column densities.
In fact, we estimated an ionized component could contribute
of the Fe+ gas observed at .
This scenario resembles the physical conditions along the
sightline to HD 93521 in the Galactic ISM, where Sembach et al. (2000)
describe the impact of the Warm Ionized Medium on measuring elemental
abundances.
For the damped system, a multi-phase interpretation is
further supported by an observed offset between
the low and intermediate-ion gas at .
Examining Tables 2 and 3, one notes that
the component which best describes the low-ion gas at
is offset by from the centroids of the
Al++, N+, and Fe++ component.
The difference is relatively small and may be the result
of a systematic error, but
we consider it more likely that the gas at
is best described by at least two components with very different
ionization fractions444Unfortunately, the gas at
is not precisely
localized in velocity space and can be
well described by a single or multiple clouds..
In any case, because the offset is small
one must consider the impact of the ionized gas on the observed low-ion
column densities and we treat the two clouds as
if they had identical velocities.
This treatment is similar to the scenario introduced by Howk & Sembach (1999) and
extended by Vladilo et al. (2001).
Consider the following model which assumes the gas at is comprised of two components: (i) a very neutral component (e.g. Fe++/Fe+) and; (ii) an ionized component with identical relative gas-phase abundances that contributes all of the intermediate-ions observed at . Even though the latter component is significantly ionized, it may still exhibit significant column densities of several low-ion species, (e.g. S+, Si+, and Al+) and, therefore, impact the relative elemental abundances and metallicity derived from the low-ion transitions.
To illustrate the ionization corrections for this two-phase model we
introduce a new parameter,
,
which is the fraction of low-ion
that is attributed to the neutral gas component.
We have used CLOUDY calculations similar to those presented
in the previous section
to calculate the ionization state of the ionized component but
assuming the HI column densities are lower than .
In this case the ionized component
contributes a small fraction of the total HI column density.
We constrain the two-phase model by requiring that it yields
a Fe++/Fe+ ratio of dex. Because this constraint refers
to a relative abundance instead of the absolute Fe++ and Fe+ column
densities, our analysis is not very sensitive to the value or
metallicity assumed for the ionized component. Changing the value
for the ionized component by
0.5 dex can be important, however, and we consider the effects below.
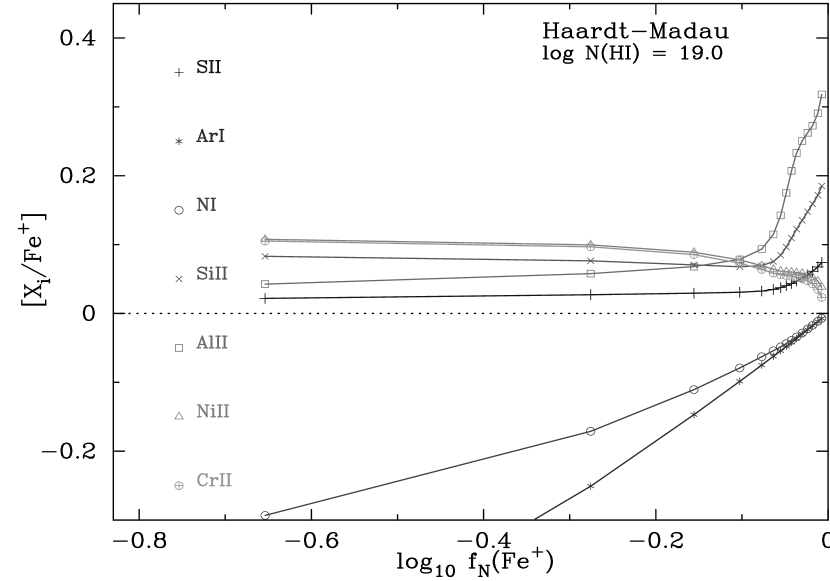
We first present results assuming in the ionized component and adopting the Haardt-Madau spectrum. Figure 8 plots the offset from the intrinsic abundances of low-ion Xi relative to Fe+, [Xi/Fe+], against the fraction of Fe+ arising in the neutral component (Fe+). As (Fe+) increases in the figure, the ionized component contributes less Fe+ and therefore there is a compensatory increase in the ionization state of this gas to match the observed Fe++/Fe+ ratio. At low (Fe+) values, one approaches the single-phase model presented in the previous sub-section. Note that one derives a qualitatively similar set of results by examining and constraining the predicted N+/N0 ratio by the observed value.
Similar to the single-phase model, the implied ionization corrections are small for the majority of elements although there are several quantitative differences. First, the offsets for [S+/Fe+] are generally small or slightly positive whereas the single-phase model predicted negative offsets approaching dex. The difference can be attributed to the difference in optical depth of the single-phase model and the ionized component in the two-phase scenario where we have assumed and respectively. In the former case, the self-shielding from H I is large enough that S is much less ionized relative to Fe. Second, the offsets for Ar0/Fe+ are small at all but the lowest (Fe+) values. This is because we have assumed Ar is entirely in atomic form in the neutral component. If this two phase model is an accurate representation of the gas, the neutral component must have a sub-solar Ar0/S+ ratio similar to the the neutral gas at . Finally, we note large corrections for Al+, Si+, and S+ at log (Fe+) which corresponds to a very large ionization parameter for the ionized component. At very high levels of ionization, the Si+, S+, and Al+ ions exhibit significantly greater abundances relative to Fe+. We doubt, however, that the gas considered here has log (Fe+) . As noted above, if the absorption at is representative of the ionization component in our two-phase model, then log (Fe+) . Furthermore, it is very unlikely (if not nonphysical) to assume that the neutral component contributes no Fe++ gas. Allowing some ionization of Fe+ to Fe++ in the neutral component drives the effective (Fe+) value even lower.
We have also performed a two-phase analysis assuming a series of Kurucz stellar spectra. Figure 9 presents the results assuming , K, [Fe/H] = , and Fe++/Fe+ dex. The results are qualitatively similar to those from the Haardt-Madau spectra (Figure 8): Si+, Al+, S+, Cr+, and Ni+ all require small negative ionization corrections relative to Fe+ while N0 and Ar0 require large positive corrections. In contrast with the Haardt-Madau results, all of the corrections converge to 0 dex as (Fe+) . For a stellar atmosphere with K, one predicts significantly larger Fe++/Fe+ ratios than the Haardt-Madau spectrum, primarily due to the softer spectral slope of the stellar flux. In fact, adopting a higher effective temperature (e.g. 50000 K) for the stellar atmosphere brings the results into better qualitative agreement with the Haardt-Madau models. Finally, we have also considered different values of in the ionized component than . In general, lower values lead to slightly larger [Xi/Fe+] values and higher values imply smaller corrections. The differences are typically smaller than 0.1 dex, however, and are therefore on the level of the uncertainties inherent to our photoionization modeling.
To summarize, the two-phase scenario implies small but important corrections to the low-ion ratios. We favor this model over the single phase model because of the likelihood that the intermediate and low-ion components at are not exactly aligned. Furthermore, we have identified ionized gas near the damped Ly system (at ) which exhibit properties consistent with the ionized component of our two-phase model. Interestingly, the ionization corrections of the two-phase scenario lead to relative abundances which are less conflicting with the gas. The challenge of the two phase scenario in comparison with the single phase model, however, is that it introduces an additional gas component with another set of uncertainties related to HI column density, metallicity, geometry, etc. These uncertainties prohibit one from determining the (Fe+) value and thereby precise ionization corrections.
5 DISCUSSION
In the previous sections, we carefully considered the ionization state of the gas comprising the damped Ly system at toward GB1759+7539. Qualitatively, we demonstrated that the gas in one major velocity component is primarily neutral ) while the remaining gas is partially ionized ). In both cases, significant ionization corrections for Ar0 are required. Furthermore, several elements in the ionized component – notably N, S – require small but important ionization corrections to infer accurate elemental abundances from the low-ion column densities. These corrections have important implications for our measurements of the metallicity of this damped system and our interpretations of the nucleosynthetic enrichment and dust depletion inferred from relative chemical abundances. Before proceeding, we wish to emphasize that this system exhibits a number of characteristics (e.g. variations among the low-ion profiles) which separate it from the majority of damped systems. Therefore, one must be careful not to generalize the ionization properties of this system to the entire sample of damped systems. At the same time, it is worth noting that the H I column density of this system is significantly greater than the damped Ly threshold of and would not have been expected to be partially ionized on the basis of its H I optical depth.
| Model | Fe/H | Si/H | S /H |
|---|---|---|---|
| HM: No IC | |||
| HM: One-Phase | |||
| HM: Two-Phase, (Fe+)=–0.1 | |||
| HM: Two-Phase, (Fe+)=–0.5 | |||
| KZ: One-Phase | |||
| KZ: Two-Phase, (Fe+)=–0.1 | |||
| KZ: Two-Phase, (Fe+)=–0.5 |
Consider first the impact of photoionization on the metallicity measurements of this damped Ly system. We focus on the metallicity of the neutral hydrogen gas because estimating the metallicity of all hydrogen gas (ionized + neutral) would require assumptions on the distribution of HI as a function of velocity. In addition, the metallicity of the neutral component is more readily compared against theoretical models. In Table 7, we report a series of metallicity measurements for S, Si, and Fe assuming a variety of photoionization scenarios for the partially ionized gas555Note that the effects of photoionization on the metallicity of this system are tempered by the fact that only of the gas requires ionization corrections.: (i) no corrections; (ii) a single-phase cloud with the HM spectrum; (iii,iv) a two-phase scenario using the HM spectrum with two different assumptions on the level of ionization in the ionized component; (v-vii) single and two-phase scenarios adopting the Kurucz spectrum with K. In the two-phase scenarios, the results are modestly sensitive to the value assumed for the ionized component. For this discussion, we assume .
The results presented in Table 7 indicate systematic offsets in the metallicity of this damped system when one adopts ionization corrections. In general, however, the photoionization corrections imply a small, statistically insignificant decrease in the [X/H] values. The dex corrections are on the same order as the 0.1 dex uncertainty in the value. Therefore, even in the unlikely event that all of the damped Ly systems require ionization corrections which are this large, it will have a relatively minor impact on the chemical evolution history currently resolved by the damped Ly systems (e.g. Prochaska & Wolfe, 2000). The one possible exception, however, is the chemical enrichment history derived from Zn+ whose photoionization balance is very poorly determined (Howk & Sembach, 1999).


In contrast to the metallicity measurements where factors of 0.1 to 0.2 dex are generally unimportant, photoionization corrections can significantly influence our interpretations of the relative elemental abundances of the damped Ly systems. A correction to Si+/Fe+of 0.2 dex, for example, would imply a very different dust-to-gas ratio and/or nucleosynthetic enrichment history (e.g. Prochaska & Wolfe, 2002). This point is well illustrated in Figures 10 and 11 which present the relative abundance [X/Fe] of the three main velocity components in this damped system for the Haardt-Madau and Kurucz input spectrum respectively. In each figure we consider (a) no ionization corrections; (b) a single-phase scenario; (c) a two-phase scenario with (Fe+) ; and (d) a two-phase scenario with (Fe+) dex.
Examining Figures 10 and 11 we find that the ratios of S/Fe and Si/Fe vary by dex among the various ionization models. Therefore, it is very difficult to assess the elemental abundances ratios of the ionized gas in this damped Ly system. We are concerned that any damped system which is ionized to a similar degree will prove just as challenging. These uncertainties aside, we believe this system exhibits variations in its relative abundances independent of photoionization. These may be due to differential depletion and/or varying nucleosynthetic enrichment patterns. In either case, this is one of the few examples of a damped Ly system where the abundances ratios are not uniform within statistical error.
The results of this paper highlight the importance of examining photoionization diagnostics in a larger sample of damped Ly systems. Although Al++/Si+ may provide a rough assessment of ionization (Vladilo et al., 2001), a more precise analysis can be performed if one acquires observations of adjacent ions like Fe+, Fe++ and N0, N+. Of course, the intermediate-ions require observations with coverage deep within the Ly forest. While it may be important to consider a full photoionization analysis of the kind presented here for each damped Ly system, we believe the following photoionization diagnostics (summarized in Table 8) can provide a ’first-look’ analysis of the ionization state. In all cases, our conclusions are derived from the extensive set of CLOUDY photoionization models that we have described throughout the paper.
-
•
The Ar0/(Si+, S+) ratio is an excellent diagnostic for identifying systems with low ionization factors, . Specifically, a generic feature of photoionization models is that an observed value of [Ar0/(Si+, S+)] dex requires . For the 7 systems with Ar/Si measurements or limits (Molaro et al., 2001; Prochaska & Wolfe, 2002), they all suggest except GB1759+7539. It is also important to emphasize that a low Ar0/(Si+,S+) ratio does not require given its large reionization cross-section (Sofia & Jenkins, 1998). In fact, we have argued that the gas at in the GB1759+7539 damped system has even though it exhibits a significantly sub-solar Ar0/Si+ ratio. Therefore, this diagnostic is only valuable for ruling out photoionization effects in a given damped system. Finally, we should note that the Ar0/(Si+,S+) ratio could be affected by nucleosynthesis and/or dust depletion. On the other hand, Ar/S is solar in systems with a wide range of metallicity in the local universe (Henry & Worthey, 1999) and the majority of damped systems exhibit [S/Si] indicating differential depletion will not modify the Ar, S, or Si abundances.
-
•
Unlike the Ar0/(Si+, S+) ratio, a determination of the Fe++/Fe+ ratio can establish whether a given damped system is predominantly neutral or ionized. We find in systems where Fe++/Fe+ dex, and similarly, a system with Fe++/Fe+ dex will have . A further advantage of this diagnostic is that the Fe++/Fe+ ratio is independent of nucleosynthesis or dust depletion. In short, an accurate measurement of Fe++ via the Fe III 1122 transition is an extremely valuable probe of the ionization state of any quasar absorption line system.
-
•
The N+/N0 ratio places similar constraints on as the Fe++/Fe+ diagnostic. We find in systems showing N+/N0 dex and in systems where N+/N0 dex.
| Ratio | Comment | ||
|---|---|---|---|
| Ar0/(Si+,S+) | N/A | Sensitive to dust, nucleo | |
| Fe++/Fe+ | Ly forest | ||
| N+/N0 | Ly forest |
In passing, we wish to comment on the implications of photoionization for our kinematic modeling of the damped Ly systems (e.g. Prochaska & Wolfe, 1997). To assess the kinematic characteristics of an individual damped Ly system we choose a single, high S/N low-ion profile as representative of the neutral gas for the entire system. This approach was motivated by the fact that the low-ion profiles track one another very closely (e.g. Prochaska & Wolfe, 1996). In the case of the damped Ly system studied here, we have found significant variations from low-ion to low-ion even prior to photoionization corrections. This variation will have a very small impact on the measured velocity width (; c.f. Prochaska & Wolfe 1997) of the damped Ly system, but the variations could impact the various shape parameters implemented in our analysis. Although this causes us some concern, we emphasize that this system is unusual for exhibiting a significant variation among the low-ion profiles. In a future paper, we will demonstrate the excellent chemical and ionization uniformity observed in the large majority of damped Ly systems (Prochaska et al., 2002).
We also wish to reflect on the impact of photoionization regarding the relationship between the observed C II∗ profile and star formation (see Wolfe et al. 2002 for a more complete discussion). As noted in the introduction, the C II∗ profile of the GB1759+75 damped system does not closely track the other low-ion profiles (Figure 1). Specifically, the C II∗ profile exhibits much greater optical depth at than . We believe the gas at has properties similar to the Cold Neutral Medium of the Galactic ISM (e.g. Savage and Sembach, 1996). In contrast, if the gas at has physical properties similar to the Warm Neutral Medium or Warm Ionized Medium of the Galactic ISM, then we would predict a low C II∗ optical depth relative to the other low-ions, as observed. Therefore, we believe the components at and represent two distinct phases of gas. The net effect is that it is difficult to assess the star formation rate within this damped Ly system from its measured C II∗ column density.
Finally, we wish to outline other avenues for investigating the ionization state of the damped Ly systems. One might gain important insight into the properties of ionized gas associated with damped systems by performing a comprehensive analysis of the quasar absorption line systems with (e.g. Prochaska & Wolfe, 1999; O’Meara et al., 2001). These ’sub-DLAs’ may show a wide range of ionization states and would provide an excellent test of the modeling implemented throughout this paper. Furthermore, they are far more numerous than the damped systems and one may design specific observational experiments to focus on their ionization states (e.g. pre-select systems where Si++, N+ etc. readily observed). Another more efficient approach would be to examine lower redshift systems where the Ly forest is a far less compromising effect. The challenge here remains identifying enough systems toward very bright quasars; a challenge which will be alleviated in part with the introduction of COS on the Hubble Space Telescope.
References
- Bergeson & Lawler (1993) Bergeson, S.D. & Lawler, J.E. 1993, ApJ, 408, 382
- Bergeson & Lawler (1993b) Bergeson, S.D. & Lawler, J.E. 1993b, ApJ, 414, L137
- Bergeson et al. (1996) Bergeson, S.D., Mullman, K.L., Wickliffe, M.W., Lawler, J.E., Litzen, U., and Johansson, S. 1996, ApJ464, 1044
- Bergeson, Mullman, & Lawler (1996b) Bergeson, S.D., Mullman, K.L., & Lawler, J.E., 1996, ApJ464, 1050
- Fan & Tytler (1994) Fan, X.-M. & Tytler, D. 1994, ApJS, 94, 17
- Fedchak & Lawler (1999) Fedchak, J. A. & Lawler, J. E. 1999, ApJ, 523, 734
- Fedchak, Wiese, & Lawler (2000) Fedchak, J. A., Wiese, L. M., & Lawler, J. E. 2000, ApJ, 538, 773
- Ferland (2001) Ferland, G. J. 2001, PASP, 113, 41
- Haardt & Madau (1996) Haardt, F. & Madau, P. 1996, ApJ, 461, 20
- Henry & Worthey (1999) Henry, R.B.C. & Worthey, G. 1999, PASP, 111, 919
- Howk & Sembach (1999) Howk, J.C. & Sembach, K.R. 1999, ApJ, 523, L141
- Howk et al. (2000) Howk, J.C., Sembach, K.R., Roth, K.C., & Kruk, J.W. 2000, ApJ, 544, 867
- Izotov, Schaerer, & Charbonnel (2001) Izotov, Y.I., Schaerer, D., & Charbonnel, C. 2001, ApJ, 549, 878
- Kurucz (1988) Kurucz, R.L. 1988, Trans. IAU, XXB, ed. M. McNally, (Dordrecht: Kluwer), p. 168-172
- Lu et al. (1996) Lu, L., Sargent, W.L.W., Barlow, T.A., Churchill, C.W., & Vogt, S. 1996, ApJS, 107, 475
- Molaro et al. (2000) Molaro, P., Bonifacio, P., Centurin, M., D’Odorico, S., Vladilo, G., Santin, P., & Di Marcantonio, P. 2000, ApJ, 541, 54
- Molaro et al. (2001) Molaro, P., Levshakov, S.A., D’Odorico, S., Bonifacio, P., & Centuríon, M. 2001, ApJ, 549, 90
- Morton (1991) Morton, D.C. 1991, ApJS, 77, 119
- Morton (2002) Morton, D.C. 2002, in preparation
- O’Meara et al. (2001) O’Meara, J.M., Tytler, D., Kirkman, D., Nao, S., Prochaska, J.X., Lubin, D., & Wolfe, A.M. 2001, ApJ, 522, 718
- Outram, Chaffee, & Carswell (1999) Outram, P.J., Chaffee, F.H., & Carswell, R.F. 1999, MNRAS, 310, 289
- Pettini et al. (1994) Pettini, M., Smith, L. J., Hunstead, R. W., and King, D. L. 1994, ApJ, 426, 79
- Pettini et al. (1999) Pettini, M., Ellison, S.L., Steidel, C.C., & Bowen, D.V. 1999, ApJ, 510, 576
- Prochaska & Wolfe (1996) Prochaska, J. X. & Wolfe, A. M. 1996, ApJ, 470, 403
- Prochaska & Wolfe (1997) Prochaska, J. X. & Wolfe, A. M. 1997, ApJ, 486, 73
- Prochaska & Wolfe (1999) Prochaska, J. X. & Wolfe, A. M. 1999, ApJS, 121, 369
- Prochaska & Wolfe (2000) Prochaska, J.X. & Wolfe, A.M., 2000, ApJ, 533, L5
- Prochaska et al. (2001) Prochaska, J.X., Wolfe, A.M., Tytler, D., Burles, S.M., Cooke, J., Gawiser, E., Kirkman, D., O’Meara, J.M., & Storrie-Lombardi, L. 2001, ApJS, 137, 21
- Prochaska & Wolfe (2002) Prochaska, J.X. & Wolfe, A.M., 2002, ApJ, in press
- Prochaska et al. (2002) Prochaska, J.X. et al. 2002, in preparation
- Savage and Sembach (1996) Savage, B. D. and Sembach, K. R. 1996, ARA&A, 34, 279
- Schectman, Povolny, & Curtis (1998) Schectman, R.M., Povolny, H.S., & Curtis, L.J. 1998, ApJ, 504, 921
- Sembach et al. (2000) Sembach, K.R., Howk, J.C., Ryans, R.S.I., & Keenan, F.P. 2000, ApJ, 528, 310
- Shapiro & Moore (1976) Shapiro, P.R., & Moore, R.T. 1976, ApJ, 207, 460
- Sofia & Jenkins (1998) Sofia, U.J. & Jenkins, E.B. 1998, ApJ, 499, 951
- Shull & Slavin (1994) Shull, J.M., & Slavin, J.D. 1994, ApJ, 427, 784
- Sutherland & Dopita (1993) Sutherland, R.S. & Dopita, M.A. 1993, ApJS, 88, 253
- Viegas (1995) Viegas, S.M. 1995, MNRAS, 276, 268
- Vladilo et al. (2001) Vladilo, G., Centurin, M., Bonifacio, P., & Howk, J.C. 2001, ApJ, 557, 1007
- Vogt et al. (1994) Vogt, S.S., Allen, S.L., Bigelow, B.C., Bresee, L., Brown, B., et al. 1994, SPIE, 2198, 362
- Webb et al. (2001) Webb, J.K., Murphy, M.T., Flambaum, V.V., Dzuba, V.A., Barrow, J.D., Churchill, C.W., Prochaska, J.X., & Wolfe, A.M. 2001 Phys. Rev. Lett. 87, in press
- Wolfe & Prochaska (2000) Wolfe, A. M. & Prochaska, J.X. 2000, ApJ, 545, 591
- Wolfe, Prochaska, & Gawiser (2002) Wolfe, A. M., Prochaska, J.X., & Gawiser, E. 2002, in preparation