Globular Cluster Distances and Physical Properties from Double- and Fundamental Mode Variables
Abstract
We briefly describe a method of obtaining relative intrinsic stellar parameters, such as absolute magnitudes and colors from the light curves of fundamental mode RR Lyrae (RRab) stars. Absolute stellar parameters of double-mode variables (Cepheids and RR Lyrae stars) can be computed from their periods and intrinsic colors combined with stellar atmosphere and pulsation models. By using these two methods, one can determine, e.g., the distance of any RRab star, assuming that accurate multicolor photometry is available. By applying this and a related method for computing metallicity, we derive distance, reddening and metallicity distribution for the RRab stars of Cen.
Konkoly Observatory, P.O. Box 67, H-1525, Hungary
1. Introduction
RR Lyrae stars have played a very important role in astrophysics since the end of the nineteenth century, when the first photographic plates on the variables of globular cluster M5 were taken by Bailey (1899). One of their best known (and perhaps most frequently utilized) properties is the relatively small spread in their average luminosities. The range of this quantity is about mag among cluster variables and remains under mag even if we include more metal rich RR Lyrae stars, such as the ones in the Galactic field. In the last decade or so many studies have been made to measure/compute RR Lyrae luminosities more accurately. Although it is true that metallicity plays a significant role in determining the luminosity, evolutionary effects should also be considered together with other unknown parameters, most often referred to as ‘second parameters’.
Several years ago we started a program aimed at deriving relative intrinsic parameters of fundamental mode (RRab) variables from their light curves. This idea has been pursued at various levels from the very early dates of pulsating star studies. The best known among them are the various period–luminosity and period–luminosity–color relations. In a more advanced approach, amplitudes have also been involved (e.g., Sandage 1981). We extended these studies to include quantities representing the shape of the light curve. It turned out that some of these quantities (i.e., certain basic Fourier parameters) significantly improve the regressions to some intrinsic parameters, such as the absolute magnitude and iron abundance [Fe/H]. Our approach is completely empirical and yields accurate estimates for the relative stellar parameters. In Sect. 2 we give a brief description of the method and summarize the updated formulae.
Considering absolute distances of various stellar systems, we studied double-mode variables which have the distinct advantage of yielding extra constraints on the stellar parameters through their two observed pulsation modes which are identified with two of the first three radial eigenmodes. By using the very recent data sets from the macho and ogle variable star inventories, with the aid of pulsation and stellar atmosphere models we derived the distances of several globular clusters and those of the Magellanic Clouds. Sect. 3 gives a concise description of the method and a summary of the derived distances.
Unfortunately, direct application of the above method to Cen is not possible, because of the mysterious lack of double-mode variables in this, otherwise well-populated cluster. Therefore, in Sect. 4 we use relative cluster distances to derive the absolute distance of Cen. We also estimate its overall reddening by using two independent data sets. A comparison is made between our distance and the one derived from the analysis of the detached binary OGLEGC17 (Thompson et al. 2000; see also Kaluzny 2002). It is shown that there is a significant difference of – mag between the two distances, with our method favoring the ‘long distance scale’.
The often quoted peculiar metallicity distribution of this cluster is investigated in Sect. 5. From a representative sample of RRab stars, our derived metallicity distribution shows a fair agreement with the ones obtained from the spectroscopic investigation of the giant population. Furthermore, it is pointed out that there are other clusters too, where we may suspect sufficient metallicity spread based on the light curves of the RRab stars.
2. Relative intrinsic quantities and metallicities from RRab stars
The underlying assumption in using the light curves of pulsating stars in calculating stellar parameters is that there exist a ‘reasonably simple’ relation between the Fourier and stellar parameters. Unfortunately, except for a broad understanding of this dependence from hydrodynamical models, there is no precise theoretical prediction on the functional form of this relation. Therefore, we approached the problem by searching for best fitting linear combination of the Fourier parameters. All of our results suggest that although the existence of nonlinear relations cannot be excluded, they might play a role only at a level which is lower than the estimated observational noise.
Since our method has been described in several papers (e.g., Kovács & Jurcsik 1996; 1997; Kovács & Walker 2001, hereafter KW01), here we mention only the most important steps. In the context of globular cluster RRab stars, we consider the relation between the observed average magnitudes and the Fourier parameters of the light curves in the Johnson band. Because we deal with different clusters, it is also necessary to find the best relative (reddened) distance moduli. This is done within the fitting procedure, where the Fourier parameters and the relative distance moduli are fitted simultaneously to the apparent average magnitudes. It was shown in KW01 on the basis of 366 stars in 20 clusters that the optimum fit to the intensity-averaged magnitudes is obtained by the following three-parameter formula
| (1) |
Here denotes the absolute visual magnitude, is the period (in [day]), and are the Fourier amplitudes (in [mag]) of the fundamental and second harmonic components, respectively. This formula (with the corresponding relative distance moduli) fits the above mentioned data set with a standard deviation of mag, which is higher than the expected observational noise. As it is discussed in KW01, some part of the dispersion can be accounted for by the reddening variation in front of the clusters. Nevertheless, even if we consider this effect, the estimated overall observational noise of the individual average magnitudes becomes mag, which is perhaps still higher than expected. We will have a better understanding of this problem when future precise ccd observations will become available on clusters with low reddenings.
We can suppress the effect of reddening variation by using two-color data, and construct a reddening-free, magnitude-averaged quantity, such as (see Dickens & Saunders 1965). By following the same procedure as for , with the aid of 172 stars in 15 clusters, KW01 obtained the following formula
| (2) |
We see that for this particular quantity, beside the period, there seems to be no need for any other information on the light curve. As it is described in KW01, this result is in contradiction with our earlier finding, which, however was based on the analysis of a much smaller data set. In addition, when a comparison is made with the regression on the reddening-free color index computed from a sample including also Galactic field variables, it turns out that either or should contain some dependence on (as it is expected from the metallicity dependence of and from the dependence of [Fe/H] – see Jurcsik & Kovács 1996). None of these quantities, based on cluster variables show this dependence. We explain this contradiction as a result of the relatively high noise and small metallicity range of the available cluster variables.
Eq. (2) (with the computed true, i.e., reddening-free relative distance moduli) fits the data with the standard deviation of mag. We see that this is almost the same value as the one obtained in the fit of the average magnitude, although we would expect a smaller one, because individual reddenings are thought to be eliminated in the color combination used. However, there is a ‘price to pay’ for this, namely the observational noise is amplified, which, in the case of cluster variables, yields a rather large contribution to the overall error budget.
With the combination of the magnitude-averaged counterpart of Eqs. (1) (see KW01) and Eq. (2), with the zero point given by Kovács & Jurcsik (1997) we obtain the following expression for the intrinsic color index
| (3) |
With this expression one can easily estimate the reddening without resorting to some more elaborate formulae (e.g., Blanco 1992), which are based on less extended samples and use additional quantities, such as metallicity. If less accurate data are available, one can also use a two-parameter formula with and as given in KW01 (of course, in this case the result will be somewhat less accurate).
Finally we quote our earlier result concerning the dependence of [Fe/H] on the Fourier parameters. Based on a sample of 81 Galactic RRab stars, Jurcsik & Kovács (1996) found that the published iron abundances, obtained from low-dispersion spectroscopic data, can be fitted within the expected accuracy of the measurements with the following formula
| (4) |
The standard deviation of the fit is 0.13 dex, and the contribution from the Fourier phase is highly significant. The data span almost the full expected range of RR Lyrae metallicities, i.e., from [Fe/H]= to . The fact that the metallicity of RR Lyrae stars depends also on other parameters, beside the period, was first recognized by Preston (1959). Although the period-amplitude diagram is still used for diagnostic purposes by some researchers, it is important to note that Eq. (4) fits the above mentioned data set with a factor of two lower dispersion than the regression employing and . Application of Eq. (4) to globular clusters yielded good agreement with the spectroscopic values obtained from giants. At the low-metallicity end, however, our formula predict a somewhat (by dex) higher metallicity. Although it is possible that Eq. (4) overestimates the metallicity in the low [Fe/H] region, because of the relatively high number of less metal poor variables in the Galactic field, it is important to note that a better comparison would require direct spectroscopic measurements for cluster RR Lyrae stars. However, these data, with a comparable accuracy to that of the Galactic field stars, practically do not exist.
3. Absolute stellar parameters from double-mode variables
Due to the current microlensing surveys in the Magellanic Clouds, the number of known double-mode stars (RR Lyrae and Cephei stars pulsating in two radial modes simultaneously) has increased considerably. Based on the analysis of 1350 variables, previously classified as first overtone RR Lyrae (RRc) stars, Alcock et al. (1997, 2000) discovered 181 double-mode (RRd) stars in the Large Magellanic Cloud (LMC). From the ‘fall-out’ of the ogle project, now we know 76 double-mode Cepheids in the LMC and 93 ones in the Small Magellanic Cloud (SMC) (Udalski et al. 1999a, Soszyński et al. 2000). While in the case of RRd stars the so far securely identified variables all show pulsations only in the fundamental and first overtone modes, we find variables in great number among Cepheids both in the LMC and SMC which pulsate in the first and second overtones. For the significance of these discoveries, it is enough to mention that prior to the microlensing surveys, it was CO Aur known as the only example for first and second overtone pulsation among Cepheids (Babel & Burki 1987). Now, according to the ogle surveys mentioned above, the number of these variables in the Magellanic Clouds is 127.
The importance of double-mode variables comes from fact that their observed periods are very close to the ones computed from linear, purely radiative pulsation models (i.e., the change in the periods due to nonlinear and convective effects is very small – see Kolláth & Buchler 2001). Therefore, the periods are easily comparable with large number of models, and the stellar parameters can be strongly constrained. Since the radial normal mode periods depend mainly on four parameters (mass, luminosity , effective temperature , and heavy element abundance [M/H]), the two periods yield the following expression for the luminosity
| (5) |
Here is a smoothly varying function, usually not computed explicitly, but obtained from pulsation model grids through some interpolation method. Mass is derived in a similar manner.
For the computation of we can use the observed dereddened color index and convert it to with the aid of some current calibration using infrared flux method or other, least model-dependent methods (see, e.g., Blackwell & Lynas-Gray 1994; Alonso, Arribas & Martínez-Roger 1999; Sekiguchi & Fukugita 2000). In our approach we used these more empirical methods to fix the zero point of the temperature scale, but the actual functional dependence of on color index, and [M/H] is obtained from grids of model atmospheres (Castelli, Gratton & Kurucz 1997). Metallicity [M/H] is usually identified with the iron abundance [Fe/H] and obtained either from independent estimates or from the RRab population of the host cluster as described in Sect. 2.
Various types of variables have been used to test the above method in deriving distances to nearby globular clusters and to the LMC. In the case of RRd stars we used , whereas for Cepheids we employed color indices, because they were the ones which were most numerous in the corresponding publications. For the zero points we used the calibration of Blackwell & Lynas-Gray (1994). A large number of purely radiative linear pulsation models were computed in the standard way. We used the opal opacities as given by Iglesias & Rogers (1996). Additional details of the databases and model fitting can be found in Kovács (2000a, b) and references therein.
| Cluster | [Fe/H] | ||
|---|---|---|---|
| M 15 | 8 | 18.52 | |
| M 68 | 11 | 18.47 | |
| IC 4499 | 13 | 18.50 | |
| LMC | 181 | 18.52 | |
| ⋆SMC | 93 | 18.54 | |
| ⋆LMC | 71 | +18.58 |
⋆Beat Cepheid distances
+Preliminary result
By using relative distances derived from the RRab populations as described in Sect. 2 and as given by Udalski et al. (1999b), we converted the cluster distances to the distance modulus of the LMC. The result is shown in Table 1. The the near agreement of the distances derived from diverse stellar populations is very comforting and shows that: (i) the photometric data used from various sources have consistent zero points; (ii) relative distances are well-calibrated; (iii) overall metal abundances (which are at the same time in agreement with the generally accepted cluster or population averages) are properly selected — double-mode masses and luminosities are sensitive functions of the metal abundance; (iv) models yield consistent results for very different double-mode pulsators (RR Lyrae, first overtone/fundamental and first overtone/second overtone Cepheids).
Although the method is affected by various errors, most of them cause changes in the derived distances at a level of several hundredths of a magnitude. Statistical errors are especially small, because of the large number of objects available for us from the microlensing surveys and also because of the notable accuracy of the globular cluster data. Certain systematic errors (e.g., the ones due to photometry, and metal abundance) must also yield a rather small contribution to the total error budget, because otherwise we would get larger differences among the distances derived from various stellar populations. However, there is one source of error which affects all distances in almost the same way, and thereby should be considered as the major ambiguity of the method. This is the choice of the zero point of the color index calibration. In our studies we took the temperature scale based on the infrared flux method as given by Blackwell & Lynas-Gray (1994). We chose their zero point because we found their result and the adjacent data published by Clementini et al. (1995) to be most easily used in fixing the zero points of the relative values of the atmosphere models of Castelli et al. (1997). By using the zero points of other recent calibrations (e.g., Alonso et al. 1999; Sekiguchi & Fukugita 2000) the distances shown in Table 1 change by amounts less than mag. This puts a lower limit of mag for the true distance modulus of the LMC. This is significantly different from the distance derived from, e.g., binary stars (Guinan et al. 1998) and red clump stars (Udalski et al. 1999b), but in agreement with the distance obtained from the Baade-Wesselink analysis of Cepheids (Gieren, Fouqué & Gómez 1998) and evolution models of Cepheids and RR Lyrae stars (Alibert et al. 1999; De Santis & Cassisi 1999; VandenBerg et al. 2000). We will return to the distance problem in the next section.
The average physical parameters of the RRd stars obtained from the above analyses show that the main difference between the variables hosted by low- and high-metallicity clusters is that the high-metallicity stars have slightly higher temperatures than the low-metallicity ones. Differences between the luminosities and masses are insignificant. For example, for IC 4499 and M 68 we get , , and , , , for the average , and values, respectively. The errors listed are the standard deviations calculated from the values of the individual variables (i.e., they are not the errors of the averages, those are about a factor of three smaller). It follows from this result that the observed trend/spread in the diagram in the LMC, Sculptor and Sagittarius dwarf galaxies (Alcock et al. 2000; Kovács 2001; Cseresnjes 2001), is most probably due to a spread in the metallicity rather than in the mass of the RRd populations of these systems. Although the above stellar parameters were derived by using solar-type element ratios for the heavy elements, we think that the relative parameters will remain unchanged even if, e.g., oxygen enhancement is included. This is because in the metallicity range of , relevant for RRd stars, the enhancement ratio does not change significantly (e.g., Clementini et al. 1995). Unfortunately, without the availability of detailed abundance analyses on RRd stars, we cannot make a more quantitative statement on the affect of the various element enhancements. Nevertheless, the agreement with the distance moduli obtained from Cepheids, which have scaled solar heavy element mixtures, implies that enhancement of some components (other than iron) in the total heavy element content do not play a significant role in the finally derived physical parameters.
4. The distance and reddening of Cen
First we compute the relative distance of Cen. In order to do so, we need multicolor photometry which is extended and accurate enough to allow us a reliable computation of the average colors and Fourier parameters. Unfortunately, among the publicly available data sets, the quite recent ccd observations of Kaluzny et al. (1997) (hereafter K97) were made only in color. Therefore, it was necessary to employ other, less contemporary data sets. Nevertheless, we will see that these older data yield consistent and accurate estimates on the average distances and reddenings.
The two data sets used are those of Dickens & Saunders (1965) (hereafter DS65) and Butler, Dickens & Epps (1978) (hereafter B78). Both of these papers contain data on the intensity mean averages (i.e., magnitude averages computed from the mean of the intensity transformed light curves). Because the distance modulus and reddening formulae (Eqs. (2), (3)) refer to magnitude mean averages (i.e., averages of the standard magnitude values), it is necessary first to convert the published intensity averages , to magnitude averages , . This is done for variables common with the sample of K97 by using the Fourier parameters of the accurate light curves of K97.
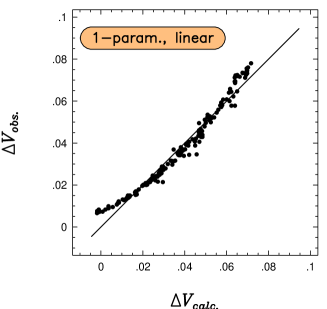
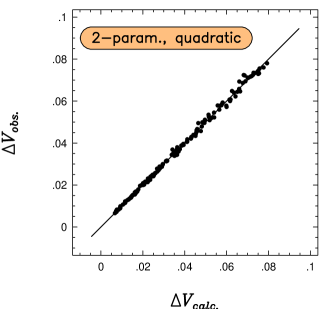
To derive the relations between the two types of averages, we used the Fourier parameters and the corresponding and averages of 150 stars compiled by Kovács & Jurcsik (1997) and KW01. By experimenting with various number of parameters and polynomial dependence, we obtained the following result. Higher parameter linear combinations do not improve significantly the quality of the single parameter fit obtained with the first Fourier amplitude
| (6) |
where means the standard deviation of the fit in [mag]. Fig. 1 shows that the correct relation must include significant nonlinear term(s). Indeed, the best single parameter quadratic fit takes care of most of the nonlinearity and yields a considerably lower standard deviation
| (7) |
Finally, when the number of parameters is increased to two in a quadratic fit, containing all parameter combinations up to second order, we end up with the following expression
| (8) |
where denotes the Fourier amplitude of the second harmonics (the component). As it is shown in Fig. 1, indeed, the above regression yields an excellent fit to the data, leaving no trace of systematic effects, except maybe for a slight increase of dispersion in the high amplitude regime, where the differences between the two types of means become larger. Even this small dispersion can be further decreased by employing a three-parameter quadratic fit. Although tests made on much larger data sets show that this high-parameter fit yields statistically significant improvement compared to the two-parameter one, for the practical purpose in the present context the two-parameter quadratic formula is quite satisfactory.
In the next step we repeat the above procedure for the averages defined on the same data set. We get the following formulae
| (9) | |||||
| (11) |
It is noted that nonlinearity plays a significant role also in this color. We see that the dispersions are higher than for . This is because we use the Fourier parameters of the light curves also in this case. Nevertheless, even this larger dispersion corresponds to a rather tight regression if we compare it with the total range of , which is mag. The fit becomes much better if the Fourier decompositions of the light curves are used. However, our purpose is to use the available accurate light curves to compute the necessary corrections. Observational errors are much larger in the data sets we use in this paper than the errors introduced by the lower accuracy of the fit of the data.
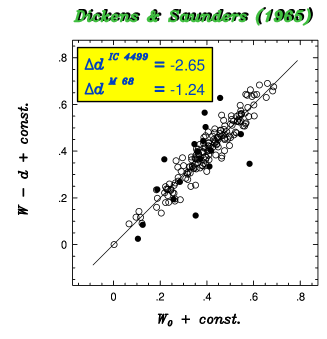
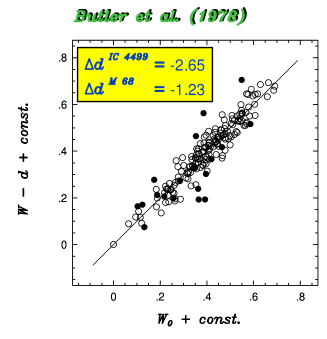
By applying Eqs. (8) and (11), we transformed the intensity mean values of those stars in the DS65 and B87 samples which have also been observed by K97. Then, Eq. (2) can be used directly on these data to compute relative distance moduli. For better illustration, in Fig. 2 we plot the result of the direct fit of the Cen data to the corresponding data set of KW01. The few data points on M4 have been omitted, in order to be consistent with a subsequent fit of . (The cluster M4 has a rather large and inhomogeneous reddening, therefore, most of its stars show up as outlying points in the fit of .) We see that both data sets yield the same relative distance moduli, in spite of the large scatter of these unedited samples. With the same method (or by using the corresponding formula of KW01 for the magnitude mean ), we can get the following reddened relative distance moduli: Cen (IC 4499) and Cen (M 68) for the 18 variables of DS65 and , for the 20 variables of B78. We note that in KW01 we obtained reddened, relative distance moduli of and . The consistency of the DS65 and B78 distance moduli indicates that there is a zero point error of about – mag in the K97 data (meaning fainter magnitudes for the variables of K97).
In calculating the absolute distance modulus, we simply add to the above relative distance moduli the absolute distance moduli of IC 4499 and M 68, derived from their RRd populations. The distances of these two clusters can be computed according to Kovács (2000b) (see also Kovács & Walker 1999). We get and mag for the true distance moduli of IC 4499 and M 68, respectively. Finally, with the above derived relative distance moduli we get 13.83 mag for the true distance modulus of Cen.
Reddening can be computed by simply applying Eq. (3) to the Fourier decompositions of the light curves of K97 and compare the calculated intrinsic color indices with the observed ones (after applying the above transformation to get magnitude averages). For the above sample of DS65 we get , wheras for that of B78, we obtain . Here the errors denote the standard deviations of the reddening values of the individual variables. The statistical error of the averages is mag. Although in Kovács & Jurcsik (1997) we used a reasonably large number of stars from the Galactic field and globular clusters to fix the zero point of the reddening scale, there might be also a systematic error in the above derived values, but this should not exceed (0.01–0.02) mag.
It is worthwhile to compare this distance with the one derived by Thompson et al. (2001) (hereafter T01, see also Kaluzny et al. (2002)). Their distance estimate is based on the analysis of the detached binary OGLEGC17. This method is similar to ours in the sense that in the calculation of the luminosity it is essential to adopt some color index calibration. For this reason we employ the scale of Sekiguchi & Fukugita (2000), which is the same as the one used by T01. Furthermore, as in all of our previous computations, we use the more customary value of instead of , used by T01. By considering only the primary component, with , , , [Fe/H]=, , , (Sun) K, we get 13.38 mag for the true (dereddened) distance modulus . By repeating the above computation with , we get almost the same result of , because the reddening correction (with the standard extinction coefficient ) nearly cancels the change in the absolute magnitude due to the change in the effective temperature as computed from the dereddened color index. We note that using higher metallicity of for the primary component results in an increase of mag in the distance modulus.
When the above temperature scale is applied in computing the distance with the aid of RRd stars, we get . This is lower than the above quoted value, because the zero point of the scale of Sekiguchi & Fukugita (2000) is lower by than the one used in our studies.
The difference of – mag (depending on the assumed [Fe/H] and of OGLEGC17) between the RRd and binary distances is very large and indicates that some basic problems may exist in one or both of these methods. However, we would like to mention that we get almost a factor of two smaller differences between the distance moduli, if we use the surface brightness formula given by T01 and used in the derivation of their preferred distance. With , T01 give a value of for the infrared color index of the primary component. With this, and with the above quoted radius value one gets an absolute visual magnitude of mag. This yields a true distance modulus of . If we use a lower reddening of , we end up basically with the same figure, i.e., with . In order to apply the surface brightness method based on the color index to our data set of the RRd stars with index, we computed corresponding indices by requiring that the two indices yield the same . (We note that this procedure is independent of the temperature zero point.) In this way we derived a distance modulus of mag. This is still larger that the one obtained from the binary method, but the difference is only mag (if we compare the results obtained with the same reddening). We suspect that the larger difference between the the distances derived from the surface brightness and calibration in the binary method indicates that there might be some error in the color indices derived for the components by T01.
5. The metallicity distribution of the RRab stars in Cen
Individual metallicity values of RRab stars in Cen were calculated by employing Eq. (4) on the sample used by KW01. The variable V137 was omitted because of its somewhat discordant light curve. For the remaining 43 stars we have an average [Fe/H] of with a standard deviation of . (Please note that we use a metallicity scale tied to the one defined by the high dispersion spectroscopic measurements — see Jurcsik 1995; Clementini et al. 1995.) The distribution of the [Fe/H] values are displayed in Fig. 3. For comparison, we also show the metallicity distribution of 39 RRab stars in M 5. We used the data set of KW01, after omitting 4 variables (V6, V29, V77, V963), which were left out of this test for various resons (e.g., strange shape of light curve, high noise, etc.).
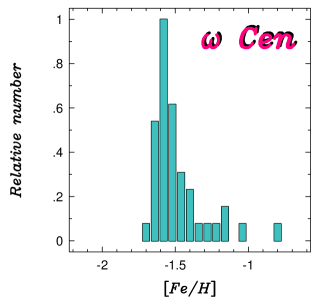
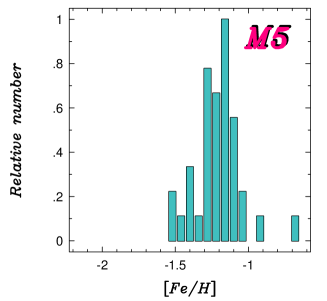
The average of [Fe/H] for M 5 is , with a standard deviation of , which is the same as that of the Cen variables. This, and the distribution functions show that the two clusters are fairly similar from this respect, although for Cen the distribution seems to be more skewed, in a similar way as the distribution obtained from the spectroscopic observations of giant stars by Suntzeff & Kraft (1996). On the other hand, our [Fe/H] values seem to be even more narrowly distributed than those of the giants. We note that direct measurements of Butler et al. (1978) yielded a very wide distribution. Although the metallicity dispersion obtained from multicolor photometry by Rey et al. (2000) is narrower, it is still broader than ours, and does not show the asymmetric pattern visible in the distribution of the giants. It is suspected that the direct estimates obtained from photometry is still suffering from a considerable amount of noise.
The bulk of the distribution of [Fe/H] for M 5 is about dex wider than the one obtained from the direct spectroscopic data on giants by Ivans et al. (2001). It is not known what is the reason of this difference. Although care was taken to avoid variables with amlitude changes or large scatter, some part of the larger [Fe/H] range might originate from hidden Blazhko variables not revealed by the limited data available for most of the stars. Nevertheless, it is interesting to note that the RRab variables of the two clusters show the same amount of metallicity dispersion, although only Cen is considered in general as an example for a globular cluster with measurable metallicity spread. We refer to KW01 for metallicity estimates obtained from the light curves of the RRab stars in additional globular clusters.
6. Conclusions
In this paper we summarized the method of determination of the physical parameters of RR Lyrae stars based on the Fourier analysis of the light curves of fundamental mode variables and on the pulsation study of double-mode pulsators. The method is applied to the variables of Cen. The following results were obtained:
-
•
The overall reddening determined from two independent data sets yielded basically the same result mag with a standard deviation of mag. Considering both samples together, the statistical error of the above mean is mag. The zero point ambiguity of this reddening value is estimated to be less than – mag.
-
•
By using the above two data sets, we determined the relative distance modulus of Cen from globular clusters with known absolute distance moduli computed from their double-mode variables. The derived distances were consistent within mag and yielded a mean true (dereddened) distance modulus of mag with a statistical error lower than mag. The largest systematic error comes from the color index calibration, which (based on the differences between the currently available calibrations), does not exceed mag.
-
•
A comparison was made between the above distance modulus and the one derived by Thompson et al. (2001) from a detached binary of this cluster. By using the same temperature calibration, we found our distance to be larger by – mag, depending on the assumed reddening and metallicity of the binary. By using a surface brightness method as a substitute for the temperature calibration, the difference decreased to mag, with both methods giving longer distances.
Acknowledgments.
This work has been supported by the following grants: otka t026031, t030954 and t038437.
References
Alcock, C. et al. (The MACHO Collaboration) 1997, ApJ, 482, 89
Alcock, C. et al. (The MACHO Collaboration) 2000, ApJ, 542, 257
Alibert, Y. et al. 1999, A&A, 344, 551
Alonso, A., Arribas, S. & Martínez-Roger, C. 1999, A&AS, 140, 261
Babel, J. & Burki, G. 1987, A&A, 181, 34
Bailey, S.I. 1899, ApJ, 10, 255
Blackwell, D.E. & Lynas-Gray, A.E. 1994, A&A, 282, 899
Blanco, V.M. 1992, AJ, 104, 734
Butler, D., Dickens, R.J. & Epps, E. 1978, ApJ, 225, 148 (B78)
Castelli, F., Gratton, R.G., & Kurucz, R.L. 1997, A&A, 318, 841
Clementini, G. et al. 1995, AJ, 110, 2319
Cseresnjes, P., 2001, A&A, 375, 909
De Santis, R. & Cassisi, S. 1999, MNRAS, 308, 97
Dickens, R.J. & Saunders, J. 1965, Roy. Obs. Bull., No 101 (DS65)
Gieren, W.P., Fouqué, P. & Gómez, M. 1998, ApJ, 496, 17
Guinan, E.F. et al. 1998, ApJ, 509, L21
Iglesias, C.A. & Rogers, F.J. 1996, ApJ, 464, 943
Ivans, I.I. et al. 2001, AJ, 122, 1438
Jurcsik, J. 1995, Acta Astr., 45, 653
Jurcsik, J. & Kovács, G. 1996, A&A, 312, 111
Kaluzny, J. et al. 1997, A&AS, 125, 343 (K97)
Kaluzny, J. et al. 2002, these proceedings
Kolláth, Z. & Buchler, J.R. 2001, Ap. & Sp. Sci. Lib., Vol. 257, 29
Kovács, G. 2000a, A&A, 360, L1
Kovács, G. 2000b, A&A, 363, L1
Kovács, G. 2001, A&A, 375, 469
Kovács, G. & Jurcsik, J. 1996, ApJ, 466, L17
Kovács, G. & Jurcsik, J. 1997, A&A, 322, 218
Kovács, G. & Walker, A.R. 1999, ApJ, 512, 271
Kovács, G. & Walker, A.R. 2001, A&A, 371, 579 (KW01)
Preston, G.W. 1959, ApJ, 130, 507
Rey, S.-C. et al. 2000, AJ, 119, 1824
Sandage, A. 1981, ApJ, 248, 161
Sekiguchi, M. & Fukugita M. 2000, AJ, 120, 1072
Soszyński, I. et al. (The OGLE Collaboration) 2000, Acta Astr., 50, 451
Suntzeff, N.B. & Kraft, R.P. 1996, AJ, 111, 1913
Thompson, I. B. et al. 2001, AJ, 121, 3089 (T01)
Udalski, A. et al. (The OGLE Collaboration) 1999a, Acta Astr., 49, 1
Udalski, A. et al. (The OGLE Collaboration) 1999b, Acta Astr., 49, 201
VandenBerg, D.A. et al. 2000, ApJ, 532, 430