Variations in the Bivariate Brightness Distribution with different galaxy types.
Abstract
We present Bivariate Brightness Distributions (BBDs) for four spectral types discriminated by the 2dFGRS. We discuss the photometry and completeness of the 2dFGRS using a deep, wide-field CCD imaging survey. We find that there is a strong luminosity-surface brightness correlation amongst galaxies with medium to strong emission features, with gradient and width . Strong absorption line galaxies, show a bimodal distribution, with no correlation between luminosity and surface brightness.
Department of Physics and Astronomy, Johns Hopkins University, 3700, San Martin Dr, Baltimore, MD 21218, USA.
Research School of Astronomy & Astrophysics, Mount Stromlo Observatory, Cotter Road, Weston ACT 2611, Australia.
School of Physics & Astronomy, The North Haugh, St Andrews, Fife, KY16 9SS, United Kingdom.
1. Introduction
The BBD is the number density of galaxies as a function of both absolute magnitude, , and effective surface brightness, . This provides a useful framework for removing surface brightness selection effects from the measurement of the space density of galaxies (Cross et al. 2001) and also provides useful constraints for testing models of galaxy formation and evolution (de Jong & Lacey 2000).
Large redshift surveys such as the “Two-degree Field Galaxy Redshift Survey” (2dFGRS, Colless et al. 2001) and the “Sloan Digital Sky Survey (SDSS, York et al. 2000) provide the quantity of data necessary to select the unbiased, statistically significant samples needed to measure the BBDs of different galaxy types.
2. The Data
The 2dFGRS is a redshift survey, containing redshifts for galaxies, with an apparent magnitude limit (see Colless et al. 2001). The input catalogue for the 2dFGRS is based on the Automated Plate Machine (APM) catalogue (Maddox et al. 1990), with some recent recalibration using new CCD data.
Madgwick et al. (2002) used the 2dFGRS to identify four spectral classes based on the emission/absorption line strength () of galaxies. -type 1 galaxies have strong absorption lines and -type 4 galaxies have strong emission lines.
The Millennium Galaxy Catalogue (MGC, Liske et al. 2002) is a deg2 deep CCD imaging survey of an equatorial strip between and . The MGC images were taken through the KPNO-B filter on the Isaac Newton Telescope. The detection isophote mag arcsec-2 and the mean seeing is . Star-galaxy separation has been undertaken by eye for all objects. For each galaxy we measured half light radii () along the major axis of the ellipse that contains half of the flux of the galaxy. We use this to calculate the effective surface brightness, , assuming a circular aperture, to correct for inclination effects, see Cross et al. (2002).
3. Photometry and Completeness of the 2dFGRS
Using a mean colour for galaxies , we find that the filter conversion between the APM and MGC is . .
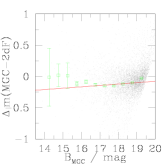
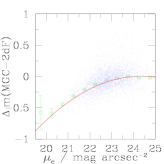
The mean scale error in magnitude is small and linear (see Fig 1). It is fit by the equation , where and . However, there is a significant scale error as a function of effective surface brightness (see Fig 1). is constant for but decreases non-linearly with for mag arcsec-2. The most likely explanation is non-linearities or saturation of high surface brightness galaxies in the APM. A comparison between the MGC and the Sloan Digital Sky Survey Early Data Release (SDSS-EDR) shows that with no significant scale error.
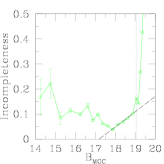
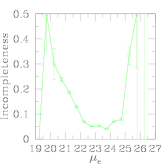
We select the sample of MGC galaxies which should have 2dFGRS matches to measure the photometric completeness, see Cross et al. (2002). The variation of incompleteness with magnitude and with surface brightness is shown in Fig. 1. The incompleteness is worst at the bright and faint ends, reaching a minimum of in the range . It increases linearly with magnitude in the range . For , the magnitude limit of the 2dFGRS affects the measurement of completeness. For the incompleteness is fairly constant . The incompleteness of low surface brightness galaxies increases rapidly beyond and no 2dFGRS galaxies are seen with , as expected with an isophotal limit . At the high surface brightness end, the incompleteness rises steadily, since small angular size galaxies were mistaken for stars in the APM.
4. Bivariate Brightness Distributions
Since the 2dFGRS suffers from a non-linearity with surface brightness and photometric incompleteness to , we use the MGC objects defined as galaxies to select the BBD sample. The selection limits used are: the isophotal limit mag arcsec-2, the minimum half light radius , defined by the average star-galaxy separation, and the maximum half-light radius , limited by the sky subtraction. The other limits, are determined by the redshift completeness. We select a subsample, with redshift completeness at all values of and . These limits are discussed in Cross (2002).
We calculate the overall BBD using a maximum likelihood method outlined in Cross (2002). It is based on the step-wise method (Efstathiou, Ellis & Peterson 1988), but also includes Visibility Theory (Phillipps, Davies & Disney 1990). The overall BBD is shown in the first plot of Fig 2.


| (1) |
We fit the Chołoniewski (1985) function, Eqn 1, to this distribution. The best fit gives , , , , and with for degrees of freedom.
The MGC database is too small to produce statistically significant samples to measure the BBD for each spectral type. Instead, we use the MGC to remove the non-linearities in the 2dFGRS magnitudes and to correct for photometric incompleteness and stellar contamination, see Cross (2002). This gives a ten times larger dataset, but with larger random errors in the photometry.
The BBDs produced for each type are also displayed in Fig 2. We find that -type 1 galaxies have a bimodal distribution - a tightly bounded distribution, centred on with a high degree of symmetry and no significant luminosity surface brightness correlation, with a second fainter distribution, which continues upto the selection limits.
In contrast types 2-4 show a strong luminosity-surface brightness correlation (, ), which does not vary significantly between these types. The proportion of faint galaxies increases with -type: -type 2 galaxies have a flat faint end slope () and -type 4 galaxies have a steep faint end slope ().
5. Conclusions
We have used a deep, wide field CCD survey, the MGC, to show that the 2dFGRS contains a scale error with surface-brightness, due to non-linearities in the photographic plates. Furthermore, the 2dFGRS has a mean photometric incompleteness of , for , with many low surface brightness and low angular resolution galaxies excluded.
The MGC can be used to define a dataset with well understood selection limits that contains CCD photometric data and 2dFGRS spectroscopic data. We have used this dataset to calculate the bivariate brightness distribution (BBD) for the overall galaxy distribution and for four spectral types.
We show that strongly absorbing galaxies (ellipticals/lenticulars) form a bimodal population. The bright, high surface brightness population does not show a strong correlation between magnitude and surface brightness. -type 2-4 galaxies (spirals/irregulars) all show the same strong correlation between magnitude and surface brightness. The proportion of dwarf galaxies increases with increasing emission line strength.
References
Chołoniewski J. 1985, MNRAS, 214, 197
Colless M. et al. 2001, MNRAS, in press
Cross N.J.G. et al. 2001, MNRAS, 324, 825
Cross N.J.G., Driver S.P. 2002, MNRAS, 329, 579
Cross N.J.G. et al. 2002, in preparation
Cross N.J.G. 2002, PhD Thesis, Univ. St Andrews.
de Jong R., Lacey C. 2000, ApJ, 545, 781
Efstathiou G., Ellis R., Peterson B. 1988, MNRAS, 232, 431
Liske J., Lemon D.J., Driver S.P., Cross N.J.G., Couch W.J.C. 2002, in preparation
Maddox S.J., Sutherland W.J., Efstathiou G., Loveday J. 1990, MNRAS, 246, 433
Madgwick D. et al. 2002, MNRAS, accepted
Phillips S., Davies J., Disney M. 1990, MNRAS, 242, 235
York D.G. et al. 2000, AJ, 120, 1579