On the accretion mode of the intermediate polar V1025 Centauri
Abstract
The long white-dwarf spin periods in the magnetic cataclysmic variables EX Hya and V1025 Cen imply that if the systems possess accretion discs then they cannot be in equilibrium. It has been suggested that instead they are discless accretors in which the spin-up torques resulting from accretion are balanced by the ejection of part of the accretion flow back towards the secondary. We present phase-resolved spectroscopy of V1025 Cen aimed at deducing the nature of the accretion flow, and compare this with simulations of a discless accretor. We find that both the conventional disc-fed model and the discless-accretor model have strengths and weaknesses, and that further work is needed before we can decide which applies to V1025 Cen.
keywords:
accretion, accretion discs – novae, cataclysmic variables – stars: individual: V1025 Cen – binaries: close1 Introduction
The magnetic cataclysmic variables are close binary stars in which one can study the interaction of an accretion flow with a magnetic field. Where the accreting white dwarf is only weakly magnetic ( 105 G) an accretion disc disc in a manner little different from that in non-magnetic systems. Stronger fields ( 107 G) lock the spin of the white dwarf to the binary orbit and dominate the accretion flow, forcing it to accrete along field lines. The intermediate case is less clear, and systems in this category (refered to as intermediate polars or IPs) display a range of behaviours depending on the mass-transfer rate, field strength and white-dwarf spin period. Among the possibilities are (1) a partial disc which is disrupted when the magnetic pressure exceeds the ram pressure, giving way to magnetically channelled flow inside the magnetosphere; (2) a partial disc, but with some of the accretion stream overflowing the disc to interact directly with the magnetosphere (e.g. Hellier 1991); (3) discless accretion in which the flow can be regarded as diamagnetic, intermediate between the purely ballistic and magnetically channeled flows (e.g. King 1993; Wynn & King 1995); (4) models in which the propeller effect of a rapidly spinning field prevents accretion (e.g. Wynn, King & Horne 1997). Recent reviews of these possibilities are presented in Hellier (2001), chapter 9, and Wynn (2001).
Of particular relevance to this paper is the ratio of the spin period of the white dwarf to the orbital period of the binary. Most IPs have / 0.1, and indeed no system can both possess an accretion disc and be in equilibrium unless this inequality holds. This condition is equivalent to the condition where is the corotation radius (the radius at which the magnetic field corotates with a Keplerian flow) and is the circularization radius (the radius at which a circular orbit has the same angular momentum as the stream from the inner Lagrangian point). However, King & Wynn (1999) discovered that a discless system can reside on a continuum of equilibria with , where is the distance to the Lagrangian point. Such a system would have a longer spin period, with 0.1 / 0.7. At the time only one IP (EX Hya, with = 67 mins and = 98 mins) was known to have a secure / ratio greater than 0.1. The purpose of this paper is to (1) confirm earlier indications that V1025 Cen is a second system in this category, and (2) analyse spectroscopic observations to investigate whether the accretion flow is better described by the partial-disc model or by the diamagnetic-flow model.
Buckley et al. (1998)’s discovery paper on V1025 Cen (RX J1238–38) and follow-up X-ray observations (Hellier, Beardmore & Buckley 1998) found a spin period of 2147 s (revealed by an optical and X-ray pulsation), and suggested an orbital period near 85–90 mins, and thus a / ratio of 0.4. The star is also notable for showing a 1860-s optical and -band periodicity (Buckley et al. 1998). Given the above spin and orbital periods, the only plausible identification is with the first harmonic of the beat cycle between the orbital and spin cycles [i.e. the frequency 2( – ) where and are the spin and orbital frequencies respectively]. Note, though, that no other IP shows a lightcurve containing 2( – ) but not – . Other than this, V1025 Cen is little studied, with, as yet, no ephemerides for the periodicities, no estimate of the field strength, and no determination of the binary inclination or of the component masses. Note that a possible grazing eclipse reported by Allan et al. (1999) was an artefact of incorrect data reduction.
2 Observations and data
We observed V1025 Cen with the 3.9-m AAT and the RGO spectrograph plus a TEK CCD. A 1200 lines mm-1 grating gave a resolution of 1.4Å, covering the range H to H. Observing for 2 h, 4 h & 3.5 h on the three consequtive nights 1996 May 10–12 we obtained 320 integrations of 100 s each, thus covering 7 orbital cycles and 16 spin cycle of this star. The summed spectrum, containing He i and He ii lines in addition to the Balmer lines, is shown in Fig. 1. It is interesting to note that the spectrum is similar to that of EX Hya (e.g. Hellier et al. 1987), in that the lines are broader than in most IPs.

As a first look at the data we computed the equivalent widths and the V/R ratios for the lines in each spectrum (V/R being the ratio of the equivalent widths on either side of the rest wavelength). The Fourier transforms of these quantities for H are shown in Fig. 2.

Following Buckley et al. (1998) we identify the V/R periodicity near 0.2 mHz with the orbital cycle. From our data, though, we cannot determine which of two 1-d aliases at 5090 30 and 5410 30 s (85 and 90 mins) is the true period. However, Buckley et al. used the proposed identification of the 1860-s photometric period with 2( – ) to derive (given the 2147-s spin cycle) an orbital period of 5077 s, thus favouring the 85-min alias. We therefore adopt 5077 s as the orbital period, though its 1-d alias should be borne in mind.
The 2147-s spin period is prominent in both the V/R ratios and the equivalent widths. The V/R ratios also show power at 2 and possibly, though nearer the noise level, at 2 – . A peak near – is also clearly above the noise, but is shifted significantly (by 0.7 per cent) from the expected frequency. We discuss this later (Sections 5.2 & 6.1).
3 Orbitally resolved line profiles
In Fig. 3 we show the line profiles of H folded on the orbital (5077-s) period. Each spectrum was first normalised to the continuum level, so that the plot shows quasi equivalent widths (these are more robust than fluxes in narrow-slit spectroscopy). In constructing the fold we are assuming that line-profile variations on the spin or other cycles will smear out into a phase-invariant profile. Thus, to emphasize the varying component, we additionally show the data after subtracting the phase-invariant profile. Also in Fig. 3 is the Doppler tomogram of the subtracted profiles, computed using the back-projection technique (see Marsh & Horne 1988). We present all plots with phase 1 corresponding to a guess at when inferior conjunction of the secondary occurs, but note that we have no secure knowledge of this.
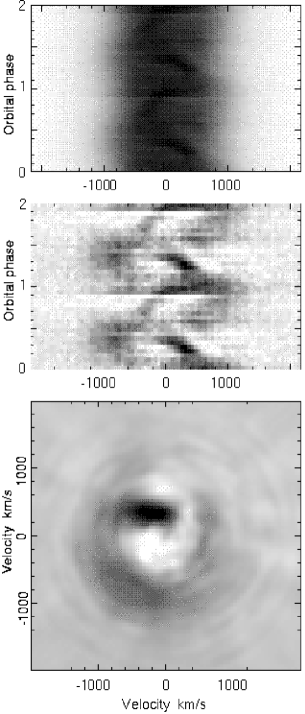
In the line center is an S-wave with a projected velocity of 350 km s-1, phased with maximum redshift at 0.15 in our (insecure) convention, and appearing as the brightest region of the tomogram. Such as S-wave would conventionally be interpreted as arising from the heated face of the secondary, or from the accretion stream, particularly where it hits an accretion disc.
There is also an ill-defined higher-velocity feature which has a maximum blueshift near phase 0.4, when its velocity appears to be centered at 900 km s-1. It is too ill-defined to allow us to measure the amplitude of its orbital motion, but in the tomogram it gives rise to a brightening in the lower-left quadrant.
There is weak evidence for a double-peaked structure, as would arise from a disc. This would form a ring-structure in the tomogram, centered on the velocity of the white dwarf. It is possible to interpret the tomogram in this way, though the ring is ill-defined and incomplete.
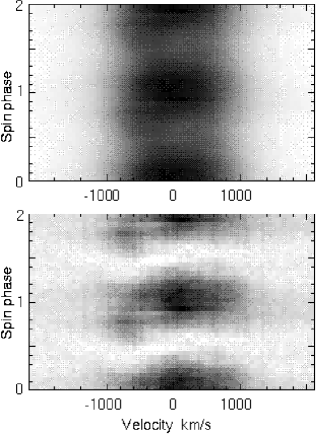
4 Line profiles over spin phase
Fig. 4 shows the variation of the line profiles over spin phase, again displayed as quasi equivalent widths. There is a prominent variation in equivalent width with the whole line becoming brighter at phase 1 (the phasing adopted is arbitrary, as we do not yet have an ephemeris to link it to the photometric or X-ray pulses). Since the spin-cycle variation is primarily a change in equivalent width, rather than velocity, it violates the constant-flux assumption of tomography and the resulting tomogram is not useful [see Hellier (1999) for the tomogram and further discussion of this issue].
The spin-resolved line profiles look similar to those in EX Hya (e.g. Hellier et al. 1987), and thus we adopt essentially the same interpretation (see also Buckley et al. 1998; Hellier 1999). In this model the spin-varying emission comes from the accretion curtains of magnetically trapped material falling onto the magnetic poles. The simultaneously bright red and blue wings and the general symmetry of the profile then implies that we are seeing emission from both upper and lower poles. The brightest emission (phase 1) probably occurs when the upper pole points away from the observer, and the view of the white dwarf is unobscurred, allowing us to see the bright, high-velocity regions of curtain near the white dwarf. Half a cycle later, the outer regions of the upper curtain are in front of the white dwarf, obscurring the bright regions, resulting in the fainter line seen at phase 0.5.
However, the lines are not symmetric, having a brightening in the blue wing at phases 0.6–0.8 that is not seen in the red wing. Thus the curtains of material must be asymmetric or twisted; this might result from the fact that, as discussed next, the field lines must rotate more slowly than the inner edge of any disc.
5 A conventional model?
We first try to interpret the above results in the context of the conventional model of an IP: one that accretes through a partial disc which feeds field lines from its inner edge. Given the exceptionally long spin period of V1025 Cen, the system cannot be in equilibrium in this model, and the field lines must rotate more slowly than the Keplerian motion at the inner disc edge (if this were not the case the magnetosphere would extend beyond the circularisation radius and the angular momentum of the disc would dissipate).
The timescale for spinning up the white dwarf to equilibrium is 106–107 yrs (assuming an accretion rate of 1016 g s-1, typical of systems below the period gap), which is much shorter than the 108-yr evolutionary timescale. Thus we would require an explanation for EX Hya and V1025 Cen being far from equilibrium. The most plausible explanation is a change in the mass-transfer rate. For instance, if mass transfer shut off for a long period, the spin period could lengthen and become locked to the orbit, in the manner of an AM Her star; a resumption of mass transfer would then spin up the white dwarf again, heading for 0.1 . Note that the white dwarf in EX Hya is currently spinning up on a timescale of 4 yrs (e.g. Jablonski & Busko 1985), in line with this picture, although with only a 30-yr span of observations we can’t distinguish between a sustained spin-up and a short-term fluctuation.
5.1 The line profiles and tomogram
The orbital tomogram shows that the high-velocity emission is not symmetric about the white dwarf, being enhanced in the lower-left quadrant. Thus the higher-velocity regions (the inner disc or magnetosphere) are not symmetric over orbital phase. Since V1025 Cen is not eclipsing, it is unlikely that this is due to obscuration of the inner regions by disc structure. Thus the only likely possibility is that the accretion stream overflows the outer disc and continues into the inner disc, where it creates a disturbance localised in orbital phase. This has previously been proposed in IPs to explain X-ray beat periods (e.g. Hellier 1991) and might be occurring in non-magnetic cataclysmic variables such as SW Sex stars (e.g. Hellier & Robinson 1994). The idea also has theoretical support (e.g. Armitage & Livio 1996; 1998).
In the SW Sex stars the high-velocity line wings are at maximum redshift at orbital phase 0.9 (e.g. Thorstensen et al. 1991; Hellier 1996), which matches that in V1025 Cen with our adopted phasing. The brightest region in the V1025 Cen tomogram is then at the right phase to correspond to emission from either the secondary star or the bright spot where the stream hits the disc (or a mixture of these; the phase uncertainty prohibits a secure distinction between the possibilities). Weaker emission is then seen looping leftwards towards the higher-velocity feature, and could be emission from the overflowing stream.
We don’t have sufficient information (masses and inclination) to interpret the velocities in the tomogram directly, but we can perform a plausibility check. The high-velocity wings in eclipsing SW Sex stars extend to velocities of 1400–1600 km s-1 in stars such as SW Sex itself (Dhillon, Marsh & Jones 1997) and V1315 Aql (Hellier 1996); the equivalent component in V1025 Cen extends to 1300 km s-1 in data with a comparable signal-to-noise ratio. These velocities match if V1025 Cen has an inclination of 60∘, or a of 0.87.
Further, adopting a white-dwarf mass of 0.7 M⊙ and a red-dwarf mass of 0.1 M⊙ implies that the red dwarf has an orbital velocity of 440 km s-1, that the Lagrangian point orbits at 290 km s-1, and that the outer edge of the disc (assuming it is located at the tidal limit) orbits at 650 km s-1 (see Warner 1995, chapter 2, for the relevant formulae). These values compare with the observed S-wave amplitude of 350 km s-1, or 400 km s-1 with the above . Thus the S-wave is compatible with arising from the secondary or the early part of the stream, but less compatible with arising from the stream–disc impact (unless the inclination or the white-dwarf mass are lower than adopted above). Thus, overall, the line profiles are consistent with the stream-overflow idea, in that both the lower-velocity S-wave and the line wings have compatible velocities.
5.2 The periodicities
A crucial observation for models of V1025 Cen is that the X-ray lightcurve varies only with the 2147-s spin period, and not with the orbital cycle nor the orbital sidebands of the spin period (Hellier et al. 1998). This implies that the accreting material loses knowledge of orbital phase before attaching to field lines. This, in turn, suggests that, if the stream-overflow model is correct, the overflowing stream does not travel far enough to encounter the magnetosphere, but instead re-impacts the disc further out. This contrasts with suggestions for other IPs, for instance FO Aqr, where the interaction of the overflowing stream with the magnetopshere was invoked specifically to explain an X-ray beat pulse (Hellier 1993; Beardmore et al. 1998). Two caveats should be made. First, the overflow might be intermittent, and might not have been occurring during the X-ray observations. Indeed, the X-ray beat pulse in FO Aqr is variable and sometimes absent. Secondly, we should consider whether the 2147-s period is misidentified, and is actually the beat ( – ) period. This, though, would imply a spin period of 1509 s, and no such periodicity has ever been seen in V1025 Cen; and further, other observed periodicities, such as the 1860-s modulation, would then have no natural identification.
There is, however, a significant beat-cycle modulation in the line V/R ratios (Section 2). This can be explained in the standard way for optical beat periods, namely irradiation of structure fixed in the binary frame (secondary or stream) by the spin-pulsed X-ray beam. However, the period of the observed modulation differs from the expected value by 0.7 per cent. Over the 2-d span of the observations this amounts to a shift of 0.35 cycles. A possible explanation is that over the 2-d interval the X-ray beam switched from illuminating (predominantly) the secondary, to illuminating (predominantly) the structure formed where the overflowing stream re-impacts the disc. As can be seen from the tomogram, these two regions are separated by 0.35 in orbital phase. If correct, this again sugggests that the overflow is intermittent, occuring only some of the time.
One puzzle for the above model is the observation of the 1860-s photometric modulation, identified with 2( – ), when – is not seen. Reprocessing of X-rays would likely result in an optical – modulation, as is observed in many IPs, but not 2( – ). One plausible explanation, that the illuminating X-ray beam is double-peaked, resulting in reprocessing at 2( – ), is contradicted by the fact that the observed X-ray pulse is nearly sinusoidal (Hellier et al. 1998). Thus, this explanation only works if the X-ray pulse is beamed such that it is double-peaked in the orbital plane but sinusoidal from our line of sight, which is unlikely.
6 A discless model?
Having considered a model for V1025 Cen based on the conventional partial disc, we now consider the alternative discless model based on a diamagnetic flow. This model was proposed by King (1993) and Wynn & King (1995), see also Wynn (2001). It treats the accretion flow as a set of diamagnetic blobs, and represents these by the particles in a hydrodynamical code, with the addition of a magnetic drag term which acts like the tension of the magnetic field lines. This term is proportional to the rate at which particles cross field lines, giving an acceleration
where and are the velocities of the material and field and the symbol indicates the component perpendicular to the field lines. The parameter is dependent on factors such as the the local field strength, blob density and Alfvén speed. The net effect is that particles orbiting outside the corotation radius gain angular momentum from the field, and can be pushed outwards, while particles orbiting inside the corotation radius lose angular momentum to the field and so accrete onto the white dwarf.
King & Wynn (1999) proposed that this model can explain the anomalously long spin periods of EX Hya and V1025 Cen, suggesting that the systems are in an equilibrium where . Using this model we have computed simulations of the accretion flow appropriate to V1025 Cen. We assume white-dwarf and red-dwarf masses of 0.7 and 0.1 M⊙ respectively. Using an orbital period of 5077 s we then tweak the parameter until we get a spin period of 2147 s. This requires a magnetic timescale, , of a few seconds. We can combine this with estimates for the density and blob-length in the stream [10-9 g cm-3 and 109 respectively, see King & Wynn (1999)] to find a magnetic moment of 5 G cm3 (equating to a field of 1 MG).
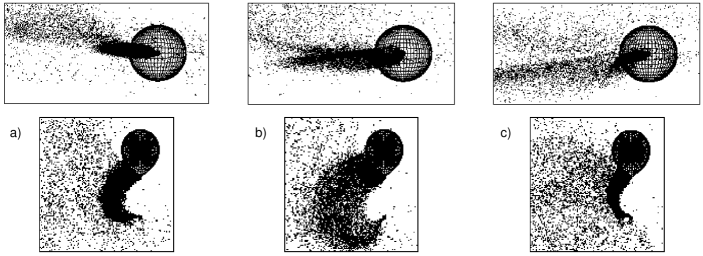
In this model the flow alternates between episodes of accretion and ejection, according to the beat phase between the orbital cycle and the white-dwarf rotation. Accretion events occur when one of the magnetic poles points towards the accretion flow, allowing the blobs to flow down field lines; they thus occur twice per beat cycle. Between each accretion event, when the magnetic poles are on the white-dwarf limb as seen from the approaching flow, the blobs are expelled outwards, and may be swept up by the secondary.
Most of the flow ( 90 per cent) accretes, but the expulsion of the remaining 10 per cent, with a high specific angular momentum, allows the system to maintain equilibrium at a far longer spin period than would be possible in a disc-fed system. Illustrations of the flow in this model are presented in Fig. 5.
6.1 Sideband pulsations in the diamagnetic-flow model
Perhaps the biggest difficulty in applying this model to EX Hya and V1025 Cen is that it predicts an accretion rate modulated on the beat cycle (e.g. fig. 3 of King & Wynn 1999), whereas the hard-X-ray lightcurves of both stars are modulated only at the spin frequencies (e.g. Córdova, Mason & Kahn 1985; Hellier et al. 1998). The current models calculate only the blob-accretion rate and don’t yet predict X-ray lightcurves — this would involve factors such as the optical depth in the accreting regions, which could modulate the flux at the spin frequency. However, the lightcurve would still be expected to show the hallmarks of discless accretion, namely pulsations at , – and/or – (e.g. Wynn & King 1992), whereas none of these are seen in the 2 keV X-ray lightcurves of either star. This argument is supported by V2400 Oph, an IP which is almost certainly discless, whose X-ray lightcurve is dominated by the beat pulse (Buckley et al. 1997; Hellier & Beardmore 2002).
Having said the above, the simple magnetic-drag prescription adopted in the current model may not be appropriate close to the white dwarf, since it ignores magnetic pressure and Kelvin–Helmholtz instabilities. Also, the equilibria of EX Hya and V1025 Cen require only 10 per cent of the flow to be ejected back towards the secondary. It is thus conceivable that the bulk of the flow circularizes into a azimuthally symmetric, structure around the white dwarf, which could then result in a dominant spin-cycle pulsation. In particular, if there were a range of blob densities, the denser blobs would be less affected by the field, and circularise into a disc more easily. The equilibrium could then be sustained by the ejection of less-dense blobs.
Optical beat-cycle pulsations are less diagnostic, since they can be created by other mechanisms, including the irradiation of structure fixed in the orbital frame by spin-pulsed X-rays. As discussed in Section 5.2, this is likely to explain the optical beat-frequency pulsation seen in V1025 Cen, and applies equally well to the diamagnetic-blob model. Again, the 0.7 per cent difference in the observed frequency from the true frequency requires that the illuminated structure changes location from day to day — and might be expected as the stream is being buffeted by a varying magnetic force. On the other hand, the detection of the 1860-s optical pulsation identified with 2( – ) strongly supports the diamagnetic-blob model. The key feature of this model, ejection events twice per beat cycle, offers a straightforward explanation of an optical 2( – ) periodicity.
6.2 Tomographic comparison
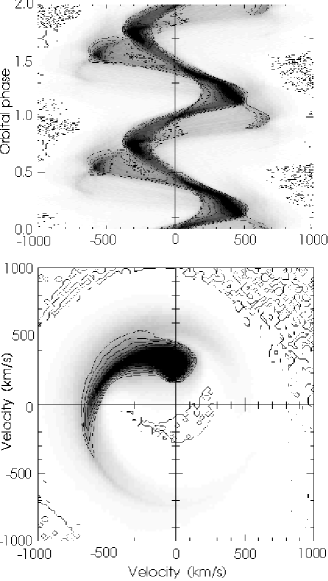
The diamagnetic-blob model can be used to predict line profiles simply by adding up the number of blobs in each velocity bin. Although this ignores all radiative transfer effects, it is still a useful comparison with the data. Fig. 6 shows the trailed spectra from the model, computed for an inclination of 90∘, along with an orbital-cycle tomogram. The trailed spectrum shows similarities with the data in Fig. 3, in that both have a lower-velocity S-wave accompanied by higher-velocity emission phased 0.2–0.3 earlier.
In the tomogram both the data and the model show a ‘hook’ structure, which is brightest near the secondary, and curls anti-clockwise before petering out in the lower-right quadrant. Note that the velocities of the hook feature in the model are lower than expected for disc emission, since they arise from material being ejected back towards the secondary. If V1025 Cen is at a relatively high inclination, so that the factor is 1, then the model and observed velocities match well.
This similarity in tomograms is, along with the explanation for the long spin period, the strongest evidence for a discless flow in V1025 Cen. However, as discussed above, a discless flow is dependent primarily on the beat cycle, rather than the orbital or spin cycles. Thus we can go further and compare orbital-cycle tomograms that are sampled from particular beat phases, an analysis technique that has been used previously for FO Aqr data (Marsh & Duck 1996).
Before proceeding we should express a strong caveat about any such method. Given a particular orbital and beat phase, the spin phase is entailed. Thus if there are variations that are intrinsic to the spin cycle, from magnetically threaded material near the white dwarf, then these will not smear out in the analysis, but will be systematically folded in, appearing as structure in the orbital tomogram, varying according to the beat phase of the sample.
Thus the beat-phase-resolved orbital tomogram will have superimposed on it the tomogram of the spin cycle (see Hellier 1999 for spin-cycle tomograms of IPs) and this superimposed, spin-cycle tomogram will rotate anti-clockwise as the beat phase of the sample increases. Thus we expect to find changes in the orbital tomogram as a function of beat phase, even if there are no intrinsic variations on the beat cycle! In the case of V1025 Cen, the change over the spin cycle is mainly in equivalent width, rather than velocity, and this will reduce the contamination. In the case of FO Aqr, the lines vary over the spin cycle in both equivalent width and velocity (e.g. Hellier, Cropper & Mason 1990) and the contamination will be severe. More generally, there is no model-independent way of attributing variations to the beat cycle rather than the spin cycle, once these are allowed to be functions of orbital phase.
A further caveat is a standard one applying to tomography, in that it assumes that optical depth effects are not changing the intensity of line emission over the different cycles. From the large changes in equivalent width, particularly over the spin cycle (Fig. 2), we know that this assumption is violated in V1025 Cen.
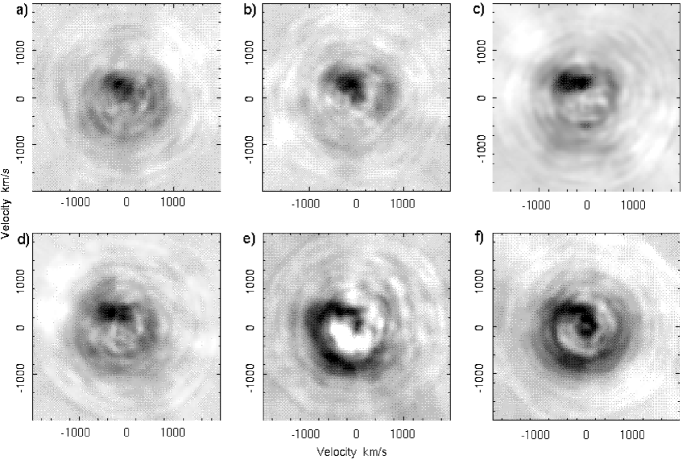
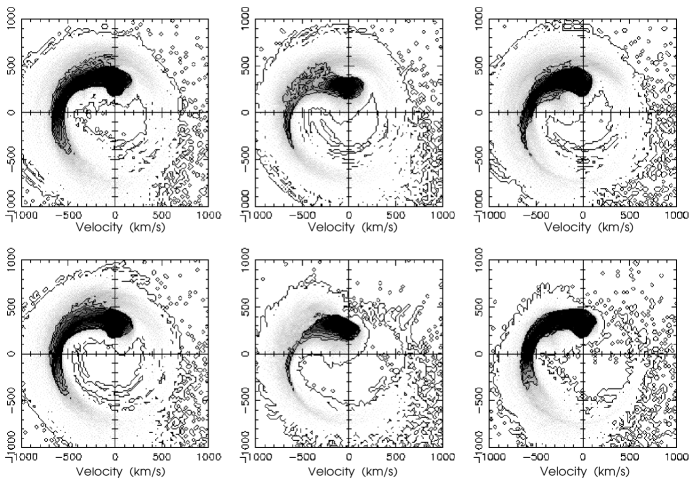
In Fig. 7 we present beat-phase-resolved, orbital-cycle tomograms of the V1025 Cen data. The changes in features over beat phase will be caused by (1) components whose velocities genuinely vary with beat phase, (2) components whose velocities vary with spin phase, and (3) material whose illumination by EUV and X-ray photons is a function of beat phase. For comparison, Fig. 8 shows the equivalent tomograms computed from the diamagnetic-blob model. These will contain the effects 1 and 2 just mentioned, but not effect 3, since irradiation is not included.
Both the data and the model tomograms show the hook-like features varying with beat phase. In the model, the ‘tail’ of the hook becomes less pronounced during the ejection events, re-forming during accretion episodes. This disappearance and re-forming is also seen clearly in the data. However, the variation is greater in the data, and occurs once per beat cycle, whereas in the model it occurs twice per beat cycle. The difference can plausibly be explained by the lack of X-ray irradiation in the model. Given the sinusoidal X-ray spin pulse, regions fixed in the orbital frame will receive a sinusoidal cycle of irradiation over the beat cycle, enhancing the line emission once per beat cycle. Given that irradiation is not included in the model, and the other caveats expressed above, it is not surprising that there are major differences between the data and the current model.
To complete the discussion of the beat-resolved tomograms (Fig. 7) we should consider how they could be interpreted in the partial-disc model. The emission near velocity (0, 300) km s-1, seen at all beat phases, would likely be from the secondary star. The ‘hook’ feature would be due to the stream flowing from the Lagrangian point, colliding with the disc (near velocity –500, 400 km s-1), and then overflowing the disc (moving to the lower-left quadrant of the tomogram). The fact that the velocities in the lower-left quadrant are only about half those of a free-falling stream means that the overflowing stream would have to be slowed by its interaction with the disc, though this is in line with theoretical findings (Armitage & Livio 1998).
The stream would be illuminated once per beat cycle by the spin-pulsed X-ray beam, and this would explain why it is seen only for particular beat phases. However, we don’t have an ephemeris for the X-ray pulse and so cannot reliably predict which phases these are.
7 Conclusions
We have presented phase-resolved spectroscopy of the intermediate polar V1025 Cen. We summarise here the strengths and weaknesses of the two models proposed for this system.
7.1 Partial-disc model
The strengths of the model are: (1) Disc-fed accretion explains an X-ray lightcurve varying only at the spin period. (2) The line-profile variations can be plausibly explained by invoking stream–disc overflow, in a manner seen in SW Sex stars (although a weak X-ray beat pulsation might then be expected). (3) The beat-resolved tomograms can be interpreted as showing structure from the stream overflowing the disc, illuminated once per beat cycle by the X-ray beam.
The weaknesses are: (1) There is no explanation for the anomalously long spin period of V1025 Cen, except to claim that the system is not in equilibrium. (2) There is no easy explanation for the 1860-s optical pulsation.
7.2 Discless model
The strengths of the model are: (1) Explains the long spin period of V1025 Cen. (2) Explains the hook-like features in the tomograms, and the changes in the feature over beat-cycle phase (though there are still differences with the data). (3) Explains the 1860-s optical pulsation as ejection events occurring at 2( – ). The main weakness is the fact that the X-ray lightcurve varies only at the spin frequency, and not at the orbital and beat frequencies, which argues against stream-fed accretion.
7.3 Further work
The summary above shows that we can’t yet decide between the two models. Note that there is also a scenario in which both may be ‘right’: if V1025 Cen had been discless for most of the past 106–107 y, this would explain the long spin period, even if a disc had formed more recently.
Observations needed to make further progress include a determination of the inclination of V1025 Cen, allowing us to match the observed line velocities to the models. Developments to the theory could include the addition of radiation processes to the diamagnetic-blob model, allowing a better comparison with line profiles, and computations of the predicted X-ray lightcurves. Also useful would be deeper searches for polarisation, following the initial work by Buckley et al. (1998). In the diamagnetic-flow model the field is likely to be an order-of-magnitude stronger than in a disc-fed system of the same orbital period (fig 7 of King & Wynn 1999), and further the polarised light would not be diluted by a bright disc, leading to a greater likelihood of detecting polarisation in these systems than in most IPs.
References
- [] Allan A., Hellier C., Buckley D. A. H., Beardmore, A. P., 1999, in Hellier C., Mukai K., eds, Annapolis Workshop on Magnetic Cataclysmic Variables, ASP Conf. Ser., 157, p57
- [] Armitage P. J., Livio M., 1996, ApJ, 470, 1024
- [] Armitage P. J., Livio M., 1998, ApJ, 493, 898
- [] Beardmore A. P., Mukai K., Norton A. J., Osborne J. P., Hellier C., 1998, MNRAS, 297, 337
- [] Buckley D. A. H., Cropper M. Ramsay G., Wickramasinghe D. T., 1998, MNRAS, 299, 83
- [] Buckley D. A. H., Haberl F., Motch C., Pollard K., Schwarzenberg-Czerny A., Sekiguchi K., 1997, MNRAS, 287, 117
- [] Córdova F. A. Mason K. O., Kahn S. M., 1985, MNRAS, 212, 447
- [] Dhillon V. S., Marsh T. R., Jones D. H. P., 1997, MNRAS, 291, 694
- [] Hellier C., 1991, MNRAS, 251, 693
- [] Hellier C., 1993, MNRAS, 265, L35
- [] Hellier C., 1996, ApJ, 471, 949
- [] Hellier C., 1999, ApJ, 519, 324
- [] Hellier C., 2001, Cataclysmic Variable Stars, Springer–Verlag, Heidelberg
- [] Hellier C., Beardmore A. P., 2002, MNRAS, in press
- [] Hellier C., Beardmore A. P., Buckley D. A. H., 1998, MNRAS, 299, 851
- [] Hellier C., Mason K. O., Cropper M., 1990, MNRAS, 242, 250
- [] Hellier C., Mason K. O., Rosen S. R., Cordova F. A., 1987, MNRAS, 228, 463
- [] Hellier C., Robinson E. L., 1994, ApJ, 431, L107
- [] Jablonski F., Busko I. C., 1985, MNRAS, 214, 219
- [] King A. R., 1993, MNRAS, 261, 144
- [] King A. R., Wynn G. A., 1999, MNRAS, 310, 203
- [] Marsh T. R., Duck S. R., 1996, NewA, 1, 97
- [] Marsh T.R., Horne K., 1988, MNRAS, 235, 269
- [] Thorstensen J. R., Ringwald F. A., Wade R. A., Schmidt G. D., Norsworthy J. E., 1991, AJ, 102, 272
- [] Warner B., 1995, Cataclysmic Variable Stars, Cambridge University Press, Cambridge
- [] Wynn G. A., 2001, in Boffin H., Steeghs D., Cuypers J., eds, Astrotomography, Springer–Verlag, Heidelberg, p155
- [] Wynn G. A., King A. R., 1992, MNRAS, 255, 83
- [] Wynn G. A., King A. R., 1995, MNRAS, 275, 9
- [] Wynn G. A., King A. R., Horne K., 1997, MNRAS, 286, 436