-process elements in the Galaxy: a possible GAIA contribution
Abstract
The sensitivity of stellar spectra to /Fe abundance changes is investigated with the aim to be detected photometricly and employed for scientific goals of the GAIA mission. A grid of plane parallel, line blanketed, flux constant, LTE model atmospheres with different [/Fe] ratios was calculated. As a first step, the modelled stellar energy fluxes for solar-type stars and giants were computed and intercompared. The spectral sensitivity to /Fe abundance changes is noticeable and has to be taken into account when selecting photometric filters for GAIA. The Ca ii H and K lines and Mg i b triplet are the most sensitive direct indicators of /Fe abundance changes.
keywords:
Galaxy evolution, photometric techniques, orbiting observatory GAIA1 Introduction
The evolution of a galaxy is closely related with a gradual chemical enrichment. The enrichment and spatial distribution of the chemical elements depend on various galactic and stellar processes. In particular, the star formation (SF) history, the time delay between SF and the enrichment of the interstellar medium (ISM), the metal dependency of the nucleosynthesis, the galactic gas flows, and the mixing processes in the ISM are important. Since the individual elements are produced at various sites and on different time scales, the observed abundances are very useful in describing galactic evolution. The main archeological tracers of the chemical evolution are the elements produced on a short time scale ( years) by massive stars ending as core-collapse supernovae (here called SN II) and on a longer time scale ( years) by Type Ia (SN Ia) supernova events. SNe II contribute to the enrichment of the interstellar medium mainly with elements produced by the capture of -particles (-elements) and from the -process, and SNe Ia predominantly produce elements belonging to the Fe peak. Consequently, one of basic tools to constrain the evolution of a galaxy is the analysis of relations between ratios of [-element/Fe] and Fe abundances [Fe/H]111In this paper we use the customary spectroscopic notation [X/Y] for stars born at different times and in different parts of a galaxy. E.g., the theoretical evolutionary model of the Milky Way galaxy recently proposed by Chiappini et al. (2001) predicts a slight decrease with distance in the average [/Fe] ratios in stars born in the Galactocentric distance range 4–10 kpc and an increase with distance of this ratio in the range 10–18 kpc.
A first glance at the temporal behavior of -elements shows that most of the metal-poor stars in the Galaxy appear to have been formed with enhanced abundances of oxygen and other -elements (i.e., Ne, Mg, Si, S, Ar, Ca and Ti). For stars with [Fe/H], the mean value of [/Fe] lies between and , with no discernible dependence on metallicity (cf. Pagel and Tautvaisiene 1995; Samland 1998). A more precise analysis shows that there is a significant population of field stars with [/Fe] (see Fig.4 by Nissen and Shuster, 1997). Surveys by Shuster et al. (1993) and Carney et al. (1996) report evidence for about dex variations in the [/Fe] value at a fixed [Fe/H]. Carney et al. (1997) have found that the high-velocity subgiant with apogalacticon distance over 20 kpc BD has despite to its low metallicity, [Fe/H]=. At the same time there are metal deficient giants with [/Fe] of +0.7 dex as reported by Giridhar et al. (2001). It is important to map the abundance pattern of -elements in the Galaxy and understand the origin of variations.
A central element of the GAIA mission is the determination of the star formation histories, as described by the temporal evolution of the star formation rate, and the cumulative numbers of stars formed in the bulge, inner disk, Solar neighbourhood, outer disk and halo of our Galaxy (Perryman et al., 2001). Such information, together with the kinematic information from GAIA, and complementary chemical abundance information, again primarily from GAIA, may give us the full evolutionary history of the Galaxy. Knowledge of information on /Fe abundance ratious in stars is very important for their age determination (cf. VandenBerg et al., 2000; Salasnich et al., 2000). In our study, a first attempt is made to investigate the sensitivity of stellar spectra to /Fe abundance variations and their detection by GAIA photometry.
2 Model atmospheres with enhanced /Fe ratios
A grid of plane parallel, line blanketed, flux constant, LTE model atmospheres with enhanced /Fe ratios was calculated with the updated version of the MARCS code (Gustafsson et al., 1975) using continuous opacities from Asplund et al. (1997) and including UV line blanketing as described by Edvardsson et al. (1993). The grid contains model atmospheres with effective temperatures , , and [/Fe] . By elements we here mean O, Ne, Mg, Si, S, Ar, Ca and Ti.
3 Sensitivity of stellar spectra to /Fe changes
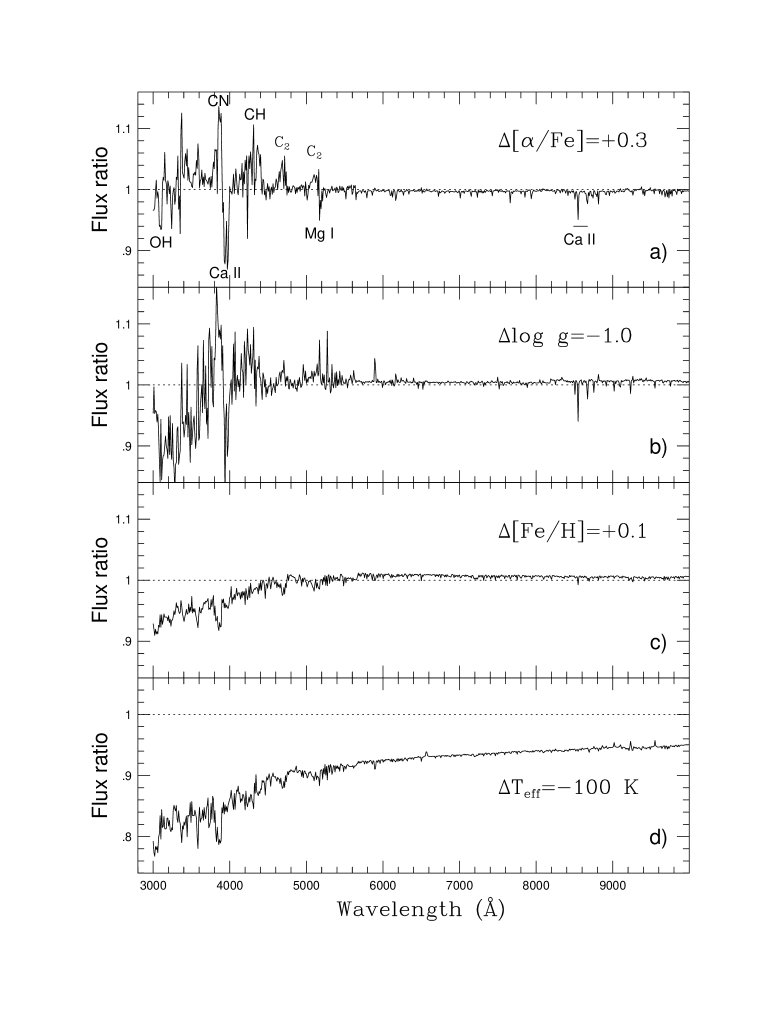

In order to see what spectral regions are most sensitive to /Fe changes, as a first step, we computed stellar surface fluxes with a wavelength sampling of for solar type stars and giants and investigated their ratios. E.g. Fig.1 shows the smoothed ratio of the flux distributions with K, , [Fe/H] and two different [/Fe] ratios: 0.3 and 0.0 dex. The approximate difference of 0.3 dex was found between thin- and thick-disk stars in the solar vicinity (cf. Fuhrmann, 1998; Tautvaišienė et al., 2001). The major wavelength features directly sensitive to /Fe in dwarf stars are the Ca ii H and K lines and the IR triplet, the OH bands around 3100 Å and also the Mg i b triplet region. The latter region is also affected by MgH molecular bands in cool stars. These features are indicated below the curve in panel . There is also an indirect effect of the -element abundances which is seen on the carbon molecular bands: the higher oxygen abundance binds more free carbon into CO, which weakens other carbon molecular bands. The strongest examples are indicated above the curve in panel . It is obvious that these secondary effects are quite dramatic and should be taken into account while using carbon features for photometry.
In Fig.1, the effect of decreasing the surface gravity by 1.0 dex is shown. The effects are qualitatively similar to those of the -element abundance increase in several wavelength regions. A clear difference starts only bluewards from 3800 Å. The strong gravity effect on the Ca ii lines make their use for -element determinations quite dependent on a precise determination. It is interesting to notice the opposite gravity effects on the Ca ii and the Mg i features. The former are radiation damped (thus not pressure-sensitive) and strengthened by the decreasing H- continuous opacity and increasing degree of ionization, while the latter are pressure-broadened and thus weakened both by the weaker gas pressure and by the higher degree of ionization. The sensitivity of the spectrum to changes in overall metallicity and effective temperature are shown in Figs. 1 and 1, respectively. The prominent feature of CN near 3850 Å is dependent on very many parameters, including nitrogen abundances, which are known to vary during stellar evolution.
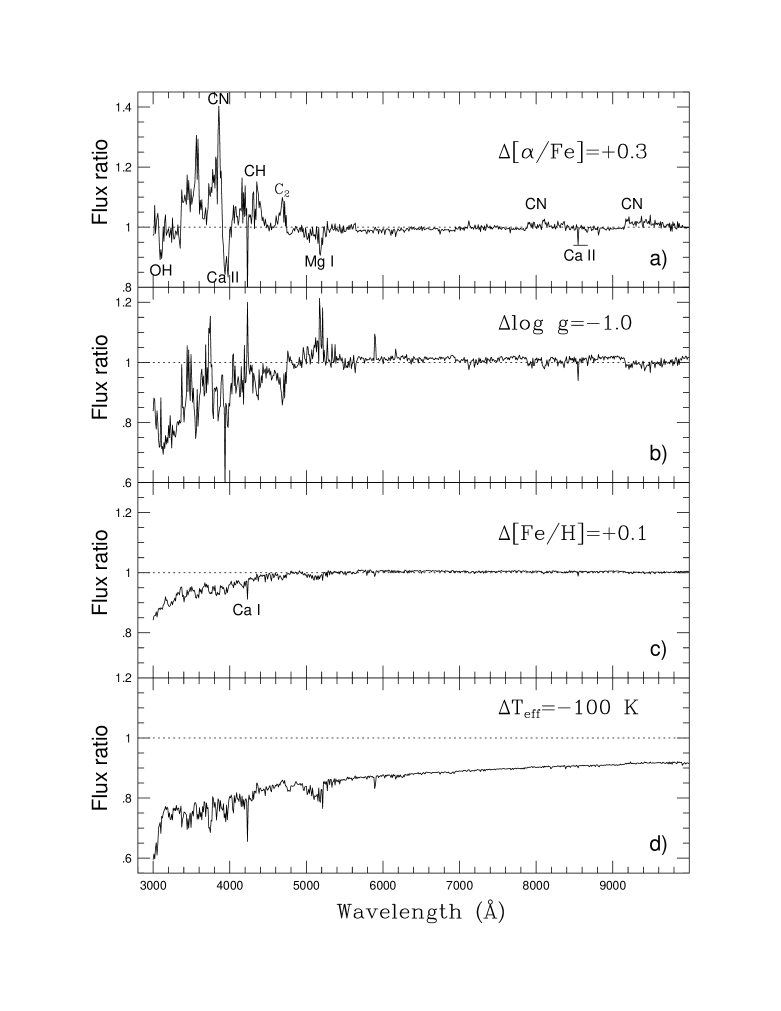
Fig. 2 shows sensitivities of the modelled surface flux ratios to variations in fundamental parameters and chemical abundances for a giant star with the standard model of K, , [Fe/H] and [/Fe]=0.0. As it is seen from the vertical scales, in giants the effects of [/Fe] abundance changes and other parameter variations are considerably larger than for the dwarfs.
In Fig. 3 we display the three medium-band photometric systems proposed for GAIA: 2A by Munari (1998), 3G by Høg et al. (2000), and 1F by Grenon et al. (1999, the wide filters F33, F57 and F67 are not displayed) along with the modelled ratio of surface energy fluxes with for K, and [Fe/H] . Figs. 1 – 3 show that the filter centered at 3450 Å in the 3G system is very useful in determining surface gravities, the filter centered at 3750 Å may evaluate the CN feature, while the filter centered at 4050 Å – the H and K lines. However, the filter at 5150 Å includes both C2, MgH and Mg i b lines which may cause a confusion. Here the filter of the 2A system centered exactly on the Mg i b triplet seems to be better. Filters of the 1F system are quite broad and may cause difficulties in accounting for -element variations. One filter in the GAIA system could be set on the Ca ii IR triplet as well.
The first qualitative investigation of sensitivity of stellar spectra to /Fe abundance variations, presented in this study, indicates that the spectral sensitivity to /Fe abundance changes is noticeable. It has both direct and indirect influence to stellar spectra. A possibility to employ the Ca ii H and K lines and Mg i b triplet might be considered for the photometric determination of /Fe abundance ratios with GAIA photometry. The examples for the dwarf and giant stars with /Fe]=0.3, displayed in Figs. 1 and 2, show that filters of about 80–100 Å width centered on these features could be used. In the interval of the spectrum 3905–4005 Å with the Ca ii lines, the intensity of the spectrum drops down by 0.08 mag in the dwarf and by 0.11 mag in the giant. In the interval 5160–5240 Å with the Mg i b triplet, the intensity of the spectrum drops by 0.02 mag and 0.05 mag, respectively. Assuming the end-mission photometric GAIA accuracy and three slots of filters (ESA, 2000), from the Ca ii lines, the accuracy of [/Fe] might be preserved for the giant (with parameters under consideration) down to about 17.0 mag and for the dwarf down to about 16.3 mag. From the Mg i b triplet, the same accuracy of dex might be preserved for the giant down to about 17.3 mag and for the dwarf down to about 15.6 mag. In case the accuracy of dex is also acceptable, the stars of 17.9 and 16.7 mag could be investigated using the Ca ii lines and stars of 18.2 and 16.5 mag using the Mg i b triplet, correspondingly.
The work presented in this paper marks the beginning of a large work to be done in preparations for the photometric investigation of -elements in the Galaxy. Under the assumption of known effective temperature, metallicity and surface gravity, the carbon, nitrogen and -element abundances might be determined by means of photometric indices as well.
4 Conclusions
The spectral flux sensitivity to /Fe abundance changes is noticeable and has to be taken into account in GAIA photometry. The Ca ii H and K lines and Mg i b triplet are most sensitive direct indicators of /Fe abundance changes and might be used for the photometric determination of -element abundances. The photometric systems proposed for GAIA have to be carefully tested for accounting of the effects of -element abundance variations and their determination.
Photometric classification of stars should provide as many physical parameters as possible. Depending on the accuracy with which the fundamental parameters are known, we should seek to determine abundances not only of -elements but of carbon and nitrogen as well.
Acknowledgements.
We wish to thank Vytautas Straižys, Michel Grenon and Vladas Vansevičius for helpful discussion. G.T. acknowledges support from the Nordic Research Academy (REF NB00-N030) and NATO Linkage grant CRG.LG 972172. B.E. acknowledges support by the Swedish Natural Sciences Research Council (NFR).References
- Asplund et al. (1997) Asplund, M., B. Gustafsson, D. Kiselman and K. Eriksson. Astron. Astrophys., 318:521, 1997.
- Carney et al. (1996) Carney, B.W., J.B. Laird, D.W. Lathman and L.A. Aguilar. Astron. J., 112:668, 1996.
- Carney et al. (1997) Carney B.W., J.S. Wright, C. Sneden, J.B. Laird, L.A. Aguilar and D.W. Lathman. Astron. J., 114:363, 1997.
- Chiappini et al. (2001) Chiappini, C., F. Matteuci and D. Romano. Astrophys. J., 554:1044, 2001.
- Edvardsson et al. (1993) Edvardsson, B., J. Andersen, B. Gustafsson, D.L. Lambert, P.E. Nissen and J. Tomkin. Astron. Astrophys., 275:101, 1993.
- de Boer et al. (2000) ESA GAIA: Composition, Formation and Evolution of the Galaxy, Consept and Technology Study Report. ESA-SCI(2000)4.
- Fuhrmann (1998) Fuhrmann, K. Astron. Astrophys., 338:161, 1998.
- Giridhar et al. (2001) Giridhar, S., D.L. Lambert, G. Gonzalez and G. Pandey. Publ. Astron. Soc. Pacific, 113:519, 2001.
- Grenon et al. (1999) Grenon, M., C. Jordi, F. Figueras, J. Torra. MG-PWG-002 Tech. Rep. to the GAIA Photom. Working Group, 1999.
- Gustafsson et al. (1975) Gustafsson, B., R.A. Bell, K. Eriksson and Å. Nordlund. Astron. Astrophys., 42:407, 1975.
- Høg et al. (2000) Høg, E., V. Straižys and V. Vansevičius. GAIA Internal Rep. SAG-CUO-78, 2000.
- Munari (1998) Munari U. Baltic. Astron., 8:123, 1998.
- Nissen and Shuster (1997) Nissen P.E. and W.J. Shuster. Astron. Astrophys., 326:751, 1997.
- Pagel and Tautvaišienė (1995) Pagel B.E.J. and G. Tautvaišienė. Mon. Not. R. Astron. Soc., 276:505, 1995.
- (15) erryman, M.A.C., K.S. de Boer, G. Gilmore et al. Astron. Astrophys., 369:339, 2001.
- Salasnich et al. (2000) Salasnich B., L. Girardi, A. Weiss and C. Chiosi. Astron. Astrophys., 361:1023, 2000.
- Samland (1998) Samland M. Astrophys. J., 496:155, 1998.
- Shuster et al. (1993) Shuster, W.J., L. Parrao, M.E. Contreras Martińez. Astron. Astrophys. Suppl. Ser., 97:951, 1993.
- Tautvaišienė et al. (2001) Tautvaišienė G., B. Edvardsson, I. Tuominen, I. Ilyin. Astron. Astrophys., 380:578, 2001.
- VandenBerg et al. (2000) VandenBerg, D.A., F.J. Swenson and D.R. Alexander. Astrophys. J., 532:430, 2000.