AGN-Galaxy Clustering with the Panoramic Deep Fields
Abstract
The AGN-galaxy cross-correlation function of radio-quiet AGN and radio galaxies has been measured with the Panoramic Deep Fields. Colour selection criteria and photometric redshifts have been used to significantly increase the signal-to-noise of the angular cross-correlation function. Radio-quiet AGN environments are comparable to the environments of early-type galaxies at low redshift. The radio galaxy-galaxy spatial cross-correlation function is very strong though large variations are observed from field-to-field. These variations appear to be caused by large-scale-structure on scales comparable to the field-of-view. The distribution and spatial cross-correlation function of radio galaxies and clusters in the Panoramic Deep Fields is consistent with these objects tracing the same structures at . No evidence is found for evolution of the AGN-galaxy spatial cross-correlation function across the redshift range observed.
National Optical Astronomy Observatory, 950 N. Cherry Ave., P.O. Box 26732, Tucson, Arizona 85726, U.S.A.
1. The Panoramic Deep Fields
The environments of radio-quiet AGN and radio galaxies have been measured using the Panoramic Deep Fields, a imaging survey of two fields with a depth of and . The wide field-of-view and depth was obtained by coadding SuperCOSMOS scans of UK Schmidt photographic plates. The resulting galaxy catalogues contain more than galaxies per field and thus provide the large sample size required for accurate estimates of AGN-galaxy clustering. As the galaxy catalogues contain more than 1000 objects with spectroscopic redshifts from the NED database, the polynomial fitting technique of Connolly et al. (1995) was used to estimate photometric redshifts for all galaxies with and -band detections. The B1950 coordinates of the field centres are (SGP field) and (F855 field). Access to the galaxy catalogue and cutout images are available via http://astro.ph.unimelb.edu.au/data/.
2. Radio-quiet AGN
The environments of radio-quiet AGN were measured using the Panoramic Deep Fields galaxy catalogues and 109 selected AGN with spectroscopic identifications from La Franca et al. (1999) and Croom et al. (2001). Galaxy clustering is a function of restframe colour so the galaxy sample was split into red (early-type) and blue (late-type) subsamples which were selected using the colour of a non-evolving Sbc template as a function of and the galaxy photometric redshifts.
AGN-galaxy clustering was measured using the angular cross-correlation function. The spatial cross-correlation function was then determined with Limber’s equation (Limber 1954), the angular cross-correlation function, AGN spectroscopic redshifts and the smoothed distribution of galaxy photometric redshifts. A thorough description of the techniques and their application to the SGP field is provided by Brown, Boyle & Webster (2001). The clustering of blue galaxies around radio-quiet AGN is weak and was detected with low signal-to-noise resulting in poor constraints on the radio-quiet AGN-blue galaxy spatial cross-correlation function.
The signal-to-noise of the angular cross-correlation function is decreased by AGN-galaxy pairs which are not physically associated with each other. For objects with good redshift estimates, it is possible to increase the signal-to-noise of the angular cross-correlation function by excluding object pairs which can not be physically associated. While the photometric redshifts of blue galaxies have errors comparable to the redshift estimate, the photometric redshifts of red galaxies have errors of . The radio-quiet AGN-red galaxy angular cross-correlation function determined with AGN-galaxy pairs with redshifts within of each other is shown in Figure 1. A power-law provides a good approximation of the observed clustering in both of the Panoramic Deep Fields. The spatial cross-correlation was approximated by a power-law of the form
| (1) |
where is the spatial separation in comoving coordinates and and are constants. The values of (with ) are and in the F855 and SGP fields respectively. The values of are comparable to those determined for early-type galaxies (Brown, Boyle & Webster 2001). There is no evidence of a systematic increase or decrease of with redshift.

3. Radio Galaxies
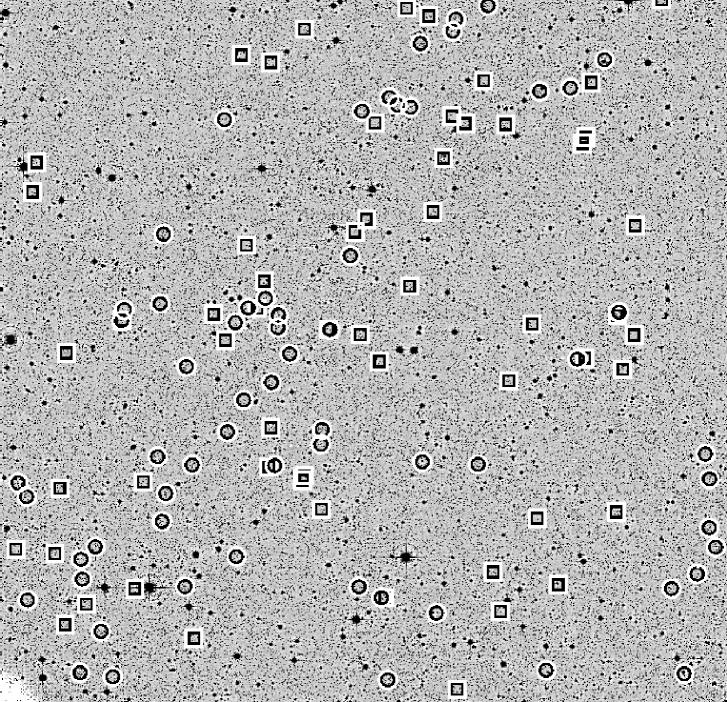
The environments of radio galaxies were measured using 230 radio galaxies from Brown, Webster & Boyle (2001). The radio galaxy-galaxy angular cross-correlation function is significantly stronger than the radio-quiet AGN-galaxy cross-correlation function. However, estimates of the value of vary by a factor of between the SGP and F855 fields. A possible cause of the variations from field-to-field is large-scale-structure. The cluster catalogue of Brown, Webster & Boyle (2002) shows structures with sizes comparable to the field-of-view. Figure 2, a comparison of the distribution of radio galaxies and clusters in the F855 field, shows radio galaxies and clusters tracing the same large-scale-structure across the field.
The radio galaxy-cluster spatial cross-correlation function is extremely strong with and values of and in the F855 and SGP fields respectively. The strength of the clustering is consistent with radio galaxies tracing the same structures as clusters. As with radio-quiet AGN, there is no evidence of significant evolution of with redshift.
4. Summary
The Panoramic Deep Fields have been used to measure the AGN-galaxy cross-correlation function for radio-quiet AGN and radio galaxies. By applying colour selection and photometric redshift criteria, it has been possible to significantly increase the signal-to-noise of the angular cross-correlation function. The clustering of red (early-type) galaxies around selected AGN is comparable to the clustering of early-type galaxies at low redshift. The clustering of galaxies around radio galaxies is strong though large variations in the clustering strength are observed between the two Panoramic Deep Fields. The distribution and spatial cross-correlation function of radio galaxies and galaxy clusters indicate that these objects trace the same large-scale-structures.
References
Brown, M. J. I., Webster, R. L., & Boyle, B. J. 2001, AJ, 121, 2381
Brown, M. J. I., Boyle, B. J.,& Webster, R. L. 2001, AJ, 122, 26
Brown, M. J. I., Webster, R. L., & Boyle, B. J. 2002, MNRAS, in preparation
Connolly, A. J., Csabai, I., Szalay, A. S., Koo, D. C., Kron, R. G., & Munn, J. A. 1995, AJ, 110, 2655
Croom, S. M., Smith, R. J., Boyle, B. J., Shanks, T., Loaring, N. S., Miller, L., & Lewis, I. J. MNRAS, 2001, 322
La Franca, F., Lissandrini, C., Cristiani, S., Miller, S., Hawkins, M. R. S., & MacGillivray, H. T. 1999, A&AS, 140, 351
Limber, D. N. 1953, ApJ, 117, 134