Intracluster Planetary Nebulae
Abstract
We review the progress of research on intracluster planetary nebulae (IPN). In the past five years, hundreds of IPN candidates have been detected in the Virgo and Fornax galaxy clusters and searches are also underway in poorer galaxy groups. From the observations to date, and applying the known properties of extragalactic planetary nebulae, the intracluster light in Virgo and Fornax: 1) is significant, at least 20% of the total cluster stellar luminosity, 2) is elongated in Virgo along our line of sight, and 3) may derive from lower-luminosity galaxies, consistent with some models of intracluster star production. A fraction of IPN candidates are not true IPN, but emission-line sources of very large observed equivalent width ( Å). The most likely source for these contaminating objects are Lyman- galaxies at z 3.1. Follow-up spectroscopy of the IPN candidates will be crucial to discriminate against high redshift galaxies and to derive the velocity field of the intracluster stellar population.
Case Western Reserve University, 10900 Euclid Ave. Cleveland, OH 44106, U.S.A.
1. Introduction
Intracluster stars, stars between the galaxies in a galaxy cluster, are an excellent probe of galaxy and galaxy cluster evolution. They preserve a record of a galaxy cluster’s dynamical history, and are a sensitive measure of the poorly understood processes of galactic mergers, cluster accretion, and tidal-stripping that occur in galaxy clusters (cf. Dressler 1984).
The original concept of intracluster stars was first proposed over fifty years ago (Zwicky 1951), but actually observing intracluster starlight has been extremely difficult. Typically, the surface brightness of intracluster starlight is less than 1% that of the brightness of the sky background, and measurements of this luminosity must contend with the problems presented by scattered light from bright objects and the contribution of discrete sources below the detection limit. These difficulties have made research into intracluster starlight slow and uncertain, though solid detections have been made (for reviews, see Vílchez-Gómez 1999; Feldmeier 2000).
An alternative way to study intracluster light is to search for it in nearby galaxy clusters. Here, it is possible to search for luminous individual intracluster stars, and gain more detailed information on the distribution, metallicity and velocities of intracluster stars than is possible from surface brightness measurements. Planetary nebulae (PN) are one such tracer of the intracluster starlight.
The history of intracluster planetary nebulae (IPN) research begins a decade ago with the first PN survey of the Virgo cluster (Jacoby, Ciardullo, & Ford 1990; hereafter JCF). In this survey of elliptical galaxies, JCF found 11 PN that were much brighter than the expected [O III] 5007 planetary nebulae luminosity function (PNLF) cut-off magnitude. JCF attempted to explain these “overluminous” PN with a number of hypotheses, but none was entirely satisfactory.
The next step involved spectroscopic follow-up of objects from the JCF survey. During a radial velocity survey of PN in the Virgo elliptical galaxy M 86, Arnaboldi et al. (1996) found that 16 of the 19 detected PN velocities were consistent with the galaxy’s mean velocity (vradial = -227 km s-1). The other three planetaries had mean velocities of km s-1, more consistent with the Virgo cluster’s mean velocity. Arnaboldi et al. (1996) argued convincingly that these objects were intracluster planetary nebulae, and it is here that the term first enters the literature. Almost simultaneously, the first search for IPN candidates in the Fornax cluster was published (Theuns & Warren 1997), and more detections of IPN candidates in Virgo quickly followed (Méndez et al. 1997; Ciardullo et al. 1998; Feldmeier, Ciardullo, & Jacoby 1998). Additionally, Ferguson, Tanvir and von Hippel (1998) detected intracluster red giant stars (IRGs) in the Virgo cluster using HST. This provided independent confirmation of the IPN results, and allowed for a potential comparison between the two detection methods.
With the help of large CCD mosaics, samples of hundreds of IPN have now been gathered in the Virgo and Fornax clusters (Fig 1., Feldmeier 2000; Arnaboldi et al. 2002). IPN candidates are easily identified as stellar sources that appear in a deep [O III] 5007 image, but completely disappear in an image through a filter that does not contain the [O III] line. Originally, searching for such objects was done manually, but now is done through automated methods (Feldmeier 2000; Arnaboldi et al. 2002)
2. Why study IPN?
IPN are a useful tracer of intracluster stars for a number of reasons. First, since PN are a normal end-phase of stellar evolution, the distribution of PN in a stellar population should closely follow the spatial distribution of normal stars. Second, because a large portion () of the total light of a bright PN is emitted in a single emission line at 5007 Å, radial velocities of the IPN can be obtained, and dynamical information gained. The utility of planetary nebulae as dynamical probes will be covered by others (see Arnaboldi, Freeman, Mathieu, this conference), but it’s important to stress that the only way to obtain dynamical information about intracluster starlight is through IPN observations. Finally, since PN follow a well-determined luminosity function, it is possible to obtain some information on the three-dimensional structure of intracluster stars.
For the remainder of this paper, we will focus on obtaining the amount of intracluster luminosity using the IPN as a tracer. This aspect directly compares to models of intracluster starlight, and is the area where the greatest progress has been made thus far.
3. Obtaining an intracluster luminosity from IPN
In principle, determining the amount of intracluster luminosity from the observed numbers of IPN is straightforward. Theories of simple stellar populations (e.g., Renzini & Buzzoni 1986) has shown that the bolometric luminosity-specific stellar evolutionary flux of non-star-forming stellar populations should be stars-yr-1-, nearly independent of population age or initial mass function. If the lifetime of the planetary nebula stage is yr, then every stellar system should have PN-. If we also assume that the [O III] 5007 PNLF follows the well studied form: (Ciardullo et al. 1989), we can determine the total expected number of IPN in a region, and therefore, the luminosity, from observations. Due to observational constraints, we calibrate our IPN observations using the quantity , the number of PN up to 2.5 magnitudes below the luminosity function cutoff, per stellar bolometric luminosity. The parameter is approximately one-tenth of , or PN-
In practice, the process is more complicated. There are several effects that must be accounted for before the best estimate of intracluster luminosity can be obtained. Fortunately, each of these effects also gives us an opportunity to learn more about the properties of the underlying intracluster stellar population. We now discuss each of these effects.
4. Line-of-sight effects
In a distant galaxy, theory and observations show that PN follow a well-defined [O III] luminosity function (Ciardullo, this conference). However, in the galaxy cluster environment IPN are not found at the same distance: they are spread out substantially along our line-of-sight. This distorts the observed luminosity function and introduces a significant uncertainty in the derived amount of intracluster luminosity. From modeling (Feldmeier, Ciardullo, & Jacoby 1998), we have found that the amount of intracluster luminosity found for a particular region can vary by a factor of three between a model where all IPN lie at the same distance, and a model where they are distributed uniformly in a spherical configuration. Therefore, to determine the true amount of intracluster starlight, we must also learn the line-of-sight density of the IPN.
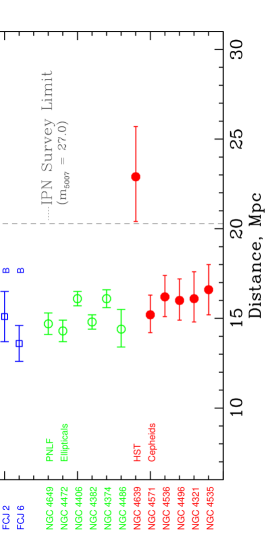
Fortunately, the line-of-sight density of IPN is of considerable scientific interest. Figure 2 shows the distance to each IPN observed field in Virgo compared to that found from the galaxies, assuming that the brightest IPN candidate in each field is near the PNLF cutoff magnitude, M = -4.48. The most obvious feature of the IPN upper limit distances is that there is a noticeable systematic offset in distances between IPN fields in subclumps A & B in Virgo. This is most likely due to the structure of the Virgo cluster. Observations by Yasuda, Fukugita, & Okamura (1997) and others find that the galaxies of subclump B have a mean distance modulus mag more distant than those of subclump A, in agreement with the upper limit distances shown here.
The next most obvious feature is the relatively small distance to all of the fields in subclump A. The median distance of these fields is approximately 12 Mpc, much smaller than the mean distance to Virgo found through PNLF observations of ellipticals and HST observations of Cepheids. The reason for this discrepancy is that all Virgo IPN surveys have a selection effect: objects on the near side of the cluster are much more likely to be found than those on the far side. Therefore, the 12 Mpc distance is representative of the front edge of the cluster, and not of the cluster core. This result naturally explains the “overluminous” PN found by JCF. These PN were not overluminous at all, but instead were significantly closer than the other PN. When we compare the cluster depth found to the angular size of Virgo, we find that Virgo is elongated along our line of sight, perhaps by a factor of two. This result has been found before (e.g., Yasuda, Fukugita, & Okamura 1997), but to independently confirm it through the IPN data is encouraging.
5. The true production rate of IPN
Although theory predicts a constant rate between the number of planetaries and bolometric stellar luminosity, observations tell a different story. Ciardullo (1995) found that in a sample of elliptical galaxies the observed rate never exceeded PN- but was often less, up to an order of magnitude, with higher luminosity galaxies having smaller values of . Why this occurs is not entirely clear: it is believed that as a stellar population ages or becomes metal-rich, not all stars undergo the PN phase (e.g., Ciardullo, Jacoby & Feldmeier 1994) Since the total amount of intracluster luminosity found is inversely proportional to , a large systematic error in the luminosity can be introduced if this effect is not accounted for.
To correct for this effect, we have made additional IRG observations of Virgo’s core using HST (Durrell et al. 2002). The numbers of red giant stars are another determinant of the total luminosity of a stellar population, and therefore we can directly measure from the Virgo cluster environment. By comparing the numbers of IPN in a field surrounding the HST field, we find a preliminary value of PN- (Durrell et al. 2002). This value has an additional systematic uncertainty: there is evidence for a non-random spatial distribution in the IPN (Feldmeier 2000), and the angular sizes of the HST field and the IPN field differ greatly. However, the value for strongly implies that the bulk of the IPN came from lower-luminosity galaxies, and not giant ellipticals (M; Ciardullo 1995). This is consistent with the “galaxy harassment” models of Moore et al. (1996), who predicted that most intracluster light would originate from lower luminosity galaxies.
6. Background Contamination
Finally, not all IPN candidates that are detected photometrically are bona-fide IPN. Although spectroscopic follow-up observations clearly shows that many IPN candidates are genuine, there are also a significant number of contaminating sources (Kudritzki et al. 2000; Freeman et al. 2000). These contaminants must be removed before we can derive a luminosity for the intracluster stars.
Ultimately, the only definitive way to separate the two classes of objects is to perform follow-up spectroscopy: true IPN must also have the other emission lines found for planetary nebulae, the brightest being the [O III] 4959 line and the Balmer lines. So far, only a small fraction () of the hundreds of IPN candidates have any follow-up spectroscopy at all, and of those, only a handful have enough signal-to-noise to see multiple emission lines in a single spectrum.
However, we can statistically account for the contribution of the contaminants to IPN surveys by using control field techniques. From a survey of 0.13 square degrees of blank regions far away from any galaxy cluster, and using identical procedures as our IPN surveys, we have found a total of nine IPN-like objects down to a limiting m5007 magnitude of 27.0 (Ciardullo et al. 2002). When we compare this density to the density of our Virgo and Fornax surveys, we find a contamination rate of 20% for Virgo and 50% for Fornax. The difference in contamination rate is primarily due to distance: Fornax is more distant than Virgo, and hence further down the contaminating source luminosity function.
What are the contaminating objects? In order for an object to masquerade as an IPN, it must have a very high observed equivalent width ( Å), because we require IPN candidates to be completely absent in our off-band exposures. From the equivalent widths, and spectroscopy (Kudritzki et al. 2000), the most likely source for the majority of the IPN contamination are Lyman- galaxies at redshifts near 3.1, where the Lyman- 1215 line is Doppler-shifted into our [O III] filter. Other possibilities include type II quasars at high redshift (e.g., Norman et al. 2002), and very rare high equivalent width [O II] emitters at (Stern et al. 2000). These contaminants are also now being found in normal PN galaxy surveys (e.g., Méndez et al. 2001).
7. Luminosity Results
After correcting for the three effects above, we can now derive the fraction of intracluster luminosity found from the IPN. After averaging the results from all of our fields, assuming a single distance for the IPN, a value of PN-, and contamination rates of 20% for Virgo and 50% for Fornax, we find that at least 20% of all stars lie between the galaxies of Virgo and Fornax. The above assumptions are all conservative, in order to minimize the amount of intracluster starlight necessary to explain the data.
The fractional results from the IRG observations are smaller than the IPN results (10–20%; Ferguson, Tanvir, & von Hippel 1998; Durrell et al. 2002), but are consistent within the errors. Other intracluster light observations of more distant clusters (e.g., Bernstein et al. 1995) find larger fractions for the amount of intracluster light, up to 50%. This could be due to systematic errors between the various methods, or due to differing galaxy cluster properties such as richness. More data will be needed to resolve this issue.
8. Do IPN vary from “normal” PN?
For most of this paper, we have focused on what the properties of PN imply about intracluster starlight. What effects, if any, does the intracluster environment impose on the nebulae themselves?
One possibility is that due to the large velocities ( km s-1) between the IPN and the intracluster medium, the expanding nebulae might fragment due to Rayleigh-Taylor instabilities (e.g., Soker, Borkowksi, & Sarazin 1991). The nebulae would therefore be highly aspherical (e.g., Villaver, Manchado, & García-Segura 2000). Unfortunately, it is unlikely that this effect could be observable. There may be additional effects on the IPN, due to the hot intracluster medium, but detailed nebular modeling of the IPN is sorely needed.
9. The Future
In the near future, there will be large samples of IPN candidates in the nearby clusters of Virgo, Fornax, and Ursa Major, and completed surveys in the much poorer M81 and Leo I groups of galaxies. Continued comparisons between IPN and IRG data sets will be very useful. As we have already shown, IPN and IRG observations strongly complement each other: IPN surveys can map out the distribution and kinematics of the intracluster stars, while HST IRG measurements at specific locations in clusters can provide strong constraints on the age and metallicity of the intracluster stars.
As the surveys continue, spectroscopic follow-up observations will become critical to obtain velocities of the IPN, and to separate them from the contaminating sources. With deep observations using 8-m class telescopes, we can obtain nebular abundances of the IPN, and compare them to PN of the Milky Way.
I would like to thank the organizing committee for inviting me to give this presentation. This work has been done in collaboration with Robin Ciardullo, George Jacoby, Patrick Durrell, Kara Krelove, and Steinn Sigurdsson. I would also like to thank Magda Arnaboldi, Ken Freeman, Rolf Kudritzki, & Roberto Méndez for their assistance and many useful discussions. Travel support was given through the American Astronomical Society International Travel Grant.
References
Arnaboldi, M., et al. 1996, ApJ, 472, 145
Arnaboldi, M., et al. 2002, AJ, in press
Bernstein, G.M., et al. 1995, AJ, 110, 1507
Ciardullo, R. 1995, IAU Highlights of Astronomy, 10, ed. I. Appenzeller p.507
Ciardullo, R. 2002, ApJ, in press
Ciardullo, R., Jacoby, G.H., & Feldmeier, J.J. 1994, BAAS, 185, 5216
Ciardullo, R., et al. 1998, ApJ, 492, 62
Ciardullo, R., Jacoby, G.H., Ford, H.C., & Neill, J.D. 1989, ApJ, 339, 53
Dressler, A. 1984, ARA&A, 22, 185
Durrell, P.R., et al. 2002, ApJ, in press
Feldmeier, J.J. 2000, Ph.D. Thesis, Penn State University
Feldmeier, J.J., Ciardullo, R., & Jacoby, G.H. 1998, ApJ, 503, 109
Ferguson, H.C., Tanvir, N.R., & von Hippel, T. 1998, Nature, 391, 461
Freeman, K.C., et al. 2000, in Galaxy Dynamics: From the Early Universe to the Present, 389.
Jacoby, G.H., Ciardullo, R., & Ford, H.C. (JCF) 1990, ApJ, 356, 332
Kudritzki, R.-P., et al. 2000, ApJ, 536, 19
Méndez, R.H., et al. 1997, ApJ, 491, L23
Méndez, R.H., et al. 2001, ApJ, 563, 135
Moore, B., et al. 1996, Nature, 379, 613
Norman, C.A. et al. 2002, ApJ, in press - available as astro-ph 0103198
Renzini, A. & Buzzoni, A. 1986, in Spectral Evolution of Galaxies, 195
Soker, N., Borkowski, K.J., & Sarazin, C.L. 1991, AJ, 102, 1381
Stern, D., Bunker, A., Spinrad, H., & Dey, A. 2000, ApJ, 537, 73
Theuns, T., & Warren S.J. 1997, MNRAS, 284, L11
Villaver, E., et al. 2000, Rev. Mex. Ast. Astrof. Conf. Ser., 9, 213
Vílchez-Gómez, R. 1999, in The Low Surface Brightness Universe, 349
Yasuda, N., Fukugita, M., & Okamura, S. 1997, ApJS, 108, 417
Zwicky, F. 1951, PASP, 63, 61