Water maser emission in IC 342
The detection of 22 GHz water vapor emission from IC 342 is reported, raising the detection rate among northern galaxies with IRAS point source fluxes 50 Jy to 16%. The maser, associated with a star forming region 10–15″ west of the nucleus, consists of a single 0.5 km s-1 wide feature and reaches an isotropic luminosity of 10-2 L⊙ (=1.8 Mpc). If the time variability is intrinsic, the maser size is cm (0.5 mas) which corresponds to a brightness temperature of 109 K. The linewidth, luminosity, and rapid variability are reminiscent of the 8 km s-1 super maser in Orion-KL. A velocity shift of 1 km s-1 within two weeks and subsequent rapid fading is explained in terms of a chance alignment of two dense molecular clouds. Observations at 22 GHz toward Maffei 2 are also reported, yielding a 5 upper limit of 25 mJy for a channel spacing of 1.05 km s-1.
Key Words.:
Galaxies: individual: IC 342, Maffei 2 – Galaxies: starburst – ISM: molecules – masers – Radio lines: ISM1 Introduction
Isotropic luminosities of extragalactic 22 GHz masers span a huge range (see e.g. Ho et al. ho87 (1987); Koekemoer et al. koeke95 (1995); Braatz et al. braatz96 (1996)), from (the ‘kilomasers’ consistent with the most intense masers seen in our Galaxy) to 10 – 500 (the ‘megamasers’, found in LINERs and Seyfert 2s) and up to 6000 (the ‘gigamaser’ in TXS 2226-184). Interferometric observations, when available, show that the most luminous sources arise from the nuclear region of their host galaxies, from circumnuclear tori, from entrained material near the surface of the nuclear jet, or by ambient gas amplifying the continuum emission of the jet. The weaker masers often mark locations of high mass star formation (for M 33, IC 10, and M 82, see e.g. Huchtmeier et al. hucht78 (1978); Henkel et al. henkel86 (1986); Baudry & Brouillet baundry96 (1996)). The nature of the kilomasers in NGC 253 and M 51 (see Ho et al. ho87 (1987); Nakai & Kasuga nakai88 (1988)) remained an enigma for more than a decade. Recently, however, it has been shown that the maser in M 51 is of nuclear origin (Hagiwara et al. hagi01 (2001)), suggesting that there might be a family of as yet unexplored ‘weak’ H2O sources located near the nuclear engine of Seyfert 2 and LINER galaxies.
Extragalactic H2O masers are preferentially detected in nearby galaxies that are bright in the infrared (Braatz et al. braatz97 (1997)). While nuclear masers are of obvious interest, non-nuclear kilomasers are also important for a number of reasons: these sources allow us to pinpoint sites of massive star formation, to measure the velocity vectors of these regions through VLBI proper motion studies, and to determine true distances through complementary measurements of proper motion and radial velocity (e.g. Greenhill et al. greenhill93 (1993)). We have therefore observed the nearby spiral galaxies IC 342 and Maffei 2, both of which exhibit prominent nuclear bars and strong molecular, infrared, and radio continuum emission (e.g. Hurt & Turner hurt91 (1991); Hurt et al. hurt93 (1993); Turner & Ho turner94 (1994); Henkel et al. henkel00 (2000); Meier et al. meier00 (2000); Meier & Turner meier01 (2001); Schulz et al. schulz01 (2001)). In the following we report the results of our observations.
2 The observation and image processing
Effelsberg
The line of H2O (rest frequency: 22.23508 GHz) was observed with the 100-m telescope of the MPIfR at Effelsberg111The 100-m telescope at Effelsberg is operated by the Max-Planck-Institut für Radioastronomie (MPIfR) on behalf of the Max-Planck-Gesellschaft (MPG). toward IC 342 and Maffei 2. The full width to half power beamwidth was 40″. A dual channel HEMT receiver provided system temperatures of 200 K on a main beam brightness temperature scale. The observations were carried out in a dual beam switching mode with a beam throw of 2′ and a switching frequency of 1 Hz. Flux calibration was obtained by measurements of W3(OH) (for fluxes, see Mauersberger et al. mauer88 (1988)). Gain variations as a function of elevation were taken into account and the calibration error is expected to be no more than 10%. The pointing accuracy was always better than 10″.
VLA
On May 12, 2001, IC 342 was observed with the Very Large Array222The National Radio Astronomy Observatory is a facility of the National Science Foundation operated under cooperative agreement by Associated Universities, Inc. (VLA) in its B configuration. We observed with a single IF using full polarimetric information. The source 0538+498 was used as flux calibrator. The nearby point source 0224+671 was used for phase and bandpass calibration. ‘Referenced pointing’ was performed during the observations (for details, refer to http://www.aoc.nrao.edu/vla/html/refpt.shtml).
The data were Fourier-transformed using natural weighting to produce a spectral line data cube, encompassing the central 100″ of IC 342. The 103 channels used, out of the 128 observed, cover a range in velocity of 8 km s-1 centered at 16 km s-1 LSR (the velocity of the line detected at Effelsberg). No continuum subtraction was needed. The data were deconvolved using the CLEAN algorithm (Högbom hoegbom74 (1974)). The restoring beam is and the rms noise per channel is 10 mJy, consistent with the expected thermal noise.
3 Results
3.1 Time variability
Our single-dish observations towards Maffei 2 yielded no detection, with a 5 upper limit of 25 mJy (channel spacing: 1.05 km s-1; velocity range: –250 km s-1 +230 km s-1; epoch: Apr 3, 2001; position: = 02h 41m 552, = +59 36 11).
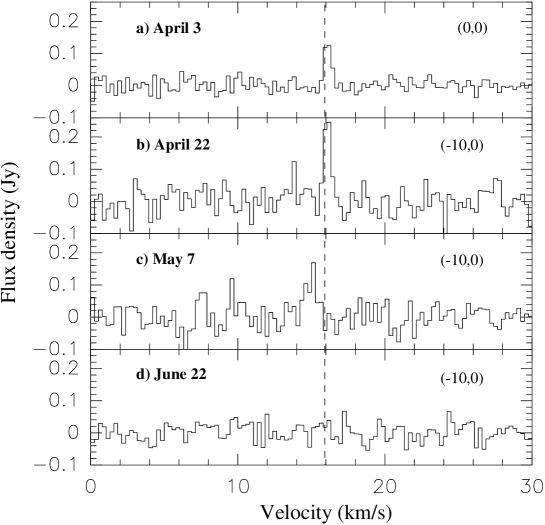
On April 2, 2001, we obtained the first definite detection of water vapor emission in IC 342333Water masers in IC 342 were previously reported by Huchtmeier et al. (hucht78 (1978)) well outside the nuclear region. However, their spectrum from IC 342-4 was not shown and its velocity (–54 km s-1) is highly ‘forbidden’ (there is no H i at this velocity; see e.g. Crosthwaite et al. crost00 (2000)), while the spectral profile from IC 342-3, peaking at –52 km s-1, looks tentative. If the feature is real, an association with the galactic Perseus arm cannot be excluded. (see also Sect. 4.1). During the next night the detection was confirmed with a velocity resolution sufficient to resolve the line profile (Fig. 1a). The detected feature lies at = 16 km s-1 and has a linewidth of 0.5 km s-1; on April 2, no other component was seen at velocities –175 km s-1 +310 km s-1 (channel spacing: 1.05 km s-1; 5 noise level: 16 mJy). A high line intensity (100 mJy) and good weather conditions allowed us to map the emitting region. Fig. 2 shows the spectra taken towards six positions near the center of the galaxy. On April 22, observations were performed towards the offset position (–10″,0″), close to the peak position inferred by the map. The flux density had almost doubled (compare Figs. 1a and b) which is more than the expected 20% increase for a point source located 10″ off our previously observed (0″,0″) position. Further measurements were performed on May 7 (Fig. 1c). The peak and integrated intensities are smaller and the velocity of the line is blue-shifted by 1 km s-1. Unfortunately, no emission above 30 mJy (3 level; 0.08 km s-1 channel spacing) was detected in the 22 GHz VLA B-array data taken on May 12. This fading by at least a factor of 3 within 5 days implies a size scale of cm ( 900 AU) or 0.5 mas at a distance of 1.8 Mpc (McCall et al. mccall89 (1989); see also Sect. 4.3); the corresponding brightness temperature is 109 K. The most recent spectrum was obtained on June 22 at Effelsberg (Fig. 1d). Confirming the VLA result, no maser signal was seen above 30 mJy (3; channel spacing: 1.05 km s-1).
Offset positions, on-source integration times, Gaussian fit parameters, and H2O luminosities assuming isotropic emission (see e.g. Henkel et al. henkel98 (1998)) are given in Table 1.

| Obs. Date | Tel. | BW | Vel. Res. | Luminositye) | |||||
|---|---|---|---|---|---|---|---|---|---|
| (″,″) | (min) | (MHz) | (km s-1) | (Jy) | (km s-1) | (L⊙) | |||
| 02 Apr 2001f) | (0,0) | EFF | 180 | 40 | 1.05 | – | 16.16 (0.03) | – | (8.30.6)10-3 |
| 03 Apr 2001 | (–40,0) | EFF | 30 | 20 | 0.07 | 0.070.03 | 16.15 (0.09) | 0.61 (0.28) | (3.21.0)10-3 |
| 03 Apr 2001 | (–20,–20) | EFF | 20 | ” | ” | 0.07 | 310-3 | ||
| 03 Apr 2001 | (–20,0) | EFF | 30 | ” | ” | 0.180.03 | 16.08 (0.03) | 0.49 (0.06) | (6.50.7)10-3 |
| 03 Apr 2001 | (–20,20) | EFF | 30 | ” | ” | 0.100.03 | 16.07 (0.06) | 0.53 (0.13) | (3.90.8)10-3 |
| 03 Apr 2001 | (0,–20) | EFF | 30 | ” | ” | 0.060.02 | 16.06 (0.08) | 0.46 (0.14) | (2.00.6)10-3 |
| 03 Apr 2001 | (0,0) | EFF | 30 | ” | ” | 0.170.02 | 16.14 (0.02) | 0.58 (0.05) | (7.30.6)10-3 |
| 03 Apr 2001 | (0,20) | EFF | 30 | ” | ” | 0.060.04 | 16.15 (0.06) | 0.40 (0.20) | (1.80.6)10-3 |
| 03 Apr 2001 | (20,0) | EFF | 30 | ” | ” | 0.040.02 | 16.14 (0.13) | 0.64 (0.22) | (1.90.7)10-3 |
| 22 Apr 2001 | (–10,0) | EFF | 8 | ” | ” | 0.300.06 | 16.11 (0.04) | 0.54 (0.08) | (12.01.5)10-3 |
| 07 May 2001 | (–10,0) | EFF | 15 | ” | ” | 0.170.05 | 14.98 (0.08) | 0.81 (0.18) | (10.31.9)10-3 |
| 12 May 2001 | VLA | 120 | 0.781 | 0.08 | 0.03 | 1.210-3 | |||
| 22 Jun 2001 | (–10,0)+(0,0) | EFF | 35 | 40 | 1.05 | 0.03 | 1.710-3 | ||
a) The position offset is relative to = 03h 46m 486
and = +68°05′46″
b) (Effelsberg 22 GHz H2O integration time) includes time
for on- and off-source integration
c) Peak fluxes calculated from integrated line intensities divided by linewidths (both
obtained from Gaussian fits using the data reduction software package ‘CLASS’); if no
signal is detected, 3 limits are given for a channel spacing of 0.53 km s-1
(Apr. 3), 0.08 km s-1 (May 12), and 1.05 km s-1 (June 22). Since the data
taken on April 3 were used for the computation of the position of the maser, where only
(presumably negligible) relative calibration errors are relevant, stated errors do not
include absolute calibration errors (10%; see Sect. 2).
d) LSR = Local Standard of Rest
e) Obtained via [/L⊙] = 0.023
[/Jy km s-1] [/Mpc]2, = 1.8 Mpc.
Corresponding luminosity limits refer to = 0.55 km s-1,
the approximate width of the H2O feature. Errors do not include the estimated
calibration uncertainty of 10% (see Sect. 2 and footnote c).
f) Velocity resolution too coarse to determine meaningful values for the
peak flux density and linewidth
3.2 Maser position
Fitting a synthetic Gaussian to the data taken on April 3 (see Table 1 and Fig. 2), i.e. minimizing the sum of the difference squared between calculated and observed peak and integrated flux densities, we can obtain an accurate position of the emitting region: = 03h 46m 463, = +68°05′46″. This is 13″ to the west of our center position (see Table 1) that coincides with the optical nucleus and the 2m peak (van der Kruit kruit73 (1973); Becklin et al. becklin80 (1980)). The accuracy of the derived maser position is affected by the following uncertainties:
Relative pointing accuracy: On April 3, the average pointing correction was 2″. Using the nearby ultra-compact H ii region W3(OH) as pointing source slightly degraded this pointing accuracy because of the presence of a strong H2O maser 6″ to the west (W3(H2O); e.g. Reid et al. reid95 (1995)). The error introduced by the non-negligible flux contribution of the maser is = 12.
Absolute pointing accuracy: When moving the Effelsberg antenna from W3(OH) to IC 342, there may be an additional pointing offset caused by the change in azimuth and elevation. On April 3, relatively large telescope movements led to a pointing shift of 2″ in azimuth and 4″ in elevation. Considering the improvement in weather conditions when subsequently mapping IC 342, and accounting for the much smaller distance between target (IC 342) and pointing source (W3(OH)), we estimate the absolute pointing error to be = 25.
Spectral noise: For data taken during a single night, relative calibration should be excellent. The relevant factor affecting line intensity ratios is thus noise. Assuming a Gaussian beamshape (beamwidth: 40″), resulting peak and integrated H2O flux densities were calculated for various maser positions. Agreement with the observed intensity limit at the (–20″,–20″) position was taken as an additional check. The resulting positional error is = 4″.
The assumption that all errors can be statistically added yields a total positional uncertainty of .
4 Discussion
4.1 Galactic versus extragalactic H2O emission
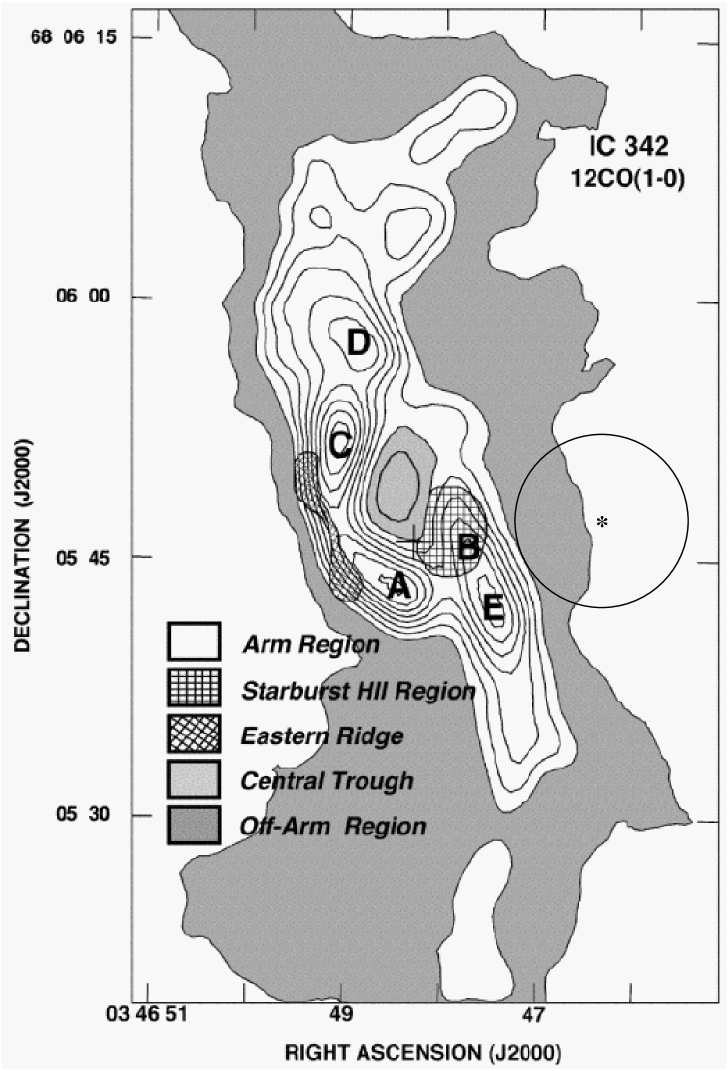
IC 342 is located at a galactic longitude of 138° and latitude 10°, i.e. behind the northern outskirts of the Perseus arm, the Cam OB1 association, and a Local Arm of the Milky Way (e.g. Digel et al. digel96 (1996); Dame et al. dame01 (2001)). Local Standard of Rest (LSR) velocities of the Perseus arm range from –60 to –30 km s-1, consistent with the maser features reported by Huchtmeier et al. (hucht78 (1978)), but significantly removed from the radial velocity of the maser reported here. For the Cam OB1 association and the Local Arm, Digel et al. (digel96 (1996)) find velocities up to –5 and +7 km s-1, still below the measured maser velocity. Furthermore, only a few of the hundreds of known galactic H2O masers have been detected at 10° (e.g. Valdettaro et al. valdettaro01 (2001)). All of these arguments support an extragalactic origin of the maser. In addition, the IC 342 isovelocity contour at 16 km s-1, obtained from CO interferometric data, is consistent with a maser location 10 – 15″ west of its nucleus (e.g. Lo et al. lo84 (1984); Sakamoto et al. sakamoto99 (1999)). This agrees with the position determined in Sect. 3.2. We therefore conclude that the H2O source is associated with the central region of IC 342 (for an illustration, see Fig. 3).
4.2 Search for an optical counterpart
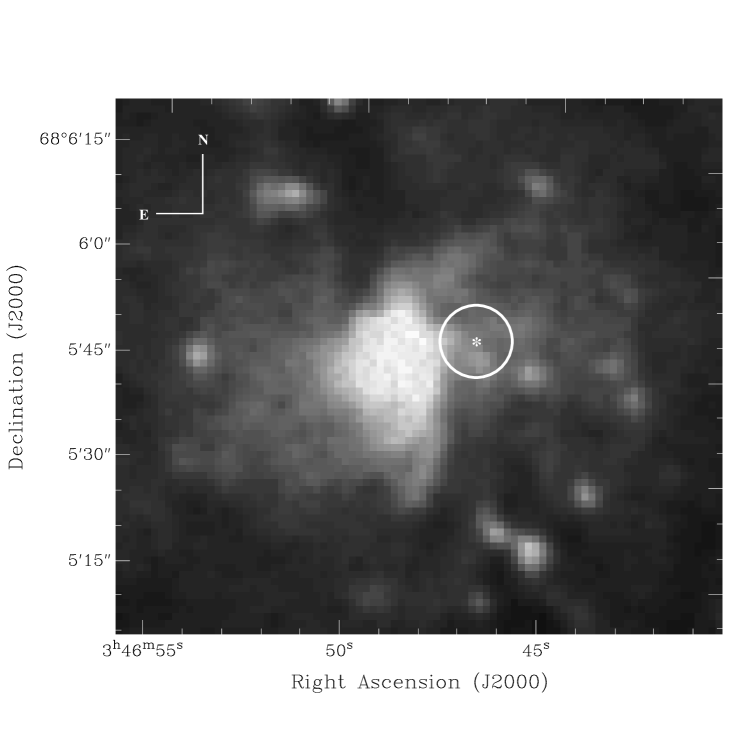
Arising from the central region of IC 342, but being displaced from the nucleus, the H2O maser is likely associated with a prominent star forming region.
Fig. 4 shows an optical B-band image of the central region of IC 342, taken from the XDSS444The Digitized Sky Surveys were produced at the Space Telescope Institute under U.S. Government grant NAGW-2166. The images of these surveys are based on photographic data obtained using the Oschin Schmidt Telescope on Palomar Mountain and the UK Schmidt Telescope. The plates were processed into the present compressed digital form with the permission of these institutions.. The maser emitting region (white circle) coincides with an arc-like structure extending E-S and is associated with a chain of sources that appear to be H ii regions. The presence of optically bright regions, likely sites of star formation activity, close to the maser position is confirmed by an () HST WFPC2 picture555Some of the data mentioned in this paper were obtained from the Multimission Archive at the Space Telescope Institute (MAST). STScI is operated by the Association of Universities for Research in Astronomy, Inc. under NASA contract NAS 5-26555. Support for MAST for non-HST data is provided by the NASA Office of Space Science via grant NAG5-7584 and by other grants and contracts. (see also Meier et al. meier00 (2000)).
4.3 A comparison with other maser sources
Although seen almost face-on (inclination 25°; e.g. Sage & Solomon sage91 (1991)), IC 342 is believed to resemble the Milky Way in many ways. At the commonly assumed 2 Mpc (but see Krismer et al. krismer95 (1995) for a larger distance), the giant molecular clouds near the center of IC 342 have similar linear sizes to the Sgr A and Sgr B2 clouds in our Galaxy. The inner 400 pc of IC 342 and the Galaxy have almost the same far infrared luminosity and the 2m luminosities indicate similar stellar masses (Downes et al. downes92 (1992)).
Does this similarity extend to the 22 GHz maser emission? While there are a number of H2O maser sources in the nuclear region of the Milky Way (Güsten & Downes guesten83 (1983); Taylor et al. taylor93 (1993); Yusef-Zadeh & Mehringer yusef95 (1995)), the emission is dominated by Sgr B2 (e.g. Waak & Mayer waak74 (1974); Morris morris76 (1976); Genzel et al. genzel76 (1976); Elmegreen et al. elmegreen80 (1980); Kobayashi et al. koba89 (1989)). Like the H2O maser in IC 342, Sgr B2 is displaced from the galactic nucleus. The integrated luminosity of its numerous spatial components is L⊙, again not inconsistent with the data from IC 342. The lineshapes are, however, quite different: While Sgr B2 is characterized by a variety of narrow components that have flux densities of a few hundred Jy, the velocity component we have detected in IC 342 is stronger than any related feature by at least an order of magnitude.
Occasionally, prominent galactic star forming regions show narrow (0.5 km s-1) flaring components that are exceptionally bright. Such flares were observed in W 31 A and W 49 (Liljeström et al. lilje89 (1989); Lekht et al. lekht95 (1995)). The prototype of these flares is the 8 km s-1 super maser in Orion-KL (e.g. Garay et al. garay89 (1989)). During several months, the narrow highly linearly polarized maser reached flux densities in excess of 5 MJy. Surpassing the flux of any other velocity component by more than an order of magnitude and reaching a peak luminosity of 10-2 L⊙, the feature seems to be similar to that seen in IC 342. There is another even more impressive narrow flaring maser, which dwarfed neighboring features: the –324 km s-1 component in the nearby irregular galaxy IC 10 (Becker et al. becker93 (1993); Argon et al. argon94 (1994); Baan & Haschick baan94 (1994)). This prominent flare, reaching a luminosity of 1 L⊙ (100 Jy; 0.8 Mpc), lasted for a few years. As unpublished spectra from Effelsberg show, the lineshape of the maser also resembles that of the flaring feature in Orion-KL.
While it is not farfetched to assume that the flares in IC 342, IC 10, and Orion-KL are caused by the same physical phenomenon (but see Argon et al. argon94 (1994)), the actual situation remains unclear. For Orion-KL, observational constraints are quite strict. There is no significant background continuum source and the high intensity seems to suggest saturated emission and a collisional pump (e.g. Garay et al. garay89 (1989)). The small linewidth, however, appears to be incompatible with such a scenario (Nedoluha & Watson nedoluha91 (1991)). Solving this apparent inconsistency requires either very small beaming angles, which are readily obtained by a chance alignment of two masing clouds (e.g. Deguchi & Watson deguchi89 (1989); Elitzur et al. elitzur91 (1991)), or the inclusion of efficient photon scattering, which can account for linewidths 0.5 km s-1 even in the case of saturation (e.g. Elitzur elitzur90 (1990)).
While luminosity, linewidth, and flux variations are reminiscent of the 8 km s-1 super maser in Orion-KL, our H2O profiles show a significant velocity shift between April 22 and May 7 (Figs. 1b and c) that has not been seen in the Orion-KL flaring component. The shift, 1 km s-1 (Table 1; see also Sect. 3.1), is too large to be explained by a change in the relative intensities of the three main hyperfine components (see e.g. Fiebig & Güsten fiebig89 (1989)). A change with time in the peak velocity could originate from a variation in the relative intensity of different emitting regions leading to the swapping-over of velocity peaks (see e.g. Wu et al. wu99 (1999)). Such intensity fluctuations have been found to be sometimes “correlated” with observed time scales ranging from some days up to weeks (intrinsic time scales are more difficult to deduce because they strongly depend on the degree of saturation of the masers; see e.g. Genzel & Downes genzel77 (1977); Rowland & Cohen rowland86 (1986)). Time scales equal or greater than some months are also predicted for maser flux density variations (distinct from flares) due to refractive interstellar scintillations (Simonetti et al. simonetti93 (1993)). However, a simpler model for explaining both the flare and the shift is, in our opinion, that the latter has a kinematic origin. Adopting the previously outlined scenario of a chance alignment of two masing clouds along the line-of-sight, motion of the foreground relative to the background cloud along the plane of the sky and velocity structure in the foreground cloud could explain the observed data. A velocity gradient in the foreground cloud would then first shift the line velocity; once velocities are reached that are not matched within the background cloud, the flux density of the maser rapidly drops. Assuming that the distance between these clouds is 1.8 Mpc and that their relative velocity in the plane of the sky is at the order of 100 km s-1, this implies a cloud velocity gradient of up to 1 km s-1/AU during the time the source was monitored.
An almost identical scenario was proposed by Boboltz et al. (boboltz98 (1998)) to account for the velocity shift of the flaring water maser component at –66 km s-1 in W49N. The similarity in velocity shift ( 0.5 km s-1) and time scale (58 days) of the event in W49N w.r.t the one in IC 342, indicates a common origin.
4.4 Extragalactic maser detection rates
While typical searches for extragalactic maser sources have only yielded detection rates between zero (e.g. Henkel et al. henkel98 (1998)) and a few percent (e.g. Henkel et al. henkel84 (1984); Braatz et al. braatz96 (1996)), there exists one sample with detection rates 10%: These are the northern ( –30°) extragalactic IRAS (Infrared Astronomy Satellite) point sources with 100m fluxes in excess of 50 Jy (for a source list, see Henkel et al. henkel86 (1986); Maffei 2 with 200 Jy should be added to the list). There is a total of 44 galaxies, two ultraluminous galaxies at intermediate distances (NGC 3690 and Arp 220) and 42 nearby sources ( 3000 km s-1). Among these, seven (16%) are known to contain H2O masers in their nuclear region. Two of these contain megamasers (NGC 1068 and NGC 3079), two are possibly nuclear kilomasers (NGC 253 and M 51; for details, see Sect. 1), and three are associated with prominent sites of star formation (IC 10, IC 342, M 82). Among the subsample of 19 sources with 100m fluxes in excess of 100 Jy, five were so far detected in H2O, yielding a detection rate in excess of 20%. Since few deep integrations have been obtained toward these sources, more H2O detections can be expected from this promising sample in the near future.
5 Conclusions
Having detected water vapor emission in the galaxy IC 342, we have obtained the following main results:
-
1.
The maser arises from a location 10–15″ to the west of the center of the galaxy. It is thus a maser associated with a powerful star forming region at a projected distance of 100 pc ( = 1.8 Mpc) from the nucleus.
-
2.
Luminosity (10-2 L⊙), linewidth (0.5 km s-1), and rapid flux density variations are reminiscent of the flaring 8 km s-1 super maser feature in Orion-KL. It seems that we have observed an exceptional outburst of a maser that is usually well below the detection threshhold.
-
3.
Time variability, if intrinsic, yields a maser size of cm-3 (0.5 mas), and a brightness temperature of 109 K.
-
4.
A velocity shift of 1 km s-1 within 16 days and a subsequent decrease in flux density by at least a factor of three within 5 days can be explained by a chance alignment of two dense molecular clouds along the line-of-sight, both of them associated with IC 342.
-
5.
Among galaxies with IRAS point source flux densities of 50 Jy, 16% are now known to contain masers in their inner regions. Since deep H2O integrations have been obtained towards only a few of them, more detections from this sample can be expected in the near future.
Acknowledgements.
We wish to thank P. Diamond for critically reading the manuscript and Nikolaus Neininger for useful discussion. We are also endebted to the operators at the 100-m telescope, and to Michael Rupen and the NRAO analysts, for their cheerful assistance with the observations.References
- (1) Argon A.L., Greenhill L.J., Moran J.M., Reid M.J., et al. 1994, ApJ 422, 586
- (2) Baan W.A., Haschick A.D., 1994, ApJ 424, L33
- (3) Baudry A., Brouillet N., 1996, A&A 316, 188
- (4) Becker R., Henkel C., Wilson T.L., Wouterloot J.G.A., 1993, A&A 268, 483
- (5) Becklin E.E., Gatley I., Matthews K., Neugebauer G., et al. 1980, ApJ 236, 441
- (6) Boboltz D.A., Simonetti J.H., Dennison B., Diamond P.J., et al. 1998, ApJ 509, 256
- (7) Braatz J.A., Wilson A.S., Henkel C., 1996, ApJS 106, 51
- (8) Braatz J.A., Wilson A.S., Henkel C., 1997, ApJS 110, 321
- (9) Crosthwaite L.P., Turner J.L., Ho P.T.P., 2000, AJ 119, 1720
- (10) Dame T.M., Hartmann D., Thaddeus P., 2001, ApJ 547, 792
- (11) Deguchi S., Watson W.D., 1989, ApJ 340, L17
- (12) Digel, S.W., Lyder, D.A., Philbrick, A.J., Puche, D., Thaddeus, P., 1996, ApJ 458, 561
- (13) Downes D., Radford S.J.E., Guilloteau S., Guélin M., et al., 1992, A&A 262, 424
- (14) Elitzur M., 1990, ApJ 350, L7
- (15) Elitzur M., McKee C.F., Hollenbach D.J., 1991, ApJ 367, 333
- (16) Elmegreen B.G., Genzel R., Moran J.M., Reid M.J., Walker R.C., 1980, ApJ 241, 1007
- (17) Fiebig D., Güsten R., 1989, A&A 214, 333
- (18) Garay G., Moran J.M., Haschick A.D., 1989, Apj 338, 244
- (19) Genzel R., Downes D., 1977, A&AS 30, 145
- (20) Genzel R., Downes D., Bieging J., 1976, MNRAS 177, 101
- (21) Greenhill L.J., Moran J.M., Reid M.J., Menten K.M., Hirabatashi H., 1993, ApJ 406, 482
- (22) Güsten R., Downes D., 1983, A&A 117, 343
- (23) Hagiwara Y., Henkel C., Menten K., Nakai N., 2001, ApJ 560, L37
- (24) Henkel C., Güsten R., Downes D., Thum C., Wilson T.L., Biermann P., 1984, A&A 141, L1
- (25) Henkel C., Wouterloot J.G.A., Bally J., 1986, A&A 155, 193
- (26) Henkel C., Wang Y.P., Falcke H., Wilson A.S., Braatz J.A., 1998, A&A 335, 463
- (27) Henkel C., Mauersberger R., Peck A.B., Falcke H., Hagiwara Y., 2000, A&A 361, L45
- (28) Ho P.T.P., Martin R.N., Henkel C., 1987, ApJ 320, 663
- (29) Högbom J.A., 1974, A&AS 15, 417
- (30) Huchtmeier W., Witzel A., Kühr H., et al., 1978, A&A 64, L21
- (31) Hurt R.L., Turner, J.L., 1991, ApJ 377, 434
- (32) Hurt R.L., Turner J.L., Ho P.T.P., Martin R.N., 1993, ApJ 404, 602
- (33) Kobayashi H., Ishiguro M., Chikada Y., Ukita N., et al. 1989, PASJ 41, 141
- (34) Koekemoer A.M., Henkel C., Greenhill L.J., et al., 1995, Nat 378, 697
- (35) Krismer M., Tully R.B., Gioa M., 1995, AJ 110, 1584
- (36) Lekht E.E., Mendoza-Torres E., Sorochenko R.L., 1995, ApJ 443, 222
- (37) Liljeström T., Mattila K., Toriseva M., Anttila R., 1989, A&AS 79, 19
- (38) Lo K.-Y., Berge G.L., Claussen M.J., et al., 1984, ApJ 282, L59
- (39) Mauersberger R., Wilson T.L., Henkel C., 1988, A&A 201, 123
- (40) McCall M.L., 1989, AJ 97, 1341
- (41) Meier D.S., Turner J.L., Hurt R.L., 2000, ApJ 531, 200
- (42) Meier D.S., Turner J.L., 2001, ApJ 551, 687
- (43) Morris M., 1976, ApJ 210, 100
- (44) Nakai N., Kasuga T., 1988, PASJ 40, 139
- (45) Nedoluha G.E., Watson W.D., 1991, ApJ 367, L63
- (46) Reid M.J., Argon A.L., Masson C.R., Menten K.M. et al., 1995, ApJ 443, 238
- (47) Rowland P.R., Cohen R.J., 1986, MNRAS 220, 233
- (48) Sage L.J., Solomon P.M., 1991, ApJ 380, 392
- (49) Sakamoto K., Okumura S.K., Ishizuki S., et al., 1999, ApJS 124, 403
- (50) Schulz A., Güsten R., Köster B., Krause D., 2001, A&A 371, 25
- (51) Simonetti J.H., Diamond P.J., Uphoff J.A., Boboltz D., Dennison B., 1993, in Astrophysical Masers, Lecture Notes in Physics 412, eds. Clegg A.W. & Nedoluha G.E., Springer Verlag, Berlin, p. 311
- (52) Taylor G.B., Morris M., Schulman E., 1993, AJ 106, 1978
- (53) Turner J.L., Ho P.T.P., 1994, ApJ 421, 122
- (54) Valdettaro R., Palla F., Brand J., Cesaroni R., et al., 2001, A&A 368, 845
- (55) van der Kruit P.C., 1973, A&A 29, 249
- (56) Waak J.A., Mayer J.A., 1974, ApJ 189, 67
- (57) Wu Y.-F., Shi J.-R., Wang J.-Z., Jiang D.-R., Huang X.-Y., 1999, ChA&A 23, 454
- (58) Yusef-Zadeh F., Mehringer D.M., 1995, ApJ 452, L17