What can we learn from EPIC X-ray spectra of Seyfert 1 galaxies?
Abstract
The EPIC detectors on XMM-Newton provide the most sensitive broad band ( keV) X-ray spectra to date. Observations of 6 Seyfert 1 galaxies, covering a wide luminosity range, are examined with the aim of identifying the primary X-ray continuum and constraining superimposed emission and absorption features. A soft excess component is seen in every case, but with a spectral form which differs markedly with luminosity across our sample. Current interpretations of the soft excess range from intrinsic thermal emission from the accretion disc to reprocessing of harder radiation absorbed in the disc skin. Visual examination of the broad-band EPIC spectra suggest that the luminosity trend in the observed spectral profiles may be governed primarily by differences in the line-of-sight absorption. In that case the underlying continuum could have a common form across the sample. Examination of spectral features in the Fe K band confirm the common presence of a narrow emission line at 6.4 keV. Modeling of the EPIC spectra above 7 keV is shown to be critical to quantifying (or confirming) a broad Fe K line in at least some cases.
keywords:
Missions: XMM-Newton1 Introduction
For more than a decade after powerful X-ray emission was established as a common property of AGN ([\astronciteElvis et al.1978], Pounds 1977) little insight on the nature of the X-ray source was gained from spectra which were well-modelled by a featureless power law continuum of photon index . The increased spectral bandwidth of the combined ME and LE detectors on EXOSAT yielded evidence that the spectrum of many AGN steepened below keV, the so-called ’soft excess’ (Arnaud 1985, Turner & Pounds 1989). Since that time new X-ray satellites have brought major improvements in spectral resolution, sensitivity and bandwidth, providing X-ray spectra of increasing complexity (and diagnostic potential). The particular strengths of each new mission has led to new areas of research, with the high energy response of Ginga establishing the widespread importance of ‘reflection’ (Nandra & Pounds 1994), ROSAT showing absorption in line-of-sight photoionised matter to be surprisingly strong (Turner et al. 1993), ASCA resolving discrete spectral features, including a broad fluorescent iron K line (Tanaka et al. 1995, Nandra et al. 1997) and BeppoSAX providing uniquely broad bandwidth data.
Chandra and XMM-Newton have now taking this evolution a large step further, with high-throughput grating spectra providing a qualitative improvement in spectroscopic detail. The most striking results to date have been in the detection of complex absorption and emission spectra in the soft X-ray band (e.g. Kaspi et al. 2001) where the 1- or 2-stage photoionisation model of the ‘warm absorber’ (e.g. Reynolds 1997) has been shown to be an inadequate description. Instead, the XMM-Newton and Chandra grating spectra have shown the (often outflowing) material illuminated by the central X-ray source to exhibit a remarkably wide range of ionisation stages (Behar et al. 2001). Interpretation and modelling of these data is already promising a dramatic improvement in mapping the structure, content and dynamics of matter in the nuclear region of Seyfert galaxies. Conversely, modelling the temperature and ionisation of this gas will provide a unique measure of the total ionising flux, including the often dominant XUV component invisible from Earth.
To date, less progress has been made in utilising the diagnostic potential of the broader-band spectra from the EPIC cameras on XMM-Newton ; to briefly explore that potential is the purpose of the present paper which brings together EPIC spectra from 6 Seyfert galaxies observed early in the mission and covering the (2-10 keV) X-ray luminosity range erg sec-1.
2 The Seyfert sample
The present sample represents the start of an ambition to develop a ’big picture’ of the X-ray spectra of radio-quiet AGN, to identify general features and trends, and attempt to determine the influence of the ‘primary variants’, namely the luminosity, relative accretion rate and black hole mass. Table 1 lists the sources included in the present sample, in order of X-ray luminosity, together with the dates, exposure time and original status of each observation. Figure 1 shows the broad spectral features for these AGN, in each case plotted as a ratio of the observed EPIC spectrum to a simple power law plus Galactic absorption model. Data from the PN camera are used in all the figures but the analysis and interpretation that follows is also consistent with data from the MOS cameras. For an initial visual comparison all spectra have been fitted in the 2–12 keV band and then extrapolated to the lower limit of the reliably calibrated EPIC data.
Several common features stand out, together with some clear differences and apparent trends. These are discussed in the following sections.
| source | date | exp (ks) | Lxa | b |
|---|---|---|---|---|
| MCG-6-30-15 | 11-07-00 | 53.8 | 0.6 | 1.69 |
| Mkn766 | 20-05-00 | 35.6 | 0.7 | 1.97 |
| NGC5548 | 9-07-01 | 30 | 3.8 | 1.61 |
| NGC5548 | 12-07-01 | 46 | 5 | 1.70 |
| Mkn509 | 25-10-00 | 27 | 14 | 1.64 |
| Mkn509 | 20-04-01 | 30.5 | 22 | 1.74 |
| 1H0419-577 | 4-12-00 | 5.8 | 57 | 1.88 |
| PKS0558-504 | 24-05-00 | 10.2 | 79 | 1.88 |
3 The Soft Excess
As noted earlier, the ‘soft excess’ was first claimed to be a common feature in AGN X-ray spectra from EXOSAT observations of Seyfert galaxies (Turner & Pounds 1989). Subsequent ROSAT observations showed the spectra of AGN were often significantly steeper than below keV, although the evidence of absorption features led to some confusion in the literature between soft spectral slope and excess soft emission. BeppoSAX and now EPIC spectra have removed such ambiguities and confirm that a soft X-ray emission component is indeed a common feature of Seyfert 1 galaxies, as Figure 1 clearly shows.


Interpretation of the soft X-ray emission remains uncertain, however, and indeed may differ across the present small sample of Seyfert galaxies. In general terms the alternatives are primary emission from the accretion disc, representing gravitational energy released by viscosity in the disc, or secondary radiation from the re-processing of hard X-rays in the surface layers of the disc. Clarifying these alternatives is critical to determining where the primary energy release occurs and thereby to understanding better the fundamental mechanism(s) by which AGN produce such powerful X-ray emission. Broad-band observations, particularly from Beppo-SAX, have shown a simple power law to approximately describe the hard continuum spectra of several Seyfert galaxies over two decades in energy, supporting an origin by multiple scattering of low energy (disc) photons by high energy (coronal) electrons. However, it remains unclear, in general, whether the primary (gravitational) energy is released directly into the corona (eg by magnetic field reconnection) or as thermal emission from the accretion disc. In either case the re-absorption of hard coronal X-rays in the disc surface, as in the ‘disc-corona’ model (e.g. Haardt & Maraschi 1991), offers an important feedback mechanism to explain the similarity of power law slopes in many AGN. Attempts to clarify the ‘driver’ in this process by determining ‘lags’ or ‘leads’ between spectral components, have yielded no clear picture. Potentially the most direct indicator - the energy balance of the spectral components - is likely to remain out of reach, since the intrinsic thermal emission from the accretion disc will peak in the (unseen) XUV band for AGN with central black holes masses greater than .
Visual examination of the present EPIC spectra offers some interesting insights. For the lower luminosity sources in our sample (MCG-6-30-15, Mkn 766, and possibly NGC 5548) the soft excess rises very sharply below keV. This ‘sharp soft excess’ (SSX hereafter) is indicative of an atomic feature, which - combined with the need for emission above the power law extrapolation - is consistent with an interpretation as hard X-rays re-processed in the inner disc. Such an explanation has been made for MCG-6-30-15 and Mkn 766, with RGS spectra apparently showing strong relativistically broadened recombination lines of OVIII, NVII and CVI (Branduardi-Raymont et al. 2001, Sako et al. 2001).
The EPIC soft X-ray spectra of Mkn 509, 1H 0419-577, and PKS 0558-504 are of quite different appearance, with a gradual upward curvature emerging below keV. In the latter 2 sources this gradual soft excess (hereafter GSX) has been interpreted as Comptonised thermal disc emission (Page et al. 2002, O’Brien et al. 2001). The absence of strong discrete spectral features in the corresponding RGS spectra of Mkn 509 and PKS 0558-504 lends important support for this view. (The observation of 1H 0419-577 unfortunately yielded only PN camera data).
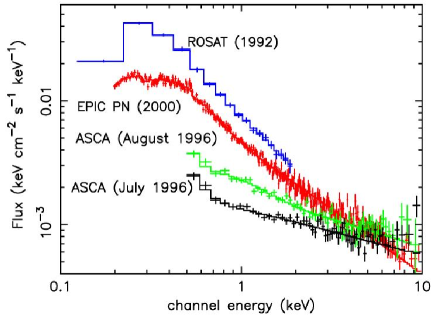
The recent comparison of the EPIC spectrum of 1H 0419-577 with historical data from ROSAT, ASCA and BeppoSAX (Page et al. 2002) provides some of the best evidence to date for the soft X-ray emission being the ‘driver’ of spectral change, with 1H 0419-577 apparently switching over several years between states when the soft X-ray excess was weak or absent, and the more typical bright state observed by XMM-Newton (Figure 2). Significantly the power law component was much harder when the soft flux was weak, implying a photon-starved corona (in the context of the disc-corona model).
NGC 5548 is of intermediate luminosity in the present sample, and has a soft excess whose form lies between those of the above groups. As such it may hold the key to linking the disparate interpretations of the low and high luminosity sources outlined above. The Chandra spectra of NGC 5548 are reported to show many strong absorption lines (Kaastra et al. 2000), and further refinement of the instrument calibration may show that the structure evident in the EPIC ratio plot below keV (Figure 1) is associated with absorption by ionised matter. Such considerations lead to the speculation that the principal cause of the changing shape of the soft excess across the sample is absorption, affecting the broad-band spectrum from keV up to keV (e.g. see Nicastro et al. 1999). If that is so, the observed trend with luminosity would have a natural explanation in terms of the increasing ionisation (and low energy transparency) of a substantial column of absorbing gas, with increasing luminosity.
An implication of this interpretation is that until the total absorption can be modelled in sources such as Mkn 766 and NGC 5548, the strength (and physical nature) of the soft X-ray emission will remain uncertain. Progress will require the simultaneous analysis of well-calibrated spectra from dispersive instruments, such as the XMM-Newton RGS, and broad-band detectors, like EPIC, in order to quantify both line and edge absorption over the observed energy range.
4 Fe K emission line
4.1 Narrow Fe K line
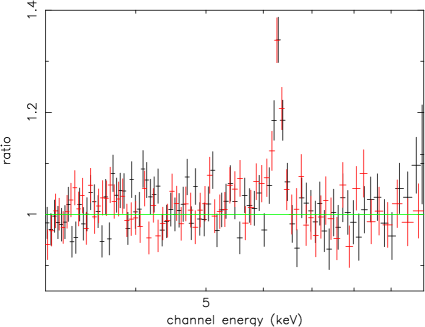
A narrow emission line at 6.4 keV, with equivalent width in the range 50–100 eV is emerging as a common component of Seyfert 1 galaxies (at least for a 2–10 keV luminosity less than erg sec-1). Figure 3 shows the EPIC spectral ratio for NGC 5548 where the narrow line is the most obvious spectral feature in the 2–12 keV band. The interpretation of this line as Fe K fluorescence from cold matter distant from the inner disc region seems clear. Reflection from the putative molecular torus has been suggested by several authors and remains a strong candidate, the apparent weakening of the line for very luminous sources providing circumstantial support in the context of the torus being flattened by radiation pressure. However, it remains possible that a significant fraction of the narrow line is produced at much smaller distances from the central continuum source, with the outer disc and broad line clouds being realistic candidates. A further possibility might be by scattering in a population of ’clouds’ sufficiently dense to survive at small radii (Guilbert & Rees 1988) and perhaps indicated in the recent detections of strong Fe K absorption edges in several XMM-Newton spectra (Boller et al. 2001, Reeves et al. 2002). Just as the broad Fe K line has been heralded as a key diagnostic of strong gravity near the putative black hole, the narrow Fe K line may prove to be a valuable tool for mapping dense matter throughout the nuclear region of AGN. The route to constraining the origin of the narrow Fe K line will be from improved measurements of the line width and flux variability. A recent Chandra measurement has resolved the line in NGC 5548 with FWHM 4500 km s-1 (Yaqoob et al. 2001) suggesting an origin within the BLR. Figure 3 illustrates the narrow line in XMM-Newton data taken days apart, compared in each plot with a simple power fit over the keV band. Intriguingly, the relative intensity of the line appears very similar, while the 2–10 keV flux increased by 40 % between the 2 observations. However, the increase above 7 keV (i.e. in the flux capable of causing the fluorescence) the increase was only 20 %, rendering inconclusive the measured ’increase’ in the narrow Fe K line intensity, from 2.5 (2.0–3.1) to 3.0 (2.3–3.9) .
| continuum | 1.86 | absorption | E | 7.3 keV | ||||
| kT1 | 100 eV | edge | 0.1 | |||||
| kT2 | 210 eV | |||||||
| narrow line | E | 6.38 keV | broad (Laor) | E | 6.4 keV | |||
| 0.1 keV | line | 5 | ||||||
| EW | 90 eV | rin | 1.25 rg | |||||
| rout | 400 rg | |||||||
| warm absorber | 5.9 | 30o | ||||||
| cm-2 | EW | 240 eV |
4.2 Broad Fe K line
It is well known that the shape and strength of the broad component of the Fe K line, so important as a diagnostic of the innermost regions close to the black hole (e.g. Fabian et al. 2000), depends critically on fitting the underlying continuum correctly. In the examples shown in Figure 1 it seems possible to identify the power law component in all cases, except perhaps MCG -6-30-15. In Mkn 766, where a broad Fe K line is widely reported (Nandra et al. 1997, Leighly 1999, Mason et al. 2002), visual examination of the spectral ratio does indicate such a feature. One cautionary remark, however, is to point out the importance of correctly fitting the data above keV. This is not well constrained by XMM-Newton data (and was even less so in ASCA ), but there is some visual indication of absorption above the Fe K edge (Figure 4(a)). Such absorption could be a consequence of ‘reflection’, or may arise in line-of-sight matter, neither of which are as yet very well constrained. It is interesting to note that the inclusion of an absorption edge in the fit to the EPIC data of Mkn 766 (Figure 4(b)) has a significant effect on the parameters of the broad Fe K line, as it lowers the underlying power law index by .
Ignoring an absorption edge, the underlying power law fitted to the data at 2–5 keV and above 7 keV (the typical ASCA recipe) is . A broad line is required to fit the residuals and a good fit (/dof of 733/794) is obtained with a Kerr line at 6.5 keV with EW of eV. Inclusion of an edge at keV and fitting the power law between 2–6 keV and 6.8–12 keV reduces the power law slope to . No broad line is then required, a good fit over the 2–12 keV band being obtained (/dof of 723/795) with just the absorption edge ( keV, ) and a relatively narrow Fe K line (E keV, keV, EW eV). We note that from the XMM-Newton data (and implicitly also for ASCA data) the absorption edge provides the main determinant of reflection, which in this case is consistent with an origin in the ‘cold, distant matter’ responsible for the narrow Fe K line.


It is interesting, finally, to test the ‘prototype’ broad Fe K line Seyfert, MCG-6-30-15 (Tanaka et al. 1995, Iwasawa et al. 1996, Wilms et al. 2001) with a model that allows for the Fe K absorption edge indicated in the XMM-Newton data. Figure 5(a) shows the deviations from a simple power law fit over the 3–12 keV band. As with Mkn 766, an acceptable spectral fit is obtained over this band (/dof of 557/494) with a power law, narrow Fe K line and absorption edge. The best-fit parameters are: a power law of ; a narrow line at keV, with width keV, and EW eV; and an edge of depth at keV (Figure 5(b)). However, a still better fit is obtained (/dof of 511/488) with the addition of an extreme broad component to the Fe K line, at keV, with disc emissivity of and EW of eV, together with a narrow line ( keV, sigma keV, EW eV) and absorption edge ( keV, ). The power law slope is essentially unchanged at . Examination of the residuals of the previous fit (Figure 5 (b)) suggests the broad line is modelling quite subtle curvature in the EPIC data between 3–6 keV.
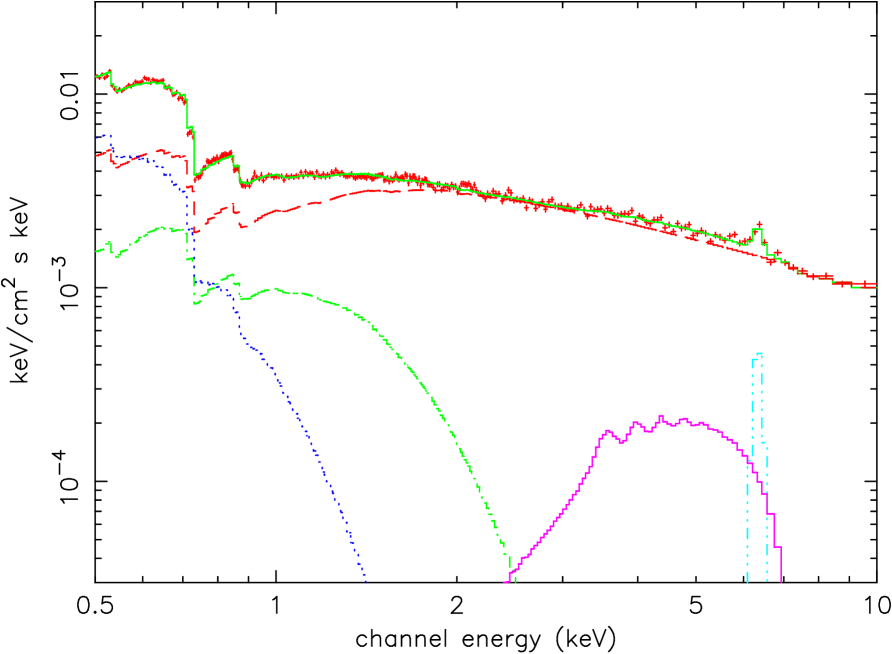
Extension of the latter model over the full EPIC spectrum (0.5–10 keV) also gives a remarkably good fit, where the spectral curvature below keV is modelled by the addition of line-of-sight ionised gas with a column density cm-2 and ionisation parameter (Figure 6). Clearly this fit (summarised in Table 2) is only a crude approximation to the complex spectrum seen in the RGS and Chandra data; however, it is reassuring that an acceptable broad-band fit can be made to this most complex spectrum (see Figure 1), offering the promise of developing self-consistent models of Seyfert X-ray spectra in which the primary X-ray continuum can be resolved from the superimposed absorption and emission features.
5 Summary
The most striking aspect of the range of EPIC spectra displayed in Figure 1 is the presence in every case of a strong soft emission component which causes the X-ray continuum to turn up sharply below 0.7 keV in the lower luminosity sources (SSX), and is evident as a gradual up-turn (GSX), below 3 keV for the high luminosity sources. The form and location of the SSX is strongly suggestive of a link with K-shell oxygen, though - unsurprisingly - the lower resolution EPIC data can not distinguish between the alternative descriptions (relativistically broadened line emission, Sako et al. 2001; complex absorption, Lee et al. 2001) currently being advocated for MCG-6-30-15 and Mkn 766. RGS spectra do confirm the absence of strong absorption in the higher luminosity sources in our sample, Mkn 509 and PKS 0558-504. This leads us to speculate that a broad soft emission component extending up to 3 keV (arising by Comptonisation of cool disc photons) may be common to our sample, but is obscured by increasingly strong absorption from ionised gas for the lower luminosity Seyferts NGC 5548, Mkn 766 and MCG-6-30-15. We emphasise the complementary strengths of broad-band data from EPIC and higher resolution spectra from the RGS in providing the input for improved modelling of the primary X-ray continuum and - consequently - of absorption and secondary emission features that carry unique information on the X-ray emission mechanism and nuclear environment in Seyfert galaxies.
One such secondary emission feature, the narrow Fe K emission line at 6.4 keV, is found to be a common property across our sample (apart from the highest luminosity object PKS 0558-504). The EW of 50–100 eV is consistent with reflection from cold, distant matter subtending a solid angle of 1–2 steradians at the hard X-ray source. Line profile and variability studies offer the promise of using this emission line to probe dense cold matter from the outer disc to the molecular torus.
We suggest the broad Fe K line may not be as common, or as strong, as it appeared to be from earlier ASCA observations. A key factor is the need to correctly model the spectrum above 7 keV, where XMM-Newton has improved - though still limited - sensitivity. Also, as spectral fits to the MCG-6-30-15 data show, precise calibration of X-ray optics and detectors is critical to validating measurements of the important broad Fe K line.
Acknowledgements.
We thank Rick Edelson for permission to work on the EPIC data from his GO observation of NGC 5548 and to Jorn Wilms for access to the GT observation of MCG-6-30-15. Grateful thanks are also due to the dedicated efforts of the many colleagues who delivered and continue to sustain the powerful XMM-Newton Observatory. XMM-Newton is funded by the European Space Agency with support from NASA. The EPIC instrument was funded by the UK, Germany, France and Italy and developed by a team led by Martin Turner.References
- [\astronciteArnaud et al.1985] Arnaud, K.A., et al. , 1985, MNRAS, 217, 105
- [\astronciteBehar et al.2001] Behar, E., Sako, M., Kahn, S.M, 2001, ApJ, 563, 497
- [\astronciteBoller et al.2001] Boller, Th., et al. , 2001, astro-ph 0110367
- [\astronciteBranduardi-Raymont et al.2001] Branduardi-Raymont, G., et al. , 2001, A&A, 365, L140
- [\astronciteElvis et al.1978] Elvis, M., Maccacaro, T., Wilson, A.S., Ward, M.J, Penston, M.V., et al. , 1978, MNRAS, 183, 129
- [\astronciteFabian et al.2000] Fabian, A.C., Iwasawa, K, Reynolds, C.S., Young, A.J., 2000, PASP, 112, 1145
- [\astronciteGuilbert et al.1988] Guilbert, P.W., & Rees, M.J., 1988, MNRAS, 233, 475
- [\astronciteHaardt et al.1991] Haardt, F., & Maraschi, L., 1991, ApJL, 380, L51
- [\astronciteIwasawa et al.1996] Iwasawa, K., et al. , 1996, MNRAS, 282, 1038
- [\astronciteKaastra et al.2000] Kaastra, J., Mewe, R., Liedahl, D.A., Komossa, S., Brinkman, A.C., 2000, A&A, 354, L83
- [\astronciteKaspi et al.2001] Kaspi, S., et al. , 2001, ApJ, 554, 216 A&A, 354, L83
- [\astronciteLee et al.2001] Lee, J., Ogle, P.M., Canizares, P.R., Marshall, H.L., Schulz, N.S., Morales, R., et al. , 2001, ApJL, 554, L13
- [\astronciteLeighly1999] Leighly, K.M., 1999, ApJS, 125, 317
- [\astronciteMason2002] Mason, K., et al. , 2002, these Proceedings
- [\astronciteNandra et al.1994] Nandra, K., & Pounds, K.A., 1994, MNRAS, 268, 405
- [\astronciteNandra et al.1997] Nandra, K., George, I.M, Mushotzky, R.F., Turner, T.J., Yaqoob, T., 1997, ApJ, 477, 602
- [\astronciteNicastro et al.1999] Nicastro, F., Fiore, F., Matt, G., 1999, ApJ, 517, 108
- [\astronciteO’Brien et al.2001] O’Brien, P.T., et al. , 2001, A&A, 365, L122
- [\astroncitePage et al.2002] Page, K., et al. , 2002, MNRAS, in press
- [\astroncitePounds1977] Pounds, K., 1977, Ann.N.Y.Acad.Sci, 302, 361
- [\astronciteReeves et al.2002] Reeves, J.N., et, 2002, X-ray spectrum of PDS 456, in preparation
- [\astronciteReynolds1997] Reynolds, C.S., 1997, MNRAS, 286, 513
- [\astronciteSako et al.2001] Sako, M., et al. , 2001, astro-ph 0112436
- [\astronciteTanaka et al.1995] Tanaka, Y., et al. , 1995, Nature, 375, 659
- [\astronciteTurner et al.1989] Turner, T.J. & Pounds, K.A., 1989, MNRAS, 240, 833
- [\astronciteTurner et al.1993] Turner, T.J. et al. , 1993, ApJ, 419, 127
- [\astronciteWilms2001] Wilms, J., et al. , 2001, astro-ph 0110520
- [\astronciteYaqoob et al.2001] Yaqoob, T., George, I.M., Nandra, K., Turner, T.J., Serlemitsos, P.J., Mushotzky, R.F., 2001, ApJ, 546, 759