A CO Survey of Gravitationally Lensed Quasars with the IRAM Interferometer ††thanks: Based on observations obtained with the Plateau de Bure Interferometer of the Institut de Radio Astronomie Millimétrique, supported by INSU/CNRS (France), MPG (Germany) and IGN (Spain).
Key Words.:
quasars: general - gravitational lensing - quasars:individual: MG0751+2716Abstract. We present the results of a CO survey of gravitationally lensed quasars, conducted with the Plateau de Bure Interferometer over the last three years. Among the 18 objects surveyed, one was detected in CO line emission, while six were detected in the continuum at 3mm and three in the continuum at 1mm. The low CO detection rate may at least in part be due to uncertainties in the redshifts derived from quasar broad emission lines. The detected CO source, the radio quiet quasar MG0751+2716, is quite strong in the CO(43) line and in the millimeter/submillimeter continuum, the latter being emission from cool dust. The integrated CO line flux is Jykms-1, and the total molecular gas mass is estimated to be in the range .
1 Introduction
The measurement of CO line emission in high redshift objects has proven to be a fruitful avenue for investigating the properties of distant quasars and galaxies. Molecular observations address interesting issues such as that of star formation in the early universe and how the presence of a central massive engine can affect the interstellar material in its host galaxy. Detections of CO have shown that quasars share some properties with luminous infrared galaxies, both locally and at high redshift. For example, comparison of the molecular, infrared and optical properties of the Cloverleaf quasar and the infrared galaxy IRAS F10214+4724 (known to harbor a buried quasar seen in polarized light) has demonstrated that these two objects are nearly identical, except in the optical range where the differences can probably be attributed to obscuration/orientation effects (Barvainis et al. 1995). Such findings lend support to theories unifying luminous infrared galaxies and quasars via orientation effects, with high redshift infrared galaxies being the luminous counterparts of local Seyfert 2’s. However, on physical grounds, it also seems likely that IR-selected galaxies and UV-selected quasars may differ in their stage of evolution. There are currently about 15 well-documented detections of molecular gas at high redshift (e.g., Combes 2001), of which at least 9 are gravitationally lensed systems.
The advantages of using an intervening “gravitational telescope” to boost the fluxes are obvious, with estimated magnification factors of up to 100 in the optical. Moreover, differential gravitational effects provide an elegant tool to probe the size and structure of the molecular material within the quasar. For example, a point-like emitting region (rest-frame UV and optical continua from the inner accretion zone), and an extended dusty molecular region (the “torus”) in the quasar will produce, after gravitational effects from the intervening lens, images with different morphologies. Molecular line profiles, reflecting intrinsic geometrical and kinematical properties, can be particularly useful in understanding the extended structure. It should be noted however that a detailed model of the intervening lens must be available to perform the transfer from the image plane (observational data) to the source plane (intrinsic properties of the quasar). We applied this technique for the first time to recover the properties of the molecular torus in the Cloverleaf, a quasar at (Kneib et al. 1998), comparing HST images and IRAM interferometer CO maps (Alloin et al. 1997). The CO-emitting region in the quasar was found to be a disk or ring-like structure orbiting the central engine at a radius between 75 and 100 pc, with Keplerian velocity around 100 km s. The effective resolution resulting from this technique turned out in this case to be about 20 times smaller than the synthesized beam size of the CO interferometer data.
Such significant benefits – flux boosting and increased effective angular resolution – have led us to focus our attention on gravitationally lensed systems and to conduct a CO survey of these objects. Another possible benefit of lensed versus unlensed objects is the potential for higher flux boosting for higher- transitions (differential magnification). Since experience has shown that the best selection criterion for CO detection is the presence of detectable far-IR or submm/mm dust continuum emission, we started with a continuum survey of the known lensed quasars using the IRAM 30m radio telescope and the JCMT (Barvainis & Ivison 2002). A high dust continuum detection rate encouraged us to pursue a CO search with the IRAM interferometer (Guilloteau et al. 1992).
Since this project was started early in the continuum survey, we were not at that time able to make a general selection based upon submillimeter flux. Instead, the sample consisted of most of the then-known lensed quasars having optical redshifts measured to good accuracy. We observed 18 gravitationally lensed quasars, with redshifts in the range .
However, reliable systemic redshifts remain a major difficulty for CO searches at high because currently available redshifts are mostly derived from highly ionized species in the quasar broad line region. As this region is often coupled to a high velocity wind, redshifts derived this way have been found to be blueshifted up to 1200 km swith respect to the systemic velocity of the host galaxy and the molecular environment of the quasar probed by CO measurements. A typical offset is 600 km s, but there is wide dispersion from one object to another. Meanwhile, spectrometer bandwidths in the millimeter domain are too narrow ( km s at 3mm) to fully span this redshift uncertainty using a single central frequency setting. The combination of these two facts makes it likely that some CO lines will be missed in the course of a survey. In the case of the present survey, whenever the quasar redshift was from highly ionized species we applied a 600 km sredshift increment to search for its CO emission. We are fully aware that this offset, although statistically meaningful, may be just incorrect for some individual quasars.
In Sect. 2 we describe the sample of gravitationally lensed quasars and the acquisition and reduction of the interferometer data set. Results, both in CO line emission and in the 1mm and 3mm continua, are also presented in Sect. 2 for the entire sample. In Sect. 3, we discuss the general results of the CO survey, and in Sect. 4 consider the detection of MG0751+2716 in the CO(43) transition in more detail. Conclusions and future prospects are given in Sect. 5.
2 The sample: acquisition and reduction of the CO interferometric data set
The gravitationally lensed quasar sample is presented in Table 1. The coordinates generally refer to the brightest quasar image in the optical. Redshifts have been corrected in some cases using the technique described in the previous section, except for MG0751+2716 where an initial detection allowed refinement of the value to the center of the line in followup observations. The centering frequencies given for the 3mm and 1mm windows correspond to various CO transitions from CO(21) to CO(98), depending on the quasar redshift and the window considered: the targetted CO transitions in the 3mm window are specified for each source in Table 1. The “seeing” estimates correspond to the 3mm data set. Some targets were observed on several different observing runs; seeing values, numbers of antennas, and hours spent per exposure are provided. The observed spectral bandwidth was either 560 MHz or 595 MHz.
Table 2 lists the CO transition observed (3mm), the “channel rms” (rms/beam/100 km s, in mJy), the line flux (for MG0751+2716), and the 3mm and 1mm continuum results. Sufficient sensitivity and bandwidth for line measurements were only available at 3mm. Table 2 also lists 850 m continuum fluxes or upper limits derived from SCUBA observations at the JCMT (Barvainis & Ivison 2002). Note that B1600+434 and B1030+074 are strong radio loud quasars whose millimeter/submillimeter continua are consistent with pure synchrotron radiation. The other submillimeter-detected sources are likely to be dominated by dust emission. The continuum flux ratio between 3mm and 1mm for MG0751+2716 is not typical of dust emission, though the ratio between 1mm and 850 m is. This is probably caused by some residual steep-spectrum synchrotron emission contributing to the 3mm (and to a lesser extent the 1mm) flux.
| Object | RA(2000) | Dec(2000) | z | Seeing | Beam size/PA | Beam size/PA | Antennas | Exposure | ||
|---|---|---|---|---|---|---|---|---|---|---|
| (GHz) | () | () | (GHz) | () | (Hrs) | |||||
| 0047-2808 | 00:49:41.87 | 27:52:25.7 | 3.595 | 100.335 | 1.6;1.0 | 225.661 | 4;5 | 3.5;1.6 | ||
| UM673 | 01:45:17.22 | 09:45:12.3 | 2.730 | 92.706 | 0.75 | 216.260 | 5 | 4.2 | ||
| MG0751+2716 | 07:51:41.46 | 27:16:31.4 | 3.200 | 109.778 | 1.0;1.1;0.6 | 246.898 | 4;3;4 | 3.4;3.6;2.0 | ||
| SBS0909+523 | 09:13:00.76 | 52:59:31.5 | 1.375 | 97.068 | 0.2 | 242.639 | 5 | 4.7 | ||
| RXJ0911+055 | 09:11:27.50 | 05:50:52.0 | 2.807 | 90.831 | 0.7 | 211.886 | 4 | 6.3 | ||
| Q1009-0252 | 10:12:16.09 | 03:07:03.0 | 2.746 | 92.311 | 0.7 | 215.337 | 4 | 3.1 | ||
| J0313 | 10:17:24.13 | 20:47:00.4 | 2.552 | 97.352 | 0.9 | 227.097 | 4 | 4.0 | ||
| B1030+074 | 10:33:34.0 | 07:11:26.1 | 1.535 | 90.942 | 1.1;2.3 | 227.325 | 5;5 | 1.1;3.2 | ||
| HE1104-1805 | 11:06:33.45 | 18:21:24.2 | 2.326 | 103.967 | 1.7 | 242.529 | 3 | 3.2 | ||
| PG1115+080 | 11:18:16.96 | 07:45:59.3 | 1.723 | 84.663 | 0.7 | 211.630 | 4 | 5.8 | ||
| 1208+1011 | 12:10:57.16 | 09:54:25.6 | 3.831 | 95.434 | 0.5 | 214.637 | 4 | 6.3 | ||
| HST14176+530 | 14:17:36.51 | 52:26:40.4 | 3.403 | 104.711 | 0.8;2.0 | 235.501 | 4;5 | 3.7;5.9 | ||
| SBS1520+530 | 15:21:44.83 | 52:54:48.6 | 1.860 | 80.608 | 1.1;0.7;0.7;1.2 | 241.773 | 4;3;5;5 | 4.4;3.8;0.33;2.3 | ||
| B1600+434 | 16:01:40.45 | 43:16:47.8 | 1.589 | 89.045 | 0.2;1.4;2.0 | 222.583 | 5;4;4 | 1.9;6.1;2.9 | ||
| B1608+656 | 16:09:13.96 | 65:32:29.0 | 1.394 | 96.298 | 0.4 | 240.713 | 5 | 3.9 | ||
| 2016+112 | 20:19:18.15 | 11:27:08.3 | 3.282 | 107.670 | 0.7;0.6;1.3 | 242.156 | 5;5;4 | 4.9;2.6;4.9 | ||
| HE2149-2745 | 21:52:07.44 | 27:31:50.2 | 2.033 | 114.011 | 3.6 | 227.938 | 5 | 3.0 | ||
| Q2237+0305 | 22:40:30.14 | +03:21:31.0 | 1.696 | 85.511 | 1.0 | 213.749 | 4 | 5.1 |
| Object | Target line | Line rms | Line flux | 3mm | 1mm | m |
|---|---|---|---|---|---|---|
| (mJy/beam) | (mJy/100kms | (Jykms-1) | (mJy/beam) | (mJy/beam) | (mJy) | |
| 0047-2808 | CO(43) | 3.3 | 0.9 0.9 | na | ||
| UM673 | CO(32) | 2.0 | 0.7 0.5 | na | ||
| MG0751+2716 | CO(43) | 1.9 | 4.1 0.5 | 6.7 1.3 | ||
| SBS0909+523 | CO(21) | 1.1 | 0.5 0.3 | 0.0 1.3 | ||
| RXJ0911+055 | CO(32) | 1.2 | 1.7 0.3 | 10.2 1.8 | ||
| Q1009-0252 | CO(32) | 1.8 | 0.1 0.5 | 0.3 4.0 | na | |
| J0313 | CO(32) | 1.8 | 0.0 0.5 | -6 4 | na | |
| B1030+074 | CO(21) | 3.3 | 184 1.9 | na | na | |
| HE1104-1805 | CO(32) | 6.8 | 1.9 2.0 | na | ||
| PG1115+080 | CO(21) | 1.3 | -0.3 0.3 | -0.9 1.2 | ||
| 1208+1011 | CO(43) | 1.3 | 0.2 0.3 | 4.2 1.9 | ||
| HST14176+530 | CO(43) | 1.2 | 0.1 0.3 | -5 3 | ||
| SBS1520+530 | CO(21) | 1.5 | hint | 0.0 0.2 | -0.5 1.4 | |
| B1600+434 | CO(21) | 1.1 | hint | 25 0.3 | 12.6 2.3 | |
| B1608+656 | CO(21) | 1.5 | hint | 8.1 0.4 | 0.8 2.2 | |
| 2016+112 | CO(43) | 0.8 | 1.8 0.2 | 1.1 1.0 | ||
| HE2149-2745 | CO(32) | 10. | -2.8 2.7 | na | ||
| Q2237+0305 | CO(21) | 1.4 | 0.1 0.35 | -1.9 2.1 |
All of the continuum detections, and the one line detection, are within of the optical positions listed in Table 1, except for two cases. For 2016+112, the offset is and from the observed coordinates. However, checking the NASA Extragalactic Database (NED) we found improved coordinates which are within about of the continuum source in both RA and Dec. In the case of RXJ0911+055, the offset of the continuum source (a mean of the 3mm and 1mm continuum sources) is and . The origin of this offset, which is larger than typical optical position errors, is unknown at present.
3 Results of the CO survey
Out of 18 sources observed, we obtained: (a) one strong CO line emitter, MG0751+2716, detected in CO(43), (b) three marginal detections (to be investigated further) and (c) 14 non-detections. Generally speaking, strong submm emission from dust is a good predictor of strong CO emission. Of the two strongest dust sources, RXJ0911+055 ( mJy) and MG0751+2716 ( mJy), only the latter was detected in CO. The line, with a peak flux of 18 mJy, is one of the strongest known among high- sources. Seven sources had either no measurements or only upper limits at 850 m, but 6 additional sources had moderately strong submm continuum detections in the mJy range.
We believe some CO lines, such as the strong one expected from RXJ0911+055, and some among the intermediate-strength submm sources, may have been missed because of the uncertainty in the redshift of the molecular lines combined with the narrow observing bandwidth. In fact, during our 1999 first search for CO in MG0751+2716, the CO(43) transition was detected on the edge of the bandpass, at a velocity offset of km swith respect to our original guess for molecular emission. Thanks to the strength of this line we were able to identify its presence and obtain new observations at the appropriate frequency, which fully confirmed the 1999 measurement. However, this would not work in the case of fainter CO line emitters. This difficulty will only be fully resolved by using broadband backends in the future. In the meantime, we plan to reobserve at least RXJ0911+055 with flanking bandpasses to cover more redshift space.
Continuum emission was detected at 3mm in 6 targets, with 3 of those also detected at 1mm (one being particularly strong, the radio loud quasar B1030+074).
4 The CO line in MG0751+2716
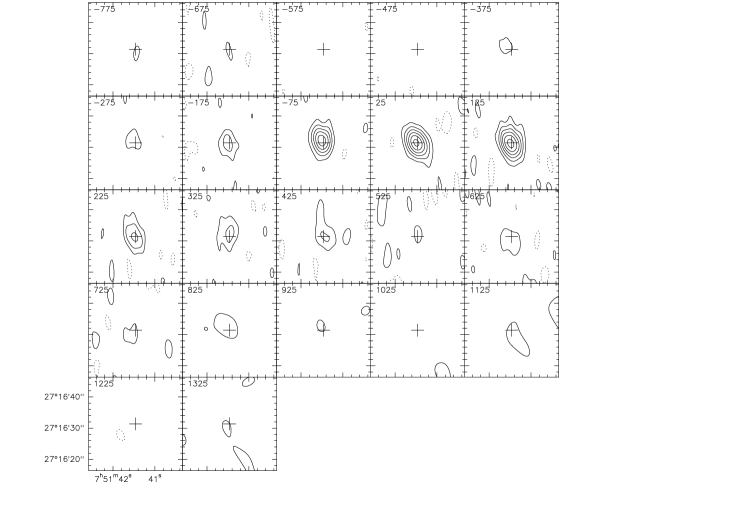
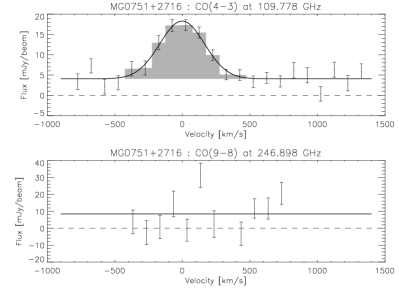
A strong line in the CO(43) transition was detected in MG0751+2761. A set of the channel maps, with velocity steps of 100 km s-1, is shown in Fig. 1 for the CO(43) transition. It convincingly reveals the CO(43) emitting region at a location very close to the quasar optical coordinates (offset by , ). The CO(43) line profile is displayed in Fig. 2. A Gaussian fit provides the following parameters: FWHM of km s-1, peak frequency at GHz (corresponding to a redshift of 3.200), and intensity of Jykm s. The CO(98) transition was not detected in the 1mm window. A Gaussian fit with fixed line width and central position analogous to the CO(43) transition showed only continuum at the position. A local peak close to 100 km sin the object’s velocity frame is below the level. By combining both sidebands of the 1mm receiver, we obtain a continuum detection of mJy.
In order to compute the CO line luminosity and total gas mass, a lensing correction must be applied. In spite of several efforts to model the lens system towards MG0751+2716 (Lehár et al. 1997; Tonry & Kochanek 1999), additional work remains to be done: the lens appears to be a quite complex system which requires more shear than accounted for by the lensing galaxy (identified as G3 in Lehár et al. 1997). This extra shear might come from what appears to be a group or cluster of galaxies, indicated by the large number of galaxies in the field around the quasar. Very recent modeling by J. Lehár and B. McLeod (2001, private communication), based on HST optical imaging, provides an estimated optical magnification of 16.6. While differences between optical and CO/submillimeter net magnifications can be expected in some cases because of the difference in source sizes (subpc versus tens to hundreds of pc), models suggest that for optical magnifications less than about 20 the differences are generally not expected to be large (see Fig. 1 of Barvainis and Ivison 2002, and associated discussion). Therefore, we correct the CO emission for a magnification of factor of 16.6 and derive a line luminosity Kkms-1 pc2 ( km s-1 Mpc-1, ).
The molecular material emitting in the CO(43) transition is most likely close to the quasar, as in the case of the CloverLeaf (Kneib et al. 1998) and APM 08279+5255 (Downes et al. 1999), and it is also probably dense and warm. In order to calculate the total molecular gas mass we have considered two values for the ratio : (Kkms-1 pc2)-1, following Downes & Solomon (1998) for nuclear rings in ultraluminous galaxies, and (Kkms-1 pc2)-1 following Barvainis et al. (1997) for the molecular “torus” in the Cloverleaf. These conversion factors yield a total molecular gas mass in the range .
It is of interest as well to compare the gas mass to the dynamical mass derived from the observed CO line width. With a derived Keplerian velocity of 400/sin() km s-1, and assuming that the molecular gas is located at a radius of 200 pc (see above references for the CloverLeaf and APM 08279+5255), we obtain a lower limit of , consistent with the derived value of .
5 Concluding remarks and future prospects
Though the present survey yielded a low detection rate in CO, there are several new lensed quasar candidates yet to be observed based on their strong 850 m continua, recently discovered in the course of the submillimeter survey by Barvainis & Ivison (2002). Supplementary, expanded-frequency observations of some sources (most notably RXJ0911+055) may turn up more CO detections from the present source list.
As for MG0751+2716, the centimeter radio source has four components connected by arcs (Lehár et al. 1997), and in the optical it appears as a diameter Einstein Ring. A primary driver for this project was to find lensed sources that could be spatially resolved in CO line emission. This is currently possible for MG0751+2716 using the PdBI, and, like the Cloverleaf, reconstruction of the molecular source structure and kinematics on very small angular scales using the lensing properties may prove to be quite interesting.
Acknowledgements.
We warmly thank all the IRAM staff who performed in service mode, with the Plateau de Bure Interferometer, all of the observations related to this project. We also thank Ski Antonucci for important early contributions. Joseph Lehár and Brian McLeod generously provided an estimate of the magnification of MG0751+2716 in advance of publication. DA and RB wish to thank the IRAM institute in Grenoble for hospitality during visits there. The NASA Extragalactic Database (NED) and the CASTLeS compilation of lenses (http://cfa-www.harvard.edu/castles) were used extensively in the course of this work.References
- (1) Alloin, D., Guilloteau, S., Barvainis, R., Antonucci, R., & Tacconi, L. 1997, A&A, 321, 24.
- (2) Barvainis, R., Antonucci, R., Hurt, T., Coleman, P., & Reuter, H.P. 1995, ApJ, 451, L9
- (3) Barvainis R., Maloney P., Antonucci R., & Alloin D. 1997, ApJ, 484, 695
- (4) Barvainis, R., & Ivison, R. 2002, ApJ, in press
- (5) Combes F. 2001, astro-ph/0008456
- (6) Downes D., & Solomon P. 1998, ApJ, 507, 615
- (7) Downes D., Neri R., Wiklind T., Wilner D., & Shaver P. 1999, ApJ, 513, L1
- (8) Guilloteau S., Delannoy J., Downes D. et al. 1992, A& A, 329, 827
- (9) Kneib J.P., Alloin D., Mellier Y., Guilloteau S., Barvainis R., & Antonucci R. 1998, A&A, 329, 827
- (10) Lehár J., Burke B., Conner S. et al. 1997, AJ, 114, 48
- (11) Tonry J., & Kochanek C. 1999, AJ, 117, 2034