Chandra Observation of a kpc Hydrodynamic Instability in the Intergalactic Medium of the Merging Cluster of Galaxies A3667
Abstract
We present results from the combination of two Chandra pointings of the central region of the cluster of galaxies A3667. From the data analysis of the first pointing Vikhlinin et al. reported the discovery of a prominent cold front which is interpreted as the boundary of a cool gas cloud moving through the hotter ambient gas. Vikhlinin et al. discussed the role of the magnetic fields in maintaining the apparent dynamical stability of the cold front over a wide sector at the forward edge of the moving cloud and suppressing transport processes across the front. In this Letter, we identify two new features in the X-ray image of A3667: i) a 300 kpc arc-like filamentary X-ray excess extending from the cold gas cloud border into the hotter ambient gas; ii) a similar arc-like filamentary X-ray depression that develops inside the gas cloud. Both features are located beyond the sector identified by the cold front and are oriented in a direction perpendicular to the direction of motion. The temperature map suggests that the temperature of the filamentary excess is consistent with that inside the gas cloud while the temperature of the depression is consistent with that of the ambient gas. We suggest that the observed features represent the first evidence for the development of a large scale hydrodynamic instability in the cluster atmosphere resulting from a major merger. This result confirms previous claims for the presence of a moving cold gas cloud into the hotter ambient gas. Moreover it shows that, although the gas mixing is suppressed at the leading edge of the subcluster due to its magnetic structure, strong turbulent mixing occurs at larger angles to the direction of motion. We show that this mixing process may favor the deposition of a nonnegligible quantity of thermal energy right in the cluster center, affecting the development of the central cooling flow.
2002, ApJL, 569, 31
1 Introduction
The central region of A3667, a nearby, hot merging cluster (Markevitch, Sarazin, & Vikhlinin 1999), was observed for the first time by Chandra in Sept 1999. The analysis of this first observation by Vikhlinin, Markevitch & Murray (2001a,b) reveals the presence of a prominent 500 kpc-long density discontinuity (“cold front”) in the cluster atmosphere. Vikhlinin et al. show that: i) the density discontinuity is the contact surface between the moving cloud of 4 keV gas and the hotter ambient gas; ii) the speed of the moving cloud is slightly supersonic.
An interesting aspect raised by Vikhlinin et al. is that the cold front must develop hydrodynamical instabilities. These instabilities would destroy the front on very short time scales. However, the Chandra image shows that the front is stable in a wide, sector (where is the angle with respect to the direction of motion). Moreover, the front width is smaller than the Coulomb mean free path, which indicates that the transport and mixing processes are suppressed (see also Ettori & Fabian 2000). To reconcile this observational evidence with the expected hydrodynamical instability of the cold front, Vikhlinin et al. (2001b) put forward the following scenario. As the cloud moves through the ambient gas, the magnetic field lines, which are frozen in the intracluster medium, are stretched by the tangential plasma motions. This results in the formation of a layer with the ordered magnetic field parallel to the front surface. The magnetic field intensity in such a layer is sufficient to suppress the hydrodynamical instabilities within the sector, and to prevent gas mixing and transport processes.
In this letter we present the results from the joint analysis of two Chandra observations of A3667. We identify two filamentary structures forming at the border of the merging subclump: one extends toward the outskirts, the other toward the cluster center. Both structures lie well beyond the hydrodynamically stable region identified by Vikhlinin et al. (2001a). We speculate that these filaments correspond to the well-developed K-H instability, and discuss their implications for the proposed dynamical model of A3667.
The physical size of the structures under discussion is computed assuming km s-1 kpc-1 ( arcsec kpc). Unless specified differently, all the errors are at confidence level for one interesting parameter.
2 Data Reduction
A3667 was observed twice by Chandra with the ACIS-I detector on Sept 22, 1999 and on Sept 9, 2000 for useful exposure times of 45 ks and 50 ks, respectively. We used the data analysis procedures already described elsewhere (Markevitch et al. 2000, Vikhlinin et al. 2001a, Markevitch & Vikhlinin 2001, and Mazzotta et al. 2001 ). We only note that, since the observations have been performed at different detector temperatures, the spectral response and background data have been generated individually for each observation and then appropriately combined.
Spectral analysis has been performed in the 1–9 keV energy band in PI channels. The spectral fitting has been performed assuming an absorption fixed at the Galactic value ( cm-2), and a fixed plasma metallicity, . Because of the hard energy band we used, the derived plasma temperatures are insensitive to the precise value of either or . The temperature map has been produced with a fixed Gaussian smoothing of (see Vikhlinin et al. 2001a for the details of the temperature map computation).
3 X-ray image and Temperature map
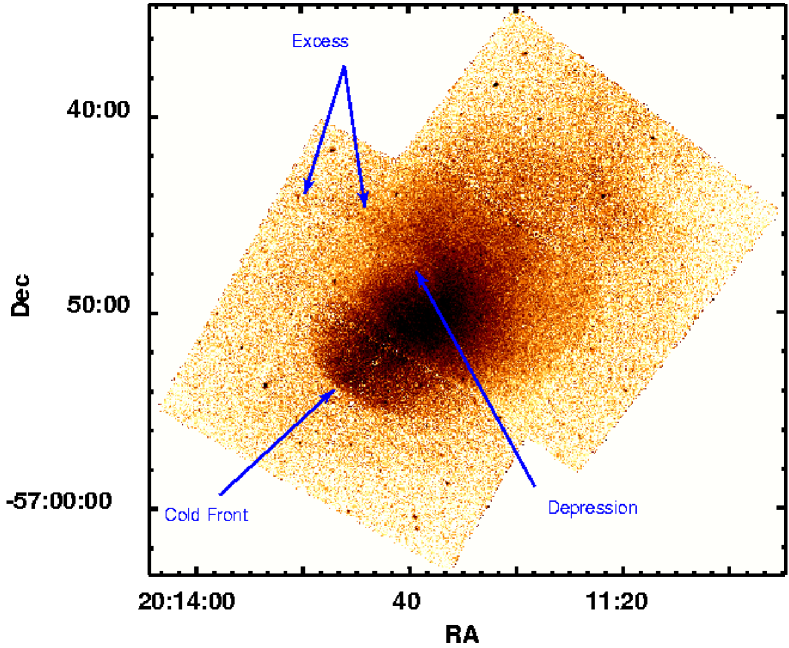
The combined background subtracted and vignetting corrected Chandra image in the 0.7-4 keV energy band is shown in Fig. 1. We extracted the image in the 0.7-4 keV band to minimize the fractional contribution of the cosmic background and thereby to maximize the signal-to-noise ratio. The strongest X-ray feature present in Fig. 1 is the sharp surface brightness edge (“the cold front”) to the South-East extensively discussed by Vikhlinin et al. (2001a,b). To the North of the cold front the cluster image shows two new interesting X-ray features:
i) a filamentary X-ray excess extending toward the east to the chip boundary. The filament has an arc-like shape with a curvature radius of kpc, is kpc long and kpc wide;
ii) a filamentary X-ray depression that develops toward the west inside the cluster center. Also this feature has an arc-like shape with a curvature radius of kpc. It appears to be kpc long and kpc wide;

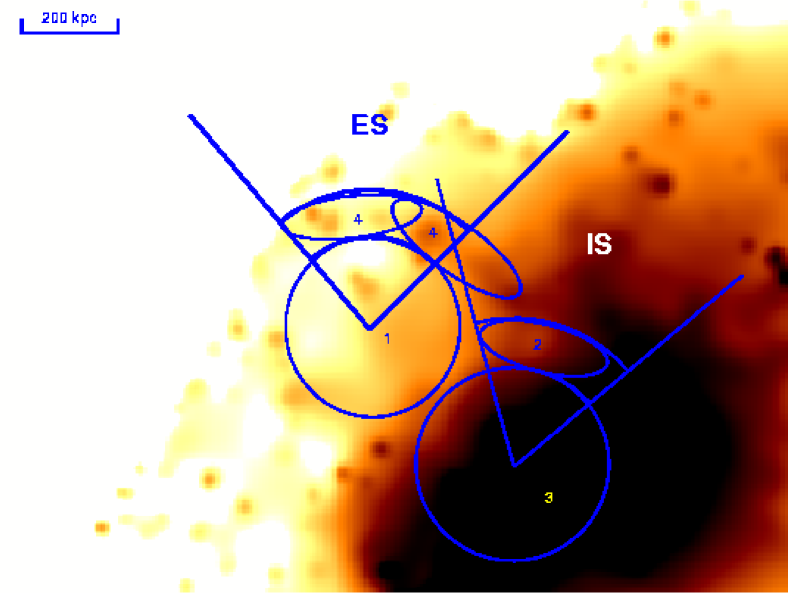
A close-in view of the filamentary X-ray features is shown in the adaptively smoothed image in Fig. 1. We select two ellipsoidal regions indicated by the cardinal numbers 4 and 2 to identify the X-ray excess and depression, respectively. To derive the surface brightness and temperature profiles (see § 3.1, below) for each feature, we identified two sectors originating near the curvature center of the corresponding feature and containing the feature itself. We refer to the sector for the excess and the depression as the External Sector (ES) and the Internal Sector (IS), respectively. Finally with the cardinal numbers 1 and 3 we identify two circular kpc regions centered at the origin of the ES and IS, respectively.
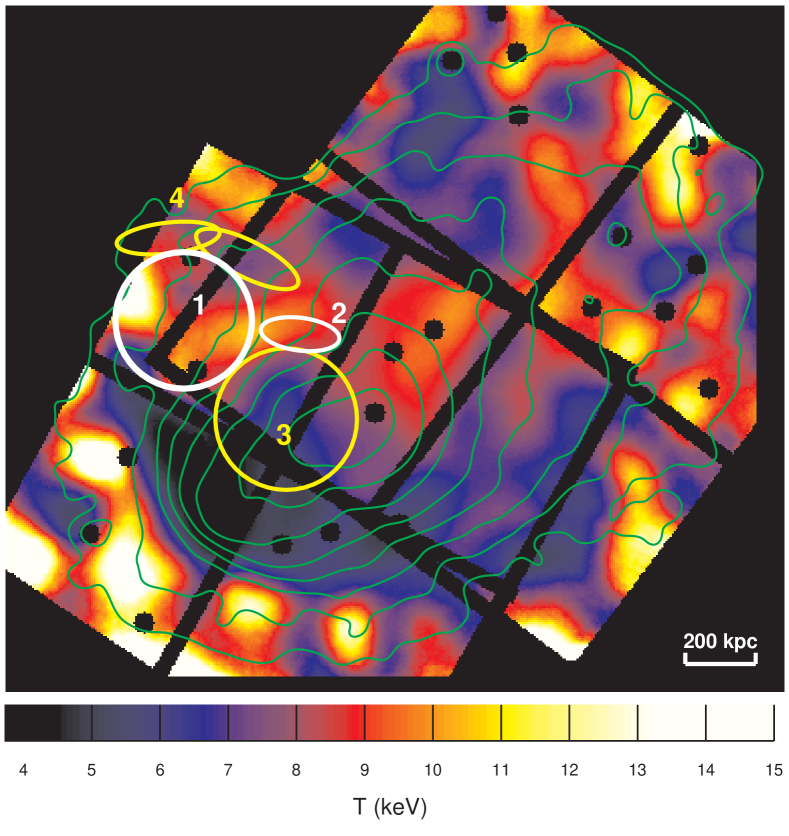
In Fig. 3 we report the temperature map with overlaid X-ray surface brightness contours. The temperature map suggests that, while the X-ray excess (region 4) corresponds to a local decrease in the projected temperature, the temperature of the X-ray depression (region 2) is higher than in the nearby regions. To quantify the statistical significance of the features in the temperature map, we fitted the spectra from the four selected regions with a single temperature model. The spectra from region 2 and 4 have 5155 and 3641 net photons plus 575 and 705 background photons, respectively. The best-fit temperatures reported in Fig. 3 show that while the projected temperature of the gas from the filamentary excess is consistent with the temperature of the cold subcluster, the temperature of the filamentary depression is consistent with the temperature of the ambient cluster gas.
Finally, we note that, in the overlapping region, the Chandra temperature map qualitatively agrees with the coarser ASCA temperature map shown by Markevitch et al. (1999).

3.1 Surface Brightness and Temperature Profiles
To verify the statistical significance of the observed features we extracted both the surface brightness and the projected emission-weighted temperature profiles. The profiles are shown in the left and the right columns of Fig. 3 for the ES and IS, respectively. The profiles confirm that the observed features are statistically significant. The ES profiles show that the filamentary excess produces a significant enhancement of the surface brightness profile and corresponds to a decrement in the temperature profile. On the other hand, the IS profiles shows that the filamentary depression produces a significant decrement of the surface brightness profile corresponding to an increment in the temperature profile. This suggests that the excess is a colder, denser filamentary gas structure embedded in the more diffuse and hotter external cluster atmosphere while the depression is a hotter, rarefied filament of gas embedded in the denser and colder cluster core.
4 Discussion
We have presented evidence for the existence of two adjacent filamentary arc-like structures in the X-ray image of A3667: an X-ray excess extending toward the outskirts and an X-ray depression extending toward the cluster center. Both features are present in the soft band as well as in the hard band. This indicates that they are produced by significant gas density deviations with respect to the surrounding gas. In particular, the former indicates a denser filamentary gas structure embedded in the more diffuse external cluster atmosphere while the latter indicates the presence of a rarefied filament of gas embedded in the denser cluster core. The temperature analysis clearly shows that the dense external filament is colder and the rarefied internal filament is hotter than the ambient gas, respectively. We show also that, while the projected temperature of the gas from the external filament is consistent with the temperature of the central region, the temperature of the internal filament is consistent with the temperature of the *ambient* external cluster gas (see Fig. 3). The observed features suggest that some dense cold gas from the cluster core is “stripped out” into the hotter cluster atmosphere as well as some rarefied hot gas from larger radii penetrates into the cluster core. This observation, thus, represents good evidence for ongoing turbulent gas mixing in the cluster atmosphere.
In previous work, Vikhlinin et al. (2001,a,b) found that the gas in the kpc central, colder region of the cluster moves from North-West to South-East into the rarefied hotter cluster atmosphere, and the cold front is the the contact surface between the two gases. They determined the motion speed from the pressure jump at the front and found the near-sonic velocity , where is the speed of sound in the hot ambient gas. During the gas cloud motion, the surrounding gas flows around the cold cloud. In this situation, the interface between the tangentially moving gas layers must develop both Rayleigh-Taylor (R-T) and Kelvin-Helmholtz (K-H) instabilities (see Inogamov, 1999 for a review).
The R-T instability develops at the interface between the two fluids when the rarefied fluid accelerates the denser one. If, as it is reasonable to assume, the gas cloud moves together with its own dark matter halo (Vikhlinin & Markevitch 2002, in preparation) the gas cloud is stabilized against the R-T instability by gravity, so that the development of R-T instability is quite unlikely. In contrast the K-H instability is related to the shearing motion at the boundary between two fluids and is expected to develop along the lateral boundaries of the cloud. The wavevector of the fastest growing mode, , is parallel to the flow and its growing time is given by solving the dispersion equation (see e.g. Miles 1958). Vikhlinin et al. (2001b) computed the K-H instability growth time for the flow near the cold front in A3667. As the only perturbations relevant for our discussion are the ones that grow on time scales shorter than the cluster core passage time, (here is the cluster size and is the motion speed), we derived the ratio between these two times111This equation reproduces eq.(4) from Vikhlinin et al. (2001b), corrected for an algebraic error which resulted in overestimation of by a factor of . Note that the correct equation does not affect any results presented in Vikhlinin et al., and indeed, strengthens their arguments.:
| (1) |
where is the angle between the perturbation and the leading edge of the moving cloud.
An important aspect already discussed by Vikhlinin et al. (2001b) is that, in the absence of stabilizing factors and assuming Mpc, the growth time for all perturbations on scales kpc is much shorter than the cluster passage time even at very small angles ( arcmin). This means that there should develop a turbulent layer which would smear the cold front by at least kpc at angles arcmin. The Chandra data, however, exclude such a smearing within the sector of the leading edge of the cold front. The expected smearing appears evident only at angles (see e.g. Fig. 1). Vikhlinin et al. propose that the ambient magnetic field is amplified in a narrow boundary region between the two moving gas layers. The amplification is the result of the stretching of the magnetic field lines along the front by tangential plasma motions. The surface tension of the amplified magnetic field acts to stabilize the development of the K-H instability in the sector. At larger angles, however, the magnetic field surface tension becomes insufficient to stabilize the front because of the higher flow speed. Thus, outside the sector, the development of the K-H instability is unaffected by the magnetic field, and therefore the perturbation growth time is given by eq. 1. Eq. 1 gives us also two important clues to understand the presence of the observed features on the side of the colder moving subcluster:
i) small scale perturbations grow faster than the larger scale ones. This means that small scale perturbations develop immediately, when the interface is still a discontinuity. Their growth, however, widens the interface, which becomes a turbulent layer of finite width. At this point the perturbations on scales smaller than the evolving width of the front are damped (they becomes unobservable as individual structures) while perturbations on a larger scale start to grow (thus they may appear as distinct structures) (see e.g. Esch 1957). As this process continues, it is expected that the remaining observable wavelengths are the ones with a growth time comparable to the cloud crossing time, namely ;
ii) for a fixed wavelength the growth time is shorter at larger angles reaching its minimum at . This is a direct consequence of the fact that the speed of the external fluid increases with being maximum at .
In this picture the most natural explanation for the newly discovered filamentary structures in A3667 is that they are the result of the development of K-H instabilities. The structure lies, in fact, at which, because of point ii) above, is indeed a privileged point for the growth of the perturbations. Furthermore, if we assume that kpc and Mpc, the growing time for this perturbation is such that . This means that the perturbation is just now entering the strong non-linear regime, consistently with what we observe.
We notice that the observed instability act to: i) deposit low density hot gas right in the cluster center; ii) remove denser colder gas from the cluster center. If efficient, these two processes may contribute to inhibit (or, if already present, to destroy) the development of a central cooling flow. We calculated the mass rate of hot gas which is being deposited right in the cluster center. For the scope of this letter we use a very simple model and we assume that the external hot gas flows toward the center in a cylinder-like filament with a speed close to the speed of the subclump (). Moreover, we assume that the gas density in the filament is equal to the density outside the front and that the radius of the filament is kpc. We Find:
| (2) |
From Eq. 2 we see that the instability transports hot gas in the cluster center at a rate which is comparable to the mass deposition rate of many cooling flow clusters. It is clear, than, that such a mechanism may play an important role in the development and/or evolution of a central cooling flow.
5 Conclusion
We presented the combination of two Chandra observations of the central region of A3667. We showed that the cluster hosts two arc-like adjacent filamentary structures: one, extending from the colder subcluster toward the cluster outskirts, appears as a dense structure embedded in the less dense cluster atmosphere, and the other, extending inside the subcluster, appears as a rarefied structure embedded in the denser cluster core.
We suggest that the observed features represent the first evidence for the development of a large scale hydrodynamic instability in the cluster atmosphere. This interpretation appears to be consistent with the previous cluster dynamic interpretation proposed by Vikhlinin et al. (2001a,b).
The discovery of this instability represents an important step toward a full understanding of the physics of mergers. In particular it shows that, although the cold front prevents the gases of the merging objects to mix along the direction of motion, strong turbulent mixing processes, on scales comparable to the size of the merging subclump, may occur at large angles to the direction of motion. This may favor the deposition of a non-negligible quantity of thermal energy right in the cluster center with important consequences for the development and/or evolution of a central cooling flow.
References
- (1)
- (2) Esch, R.E. 1957, J. Fluid Mech. 3, 289
- (3)
- (4) Ettori, S. & Fabian, A. C. 2000, MNRAS, 317, L57
- (5)
- (6) Inogamov, N. A. 1999, Astrophysics and Space Physics Reviews, 10, 1
- (7)
- (8) Mazzotta, P., Markevitch, M., Vikhlinin, A., Forman, W. R., David, L. P., & VanSpeybroeck, L. 2001, ApJ, 555, 205
- (9)
- (10) Markevitch, M., Sarazin, C. L., & Vikhlinin, A. 1999, ApJ, 521, 526
- (11)
- (12) Markevitch, M. et al. 2000, ApJ, 541, 542
- (13)
- (14) Markevitch, M., & Vikhlinin, A. 2001, ApJ, 563, 95
- (15)
- (16) Miles, J. W. 1958, J. Fluid Mech., 4, 538
- (17)
- (18) Vikhlinin, A., Markevitch, M., Murray, S.S. 2001a, ApJ, 551, 160
- (19)
- (20) Vikhlinin, A., Markevitch, M., Murray, S.S. 2001b, ApJ, 549, L47
- (21)