The mass ratio distribution of short period double degenerate stars.
Abstract
Short period double degenerates (DDs) are close white dwarf – white dwarf binary stars which are the result of the evolution of interacting binary stars. We present the first definitive measurements of the mass ratio for two DDs, WD 0136+768 and WD 1204+450, and an improved measurement of the mass ratio for WD 0957666. We compare the properties of the 6 known DDs with measured mass ratios to the predictions of various theoretical models. We confirm the result that standard models for the formation of DDs do not predict sufficient DDs with mass ratios near 1. We also show that the observed difference in cooling ages between white dwarfs in DDs is a useful constraint on the initial mass ratio of the binary. A more careful analysis of the properties of the white dwarf pair WD 1704+481.2 leads us to conclude that the brighter white dwarf is older than its fainter companion. This is the opposite of the usual case for DDs and is caused by the more massive white dwarf being smaller and cooling faster. The mass ratio in the sense (mass of younger star)/(mass of older star) is then 1.430.06 rather than the value 0.700.03 given previously.
keywords:
white dwarfs – binaries: spectroscopic – stars: individual: WD 0136+768 – stars: individual: WD 1204+450 – stars: individual: WD 09576661 Introduction
Short period double degenerates (DDs) are binary stars in which both stars are white dwarfs. The orbital periods of DDs are hours or days (Maxted & Marsh 1999) so the separation of the stars is only a few solar radii. White dwarfs are the remnants of giant stars which have radii of hundreds of solar radii, much larger than the current size of the binary, so there has clearly been dramatic shrinkage of the binary orbit during the evolution of the binary star. There are several models for the formation of DDs which have been used to predict the properties of this group of binary stars. These usually assume that the most recent episode of orbital shrinkage is due to a common envelope (CE) phase in which a red giant star comes into contact with its Roche lobe and begins to transfer mass to its companion star. This mass transfer is highly unstable, so a “common envelope” forms around the companion and the core of the red giant. The drag on the companion orbiting inside the common envelope leads to extensive mass loss and dramatic shrinkage of the orbit (Iben & Livio 1993). If this CE phase happens while the star is on the first giant branch, the degenerate helium core of the red giant will be exposed and will appear as a white dwarf of unusually low mass, i.e., about 0.4, c.f., 0.55 – 0.6for a typical white dwarf (Bragaglia et al. 1995). The mass of a white dwarf can be measured directly from its spectrum by comparing the surface gravity, , and the effective temperature, Teff, to cooling models of white dwarfs. Low mass white dwarfs identified this way are particularly fruitful source of DDs (Marsh, Dhillon & Duck 1995).
The most notable difference between models for the formation of DDs is the way they treat the formation of the first white dwarf. For example, Iben, Tutukov & Yungelson (1997) have predicted the distributions of masses, periods and mass ratios for DDs using a numerical model of the population of close binaries which evolve through either two CE phases or an Algol-like phase (stable mass transfer on a thermal timescale) followed by a CE phase. Han (1998) has produced a similar model but has also explored how the various parameters of the model affect the distribution of periods, mass or mass ratio which are predicted. Han’s model also includes enhanced mass loss in a star as it approaches its Roche limit, an effect which is not incorporated in the model of Iben, Tutukov & Yungelson. It has now been fairly well established that these models do not succesfully predict the distribution of mass ratios for DDs. This problem has been explored on a case-by-case basis by Nelemans et al. (2000). The size of a red giant is related directly to its core mass so they were able to show that for three DDs with measured mass ratios, the standard prescriptions for the first mass transfer phase predict orbits which are too small. They used a parametric approach to describe the first mass transfer phase based on a consideration of the angular momentum balance during this phase, rather than the more usual energy balance arguments used by Iben et al. and Han et al. This parametric approach was incorporated into a model for the population of DDs by Nelemans et al. (2001). They were able to predict a mass ratio distribution which was more consistent with those observed provided that they assumed that very low mass white dwarfs () cool more rapidly than recent models predict. This assumption is required to avoid the prediction that most binary white dwarfs should have very low masses - a problem common to many of these models.
Measuring mass ratios for DDs is a powerful way to test models of how binary stars interact. Strong obervational tests of these models are desirable because many interesting astrophysical phenomena are the result of interacting binary stars, e.g., black hole binaries, AM CVn binaries, Type Ia supernovae, cataclysmic variables and novae. The properties of these objects have a direct bearing on areas of astronomy other than the study of binary stars themselves, e.g., the evolution of the properties Type Ia supernovae over the history of the Universe is a matter of direct concern when they are used as standard candles to measure cosmological parameters (Umeda et al. 1999).
Several preliminary estimates of the mass ratios and others parameters for WD 0136+768, WD 0957666 and WD 1204+450 have been published elsewhere (e.g., Moran, Marsh & Maxted 1999). The values given here should be used in preference to those earlier estimates although the conclusions discussed above, many of which are based on those preliminary estimates, are not affected in general by the small changes to the values of the mass ratio given here.
2 Observations and reductions
Observation of WD 0957666 were obtained with the RGO spectrograph on the 3.9m Anglo-Australian Telescope (AAT) at Siding Spring, Australia. We used a 1200 line/mm grating with the 82cm camera and a 0.8 arcsec slit. The detector used was a TEK charge-coupled device (CCD) with m pixels. The resolution of the spectra is 0.7Å and the dispersion is 0.23Å-per-pixel.
Observations of WD 0136+768 and WD 1204+450 were obtained with the 500mm camera of the intermediate dispersion spectrograph (IDS) on the 2.5m Isaac Newton Telescope (INT) on the Island of La Palma and the ISIS spectrograph on the 4.2m William Herschel Telescope (WHT), also on La Palma. Both spectrographs were used with 1200 line/mm gratings, a 1 arcsec slit and a TEK CCD. The resolution of the IDS spectra is 0.9Å and the dispersion is 0.39Å-per-pixel. The resolution of the ISIS spectra is 0.8Å and the dispersion is 0.40Å-per-pixel.
| Name | Telescope | Dates | No. of |
|---|---|---|---|
| spectra | |||
| WD 0136+768 | WHT | 1995 Jan 21–24 | 7 |
| INT | 1995 Jun 19–24 | 10 | |
| WHT | 1996 Jan 11–14 | 16 | |
| INT | 1997 Nov 6–10 | 46 | |
| WD 0957666 | AAT | 1996 Mar 1–3 | 31 |
| AAT | 1997 Mar 18–21 | 169 | |
| WD 1204+450 | INT | 1998 Feb 8–11 | 32 |
| WHT | 1998 May 13–14 | 3 | |
| WHT | 1998 Jul 8–13 | 8 | |
| WHT | 2001 Mar 7–8 | 3 |
The dates of observation for each star are given in Table 1 The observing procedure is very similar in each case. We obtain spectra of our target stars around the H line using exposure times of 5–30 minutes. Spectra of an arc lamp are taken before and after each target spectrum with the telescope tracking the star. None of the CCDs used showed any structure in unexposed images, so a constant bias level determined from a clipped-mean value in the over-scan region was subtracted from all the images. Sensitivity variations were removed using observations of a tungsten calibration lamp. The sensitivity variations along the spectrograph slit are removed using observations of the twilight sky in the AAT images because the tungsten calibration lamp is inside the spectrograph. We have occasionally used the same technique for the WHT and INT spectra, though it makes little difference in practice whether we use sky images or lamp images to calibrate these images.
Extraction of the spectra from the images was performed automatically using optimal extraction to maximize the signal-to-noise of the resulting spectra (Marsh 1989). The arcs associated with each stellar spectrum were extracted using the profile determined for the stellar image to avoid possible systematic errors due to tilted arc lines. The wavelength scale was determined from a polynomial fit to measured arc line positions and the wavelength of the target spectra interpolated from the calibration established from the bracketing arc spectra. Uncertainties on every data point calculated from photon statistics are rigorously propagated through every stage of the data reduction.
3 Analysis
In this section we describe how we have measured the mass ratios for WD 0957666, WD 0136+768 and WD 1204+450 using a simultaneous fit to the H line in all the available spectra for each star.
3.1 WD 0136+768
The spectra clearly show two sharp cores to the H line separated by up to about 150 km s-1 with one core slightly deeper than the other. To determine an approximate value of the orbital period, we cross correlated the spectra against a single Gaussian profile with a full-width at half minimum (FWHM) of 200 km s-1 and measured the position of the peak. This gives an average of the radial velocities of the two stars weighted towards the star with the deeper core. We then calculated the periodogram of the results over 100 000 frequencies between 0.01 and 20 cycles per day. The periodogram is shown in Fig. 1. All the periodograms in this paper show the natural logarithm of the probability ratio P(DC+S,)/P(DC), where P(DC+S,) is the probability of obtaining the data given that it the sampling of a signal composed of a sine wave with frequency plus a constant, and (PC) is probability of obtaining the data given that it the sampling of a constant signal, i.e., the exponent of equation (A4) discussed in Marsh, Dhillon & Duck (1995). The orbital frequency is clearly near 0.7 cycles per day. We then calculated the periodogram of the results over 20 000 frequencies between 0.6 and 0.8 cycles per day, also shown in Fig. 1. There are two peaks of similar significance in this range at 0.69112 and 0.71063 cycles per day.
In order to determine approximate values for the projected orbital velocities of the stars and to identify the correct orbital frequency, we measured approximate radial velocities for both stars using a least-squares fit of two Gaussians profiles with fixed widths of 1.2Å and of fixed depths of 10 percent of the local continuum. A fixed quadratic function was used to account for the shape of the spectrum near the cores and only data within 500 km s-1 of the rest wavelength of H was included in the least-squares fit. After assigning the measured the radial velocities to the correct star for each of the trial frequencies, it was clear from the quality of a least-squares fit of a sine wave to the data that 0.71063 cycles per day is the correct orbital frequency. The fit to these data is shown in Fig. 2.


| Orbit | |
|---|---|
| HJD | 760.8533 0.0034 |
| 1.407221 0.000009 | |
| 22.3 0.6 | |
| 67.4 0.8 | |
| 15.0 1.2 | |
| 84.8 1.8 | |
| Star 1 | |
| FWHM1 (Å) | 77.4 1.9 |
| D1 | 0.150 0.003 |
| FWHM2 (Å) | 17.7 1.1 |
| D2 | 0.052 0.004 |
| FWHM3 (Å) | 5.3 0.5 |
| D3 | 0.039 0.004 |
| FWHM4 (Å) | 0.80 0.06 |
| D4 | 0.177 0.008 |
| Star 2 | |
| FWHM1 (Å) | 33.6 1.1 |
| D1 | 0.098 0.004 |
| FWHM2 (Å) | 7.0 0.4 |
| D2 | 0.047 0.003 |
| FWHM3 (Å) | 0.68 0.14 |
| D3 | 0.082 0.011 |
| Continuum | |
| 0.958 0.003 | |
| Fit | |
| N | 43985 |
| 51897.64 | |
| Reduced | 1.181 |
To measure the radial velocities of the two components more precisely we used a simultaneous least-squares fit to all the spectra of two model profiles, one for each star, in which the position of each model profile is predicted from its time of observation, , using the equation , where 1 or 2. We define such that star 1 has the deeper H core and is closest to the observer at time . The projected orbital velocity of star 1 is and its apparent mean velocity is and similarly for star 2. Note that because the apparent mean velocity is the sum of the radial velocity of the system and the gravitational redshift of each star, and this second quantity is different for each star. Each model profile is the sum of a number of Gaussian profiles with independent widths and depths but with the same mean. In this way we are able to determine the shape of the two profiles and the parameters of the two circular orbits, including and , directly. The resolution of each spectrum is included by convolution of the final model profile for each spectrum with a Gaussian function of the appropriate width and the effects of smearing due to orbital motion are also included.
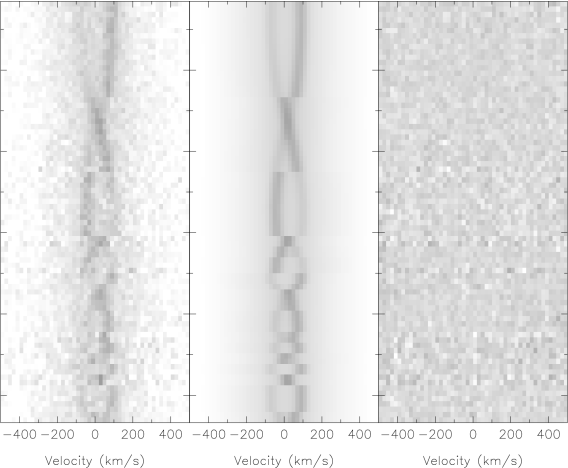
There are many free-parameters in this fitting process so we used a series of least-squares fits in which first the profile shapes were fixed while the parameters of the orbit were varied and then vice versa, until we had established values for all the parameters which were nearly optimal. Only data within 5000 km s-1 of the rest wavelength of H is included in the least-squares fit. The spectra were normalized using a linear fit to the contiuum either side of the H line prior to fitting. We used four Gaussian profiles to model the broad wings of the H line and the core of star with the deeper core and three Gaussian profiles for the other star. A polynomial is also included in the fitting process to allow for smooth, asymmetric features in the profile. For the final least-squares fit the parameters of the profile shapes and the orbit were all varied independently. The reduced value for this fit was rather high because of small changes from spectrum-to-spectrum due to inaccuracies in the normalization process. We corrected for these small offsets by subtracting the mean of the residuals over the fitting regions from each spectrum. We then repeated the fitting process and obtained the results given in Table 2. In fact, this renormalization has a negligible effects on the results. The trailed spectrograms of the data, the fit and the residuals are shown in Fig. 3.
3.2 WD 0957666
Bragaglia et al. (1990) first noted the variable radial velocity of WD 0957666 and the absence of any spectral features due to a main-sequence companion in the optical or near-infrared spectrum. They concluded that WD 0957666 is a double degenerate with an orbital period of 1.15 d. Moran, Marsh & Bragaglia (1997) used the AAT data from 1996 described above to show that the correct orbital period is 1.46 h. The core of the H line from the fainter white dwarf in this binary is visible in these spectra. This lead to a mass ratio measurement of . We obtained additional data of WD 0957666 with the AAT during 1997 to improve the measurement of the mass ratio.
| Orbit | |
|---|---|
| HJD(-2450000)() | 145.3794 0.0001 |
| (d) | 0.06099312 0.00000002 |
| () | 18.4 0.8 |
| () | 7.4 3.6 |
| () | 218.4 1.1 |
| () | 246.3 5.0 |
| Star 1 | |
| FWHM1(Å) | 36.3 5.5 |
| D1 | 0.100 0.045 |
| FWHM2(Å) | 21.1 8.6 |
| D2 | 0.052 0.035 |
| FWHM3(Å) | 9.6 2.2 |
| D3 | 0.039 0.016 |
| FWHM4(Å) | 2.08 0.09 |
| D4 | 0.162 0.005 |
| Star 2 | |
| FWHM1(Å) | 27.4 2.1 |
| D1 | 0.027 0.002 |
| FWHM2(Å) | 1.6 0.2 |
| D2 | 0.041 0.004 |
| Continuum | |
| 0.951 0.007 | |
| Fit | |
| N | 74445 |
| 78698.4 | |
| Reduced | 1.057 |
| Orbit | |
|---|---|
| HJD(-2450000)() | 1003.789 0.004 |
| (d) | 1.602663 0.000016 |
| () | 33.2 1.3 |
| () | 38.7 1.6 |
| () | 99.6 2.2 |
| () | 86.7 2.6 |
| Star 1 | |
| FWHM1(Å) | 116.7 6.2 |
| D1 | 0.137 0.007 |
| FWHM2(Å) | 49.6 3.1 |
| D2 | 0.087 0.010 |
| FWHM3(Å) | 12.4 0.7 |
| D3 | 0.066 0.004 |
| FWHM4(Å) | 1.71 0.08 |
| D4 | 0.113 0.004 |
| Star 2 | |
| FWHM1(Å) | 30.3 1.8 |
| D1 | 0.067 0.005 |
| FWHM2(Å) | 6.5 0.7 |
| D2 | 0.037 0.004 |
| FWHM3(Å) | 1.24 0.14 |
| D3 | 0.076 0.005 |
| Continuum | |
| 1.078 0.003 | |
| Fit | |
| N | 27965 |
| 28658.0 | |
| Reduced | 1.026 |


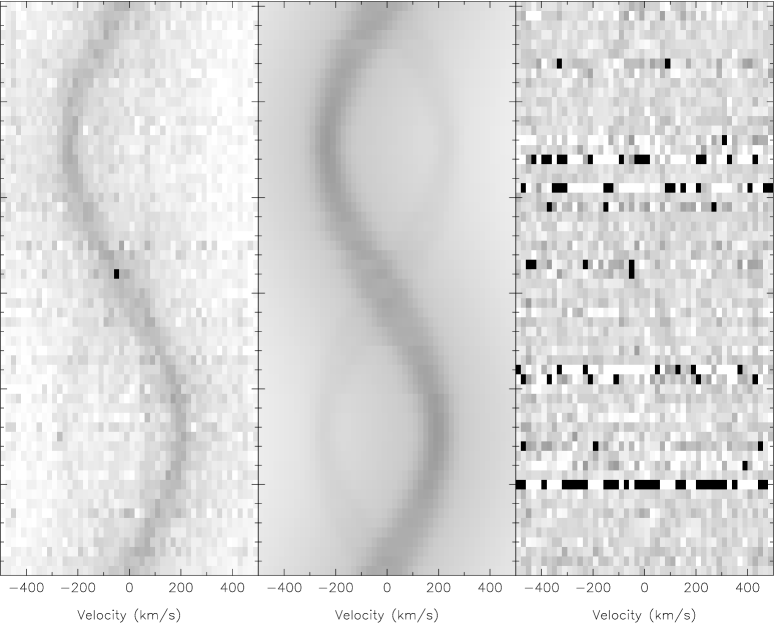
We have used all the spectra of WD 0957666 from 1996 and 1997 with exposure times of 300s to 600s. We normalized the spectra using a linear fit to the continuum either side of the H line. We used the radial velocites predicted by the ephemeris and circular orbit fit of Moran, Marsh & Bragaglia to apply a shift our 1997 data. Visual inspection of the trailed spectrogram shows that ephemeris is reliable, so we proceeded directly to a simultaneous least-squares fit to all the spectra using the same method we employed for WD 0136+768. We found that the quality of the fit is much improved by using three Gaussians for star 2, rather than two Gaussians as Moran, Marsh & Bragaglia used. Only data within 2000 km s-1 of the rest wavelength of H is included in the least-squares fit. The optimum values determined by least-squares for the width and depth of each Gaussian and the parameters of the circular orbits are given in Table 3. The trailed spectrograms of the data, the fit and the residuals are shown in Fig. 4.
3.3 WD 1204+450
WD 1204+450 is a low mass white dwarf (Bergeron, Saffer & Liebert 1992) which was first identified as a possible binary by Saffer, Livio & Yungelson (1998). We observed WD 1204+450 with the INT to determine its orbital period. These spectra show two narrow cores to the H line, one slightly deeper than the other, moving in anti-phase by 100 over 6–7 hours. This clearly shows that WD 1204+450 is a double degenerate with a period of days but the quality and phase coverage of the INT data is such that it is difficult to determine the exact orbital period from these data alone, particularly since it is hard to identify the deeper core in some of the spectra. We have therefore obtained data with the WHT at slightly better resolution and higher signal-to-noise which has enabled us to identify an unambiguous orbital period as follows.
We first normalized all the spectra using a low-order polynomial fit to the continuum either side of the H line and formed the average of those spectra taken within 2 hours of each other improve their signal-to-noise. We used a least-squares fit to a WHT spectrum in which the cores are clearly distinguished to create a model line profile for each star composed of 4 Gaussian profiles for the star with the deeper core and 3 for the other. We then measured the radial velocity of both components in the 18 spectra available by varying the position of the cores only in a least-squares fit. The least-squares fit was done twice for each spectrum, once with the deep core on the left and once on the right. By comparing the quality of these two fits, both from the chi-squared value and by-eye, we found 13 spectra in which the deeper core could be clearly identified or where the velocities of the two cores are identical to within their uncertainties. The periodogram of the velocities measured from the deeper core calculated over 100 000 frequencies between 0.1 and 10 cycles per day is shown in Fig. 5. The data are sparsely sampled so the periodogram is complex, but there is a single unambiguous peak at an orbital frequency of 0.6240 cycles/day. The periodogram of the radial velocities for the other core gives the same result. The measured radial velocities and a sine wave fit by least-squares to the data for each core are shown in Fig. 6. The next most prominent set of peaks near 1.6 cycles/day are not compatible with the observations taken over a continuous sequence of 6 hours seen in Fig. 7 starting with a conjunction about 1/3 of the way up the figure and ending near quadrature just over half way up the plot. If the period were near (1/1.6)d these data would cover almost half an orbit and we we then expect to see a second conjunction, which is clearly not the case.
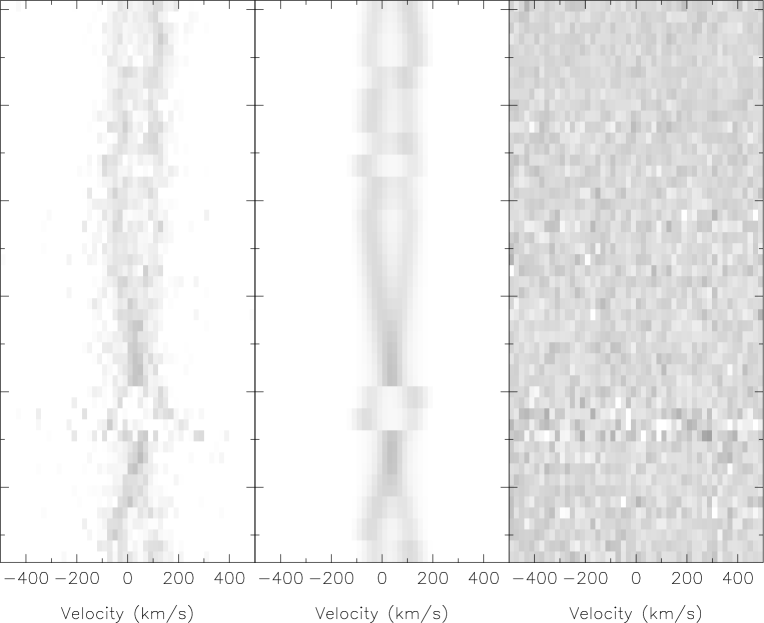
To measure the radial velocities of the two components more precisely we used a simultaneous least-squares fit to all the spectra, i.e., prior to forming the average spectra, of two model profiles, one for each star, in which the position of each model profile is predicted from its time of observation, , using the equation , as before. Only data within 5000 km s-1 of the rest wavelength of H is included in the least-squares fit. The optimum values determined by least-squares for the width and depth of each Gaussian and the parameters of the two circular orbits are given in Table 4. The trailed spectrograms of the data, the fit and the residuals are shown in Fig. 7.
4 Discussion
4.1 Masses, temperatures and ages
In Table 5 we list the mass ratio , where star 1 has the deeper core, for WD 0136+768, WD 0957666 and WD 1204+450 based on the values of and measured above. We also list measurements of for three other double degenerates where the narrow H core of both stars has been measured. Also given in Table 5 are the orbital period, , the ratio of the depths of the H cores, , the masses of the two stars, and , estimates of the effective temperatures of the stars, and , and an estimate of the cooling ages of the white dwarfs, and . We have remeasured for WD 1704481.2 from one of the WHT spectra described in Maxted et al. (2000) in which the two cores are clearly resolved using a least-squares fit of multiple Gaussians in which the width of the narrow Gaussians assigned to each core are constrained to have the same width. We also give published mass estimates for the stars based on their temperatures and surface gravities measured from the optical spectrum compared to cooling models for white dwarfs. Where only a single mass from the combined spectrum has been published, we assign individual masses consistent with the mass ratio such that the luminosity weighted mean mass equals the published mass. We take the value of as an estimate of the luminosity ratio since the additional error introduced by this approximation is small compared to the typical uncertainties on the mass estimates (0.05).
WD0135052 is the only binary in Table 5 for which separate effective temperatures have been published for the the two stars. In order to calculate the effective temperatures of the two stars in the other binaries, we compared values of and the effective temperature measured from the combined spectrum to the values predicted by the cooling models of Benvenuto & Althaus (1999) as follows. We used linear interpolation between their grid of models to calculate the radii of the stars as a function of and for white dwarfs of the appropriate mass. We used the surface brightness values and VR colours tabulated by Bergeron, Wesemael & Beauchamp (1995) combined with the radius and effective temperature calculated from cooling models to calculate the luminosity ratio in the R-band. We then multiplied this ratio by the ratio of H core depths estimated from the effective temperature to get a grid of values. The core depth is taken from a polynomial fit to the depth of the H core versus effective temperature measured from Fig. 3 of Koester & Herrero (1988).
We then assumed that the effective temperature measured from the combined spectrum is the mean of and weighted by the luminosity on the V-band. The best estimates of and are then given by intersection of the region of the – plane where the predicted value of is the consistent with the observed value and the region where the mean effective temperature is consistent with its observed value. An example is given in Fig. 8 for the case of WD 0136+768. From this figure we see that the uncertainties in the effective temperatures derived are at least 500K. Given the approximations and assumptions used to derive these values, the true uncertainty is probably larger than this, particularly for fainter companions in binaries with large luminosity ratios. Nevertheless, we can estimate the cooling age of the stars given their masses and effective temperatures from the models of Benvenuto & Althaus (1999). The uncertainties on the ages are large since they depend not only on the uncertain mass and effective temperature estimates, but also on the unknown hydrogen layer thickness and other uncertainties in the models. However, we are most concerned here with the relative ages of the two stars, and this is less affected by these systematic errors. We estimate the uncertainty in the relative ages of the stars to be 50%.
The exact age we derive for the stars in WD 1704481.2 depends on the cooling model used, but we consistently find that star 1 is older than star 2 whichever model we use. Although star 1 has the deeper H core, star 2 is is a more massive CO white dwarf so it is smaller and has cooled faster. This leads to an exception in this case to the general rule that the star with the deeper H core has formed more recently. In all the other cases the star with the deeper core is the younger of the two, as expected.

| Name | (days) | () | () | (K) | (K) | (Myr) | (Myr) | References. | ||
| WD 0135052 | 0.900.04 | 1.556 | 1.30 | 0.47 | 0.52 | 7470 | 6920 | 950 | 1300 | 1, 2 |
| WD 0136768 | 1.260.03 | 1.407 | 2.54 | 0.47 | 0.37 | 18500 | 10500 | 150 | 600 | 0, 5 |
| WD 0957666 | 1.130.02 | 0.061 | 5.14 | 0.37 | 0.32 | 30000 | 11000 | 25 | 350 | 0, 6 |
| WD 1101364 | 0.870.03 | 0.145 | 1.13 | 0.29 | 0.33 | 15500 | 12000 | 135 | 350 | 3, 5 |
| WD 1204450 | 0.870.03 | 1.603 | 2.05 | 0.46 | 0.52 | 31000 | 16000 | 40 | 120 | 0, 5 |
| WD 1704481.2 | 0.700.03 | 0.145 | 1.60 | 0.39 | 0.54 | 9000 | 10000 | 725 | 705 | 0, 4 |
| 0. This paper; 1. Saffer, Liebert & Olszewski (1988); 2. Bergeron et al. (1989); 3. Marsh (1995); 5. Bergeron, Saffer & Liebert | ||||||||||
| (1992); 6. Moran, Marsh & Bragaglia (1997) | ||||||||||
4.2 Comparison to models of DD formation
A full comparison of the observed parameters of DDs to all the available models is beyond the scope of this paper. In this section we re-iterate that the observed mass ratios are not compatible with “standard” models of DD evolution and show that the cooling ages derived above can be a useful test of the feasibilty of models of DD formation.
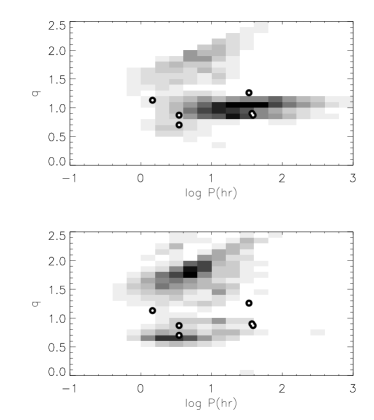
In Fig. 9 we compare the observed distribution of mass ratios and orbital periods to the distribution predicted by two different models taken from Nelemans et al. (2001), shown as grey-scale images. These predictions include selection effects such as a magnitude limit in the observed sample and the relative luminosity of the two stars. The mass ratio in this case is , where is the mass of the brighter star and is the mass of its companion, so the mass ratio of WD 1704+481.2 is 0.70 according to this definition. We see that models which assume two phases of common-envelope evolution (lower panel) do not predict sufficient DDs with mass ratios near . There is better agreement with the distribution of mass ratios and periods predicted by the model of Nelemans et al. which uses a non-standard parametrization of the first mass transfer phase. However, the number of measured mass ratios is far too small to allow for a more detailed discussion of the relative merits of different cooling models, prescriptions for mass loss, initial distribution of periods and masses, etc.
The non-standard parametrization of the first mass transfer phase used by Nelemans et al. (2001) arises from the case-by-case discussion of the observed properties of DDs by Nelemans et al. (2000) described earlier. They describe scenarios for the formation of WD 0136+768, WD 1101+364 and WD 0957666 based on their proposed model of the first mass transfer phase. These scenarios were devised to explain the observed periods, masses and mass ratios of these DDs. One further test of the feasibility of scenarios which was not expoited in the case of WD 0136+768 and WD 1101+364 was the relative cooling ages of the two white dwarfs. The first mass transfer phase occurs when the more massive star fills its Roche lobe as a result of its rapid expansion at the end of its main-sequence lifetime. This mass transfer phase is assummed not to influence the evolution of the less massive star, so the second mass transfer phase occurs when that star also fills its Roche lobe after its main-sequence lifetime. The time taken for the mass transfer phases is negligible compared to these main-sequence lifetimes, so if the two stars were formed at the same time, we find that their main-sequence lifetimes, and , are related to the ages of the white dwarfs, and by
where star 1 is the initially less massive star. Since the main-sequence lifetime of a star is strongly dependent on its mass, the observed value of is a constraint on the initial mass ratio of the binary, e.g., a larger value of implies a larger difference in which in turn implies a larger difference in the initial masses, i.e., a more extreme initial mass ratio.
We have used the analytical formula of Hurley et al. (2000) to calculate the main-sequence lifetime of a star based on its initial mass for a range of metallicities. For WD 0136+768 Nelemans et al. propose initial masses of 2.25 and 2.12 so we find Myr. This is rather short compared to the difference in cooling ages of Myr. This suggests that the initial masses of these stars differed more than proposed by Nelemans et al. The main-sequence lifetime is very sensitive to the initial mass and the measurements of the white dwarf masses and cooling ages are quite uncertain so it is not possible at this stage to draw more quantitative conclusions. It may even be the case that the scenario for the formation of WD 0136+768 proposed by Nelemans et al. is consistent with the observed properties of this binary given the fairly large uncertainties involved. The same cannot be said in the case of WD 1101+364. In this case, the initial masses of 1.75 and 2.30 imply a difference in cooling ages of Myr, which is far too long compared to the difference in cooling ages of Myr. Given the relatively small difference in cooling ages seen in this DD, it would appear that a feasible scenario for its formation requires that the initial masses of the stars are more similar to one another than proposed by Nelemans et al. The scenario proposed by Nelemans et al. for the formation of WD 0957666 includes a phase of core helium burning for the more massive star. The observed difference in cooling ages does not constrain the initial mass ratio directly in this case, but Nelemans et al. did show that the relative cooling ages of the two white dwarfs is consistent with the scenario that they propose in this case.
The cooling models for helium white dwarfs are uncertain so one should be careful when drawing conclusions based on quantitative results based on them as we have done for WD0136+768 and WD1101+364. Following a suggestion by a referee, we also considered the models of Driebe et al. (1998). These cooling models cover masses of 0.179to 0.414, so we were able to apply them to the less massive component of WD0136+768, for example. These models suggest that this white dwarf is about 1.7 Gyr old, much older than the prediction of the Benvenuto & Althaus models. This greater age is the result of a thick hydrogen envelope used in these models. The ages of the stars in WD 1101+364 are increased to 600 Myr and 1.4 Gyr when the models of Driebe et al. are used. Although the difference in the ages is exactly as expected for the scenario outlined by Nelemans et al., the cooling models for these very low mass white dwarfs show hydrogen shell flashes. During these shell flashes the radius of the star increases to , which would result in a further common-envelope phase and loss of some fraction of the thick hydrogen envelope. It is not clear that the models of Driebe et al. are applicable to WD 1101+364 in this case.
5 Conclusion
We have determined the mass ratios and orbital periods of the three double degenerate stars WD 0136+768, WD 1204+450 and WD 0957666 by measuring the radial velocities of both stars from the sharp cores of the H line. We have compared the measured mass ratios and orbital periods for these DDs and three others to two models for the formation of DDs, including selection effects, from Neleman’s et al. (2001). We confirm the result that standard models for the formation of DDs do not predict suffucient DDs with mass ratios near 1. We have also shown that the observed difference in cooling ages between white dwarfs in DDs is a useful constraint on the initial mass ratio of the binary.
Acknowledgments
PFLM was supported by a PPARC post-doctoral grant. CKJM was supported by a PPARC postgraduate studentship. The William Herschel Telescope and the Isaac Newton Telescope are operated on the island of La Palma by the Isaac Newton Group in the Spanish Observatorio del Roque de los Muchachos of the Instituto de Astrofisica de Canarias.
References
- [1] Benvenuto O.G., Althaus L.G., 1999, MNRAS, 303, 30.
- [2] Bergeron P., Wesemael F., Fontaine G., Liebert J., 1989, ApJ, 345, L91.
- [3] Bergeron P., Saffer R.A., Liebert J., 1992, ApJ 394, 228.
- [4] Bragaglia A., Greggio L., Renzini A., D’Odorico S., 1990, ApJ, 365, L13.
- [5] Bragaglia A., Renzini A., Bergeron P., 1995, ApJ 443, 735.
- [6] Driebe T., Schoenberner D., Bloecker T., Herwig F., 1998, A&A, 339, 123
- [7] Han Z., 1998, MNRAS, 296, 1019.
- [8] Hurley J.R., Tout C.A., Aarseth S.J., Pols O.R., 2000, MNRAS, 323, 630.
- [9] Iben I., Livio M., 1993, PASP 105, 1373.
- [10] Iben I., Tutukov A.V., Yungelson L.R., 1997, ApJ 475, 291.
- [11] Koester D., Herrero A., 1988, ApJ, 332, 910.
- [12] Marsh, T.R., 1989, PASP 101, 1032.
- [13] Marsh, T.R., 1995, MNRAS, 275, L1.
- [14] Marsh, T.R., Dhillon, V.S., Duck, S.R., 1995, MNRAS, 275,
- [15] Maxted P.F.L., Marsh T.R., 1999, MNRAS 307, 122.
- [16] Maxted P.F.L., Marsh T.R., Moran C.K.J., Han Z., 2000, MNRAS, 314, 334.
- [17] Moran C.K.J., Marsh T.R., Maxted P.F.L., 1999, in “Proceedings of the 11th European Workshop on White Dwarfs, ”, ASP Conference Series Vol. 169, J.-E. Solheim, Meištas, ed., p. 275.
- [18] Moran C.K.J., Marsh T.R., Bragaglia A., 1997, MNRAS, 288, 538.
- [19] Nelemans G., Verbunt F., Yungelson L.R., Portegies Zwart S.F., 2000, A&A, 360, 1011.
- [20] Nelemans G., Yungelson L.R., Portegies Zwart S.F., Verbunt F., 2001, A&A, 365, 491.
- [21] Saffer, R.A., Liebert. J., Olszewski., E.W., 1988, ApJ, 334, 947.
- [22] Saffer R.A., Livio M., Yungelson L.R., 1998, ApJ 502, 394.
- [23] Umeda H., Nomoto K., Kobayashi C., Hachisu I., Kato M., 1999, ApJ, 522, L43.