The Gravitational Lens CFRS03.1077111Based on observations with the NASA/ESA Hubble Space Telescope obtained at the Space Telescope Science Institute, which is operated by the Association of Universities for Research in Astronomy Inc., under NASA contract NAS 5-26555.
Abstract
An exquisite gravitational arc with a radius of 21 has been discovered around the field elliptical galaxy CFRS03.1077 during observations of Canada-France Redshift Survey (CFRS) fields. Spectroscopic observations of the arc show that the redshift of the resolved lensed galaxy is z = 2.941. This gravitational lens-source system is well-fitted using the position angle and ellipticity derived from the visible matter distribution and an isothermal mass profile with a mass corresponding to km s-1. Surprisingly, given the evidence for passive evolution of elliptical galaxies, this is in good agreement with an estimate based on the fundamental plane for ellipticals. This, perhaps, indicates that this galaxy has not shared in the significant evolution observed for average elliptical galaxies at z 1. A second elliptical galaxy with similar luminosity from the CFRS survey, CFRS 14.1311 at , is also a lens but in this case the lens model gives a much smaller mass-to-light ratio, i.e., it appears to confirm the expected evolution. This suggests that this pair of field elliptical galaxies may have very different evolutionary histories, a significant result if confirmed. Clearly, CFRS03.1077 demonstrates that these “Einstein rings” are powerful probes of high redshift galaxies.
1 INTRODUCTION
A very beautiful arc structure, characteristic of a lensed object, was noted around the galaxy CFRS03.1077 (Hammer et al., 1995) during analysis of images of high redshift field galaxies. CFRS03.1077 is a bright elliptical galaxy at z = 0.938 and hence is likely to lens background galaxies or quasars. Miralda-Escudé & Lehár (1992) predicted that 100 gravitationally lensed rings per square degree should be observable at optical wavelengths to , given the number of Einstein rings at radio wavelengths and the projected density of galaxies in optical surveys. Indeed, Ratnatunga, Griffiths & Ostrander (1999) report finding 10 good galaxy lens candidates in 0.1 square degrees, based on analyses of Medium Deep Survey images. These, however, have not yet been confirmed and remain only as candidates.
It is now recognized that galaxies which act as gravitational lenses are extremely important tools for studying a variety of cosmological problems including the nature and evolution of the lensing galaxies themselves (Kochanek et al., 2000; Narayan & Bartelmann, 1999; Refsdal & Surdej, 1994; Schneider, 1996). For example, Im, Griffiths & Ratnatunga (1997) showed that observations of seven galaxy lenses favor a nonzero cosmological constant, while Kochanek et al. (2000) and Keeton, Kochanek & Falco (1998) present results on the properties of the lensing galaxies, most of which are early-type. Since the lens models give data on the total (dark + visible) distribution of mass, investigations like the latter are extremely powerful, especially for studying the properties of galaxies at high redshifts where traditional methods become increasingly difficult. Einstein ring lenses provide additional constraints and hence are even more important to the determination of mass distributions of the lensing galaxies (Kochanek, Keeton & McLeod, 2001).
Even though Einstein ring lenses are predicted to be much more common at optical wavelengths than radio, only one optically-identified system has so far been confirmed: 0047-2808 (Warren et al., 1998, 1999). Rather than being initially recognised from an image as a “ring”, this lens was detected through superposition of emission lines from the lensed object on the spectrum of the foreground galaxy. Hewett et al. (2000) and Hall et al. (2000) recently report finding additional candidate lenses in this manner, but these remain to be confirmed. These authors argue that spectroscopic observation of distant early type galaxies is one of the best methods of detecting galaxy lenses, particularly because the presence of spectroscopic features from the source implies that the crucial redshifts of both the source and deflector can be determined. In practice, however, this method is only viable for background galaxies with strong emission lines. Furthermore, galaxy lens candidates are quite easily recognizable with images from or ground-based adaptive optic systems, and disentangling the spectral features arising from the source and deflector galaxies is no longer as difficult with the improved spatial resolution being achieved on modern large ground based telescopes.
In this paper we report on a detailed analysis of the images of the lens and source galaxies related to CFRS03.1077. We also present spectra of these galaxies obtained with the Canada-France-Hawaii Telescope (CFHT) and derive the redshift of the source - a galaxy without strong emission lines. Finally, a simple model of the lens-source system is described.
2 OBSERVATIONS
2.1 imaging
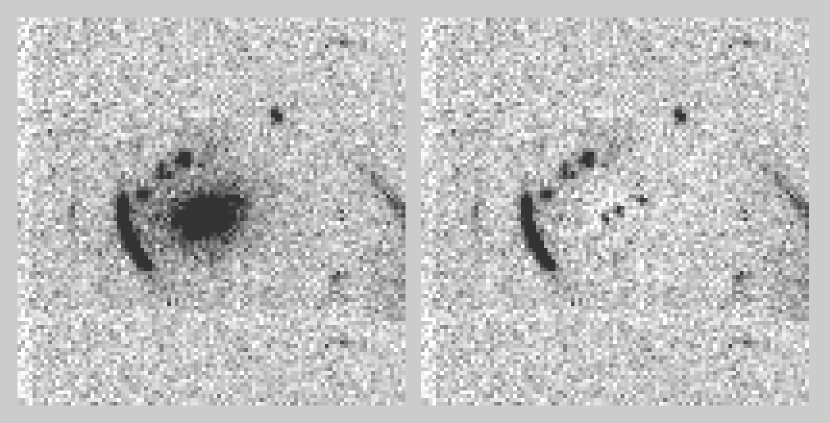
WFPC-2 observations were obtained on 1996 January 10 of the CFRS0300+00 field (Lilly et al. 1995) during a survey of the morphology of high redshift field galaxies in CFRS fields. The total exposure time for the F814W images of the CFRS0300+00 field was 6700s. Even though CFRS03.1077 was not located in the higher resolution PC part of the WFPC-2 field, the arc structure near the galaxy was immediately obvious while preprocessing the data (see Figure 1a) and was clear in the individual frames before stacking.
2.1.1 The Lensing Galaxy
The J2000 coordinates of CFRS03.1077 are 03h 02m 309 +00° 06′ 021. The arc has a radius of and is accurately centered (to within 005) on the galaxy.
Special attention was paid to deriving the parameters of CFRS03.1077. A high S/N point spread function was determined from six stars located at similar locations on images of other fields (since no suitable nearby star was present) and several other fainter stars were used to assess possible errors. Fitting was carried out on a “symmetrized” image (see Schade et al. (1995, 1996) for details) of the galaxy so that the procedure was not perturbed by the presence of the arc or any other images. The best-fit value of the reduced chi-square was 0.9988 for a fit radius of 20 pixels. Subtraction of the model galaxy (see Figure 1b) demonstrates that the resulting fit is an extremely good representation of the galaxy’s luminosity distribution.
The parameters of the galaxy were measured from the combined F814W image with a total integration time of 6700s. The errors in the parameters were estimated from the fits to the five individual images with exposure times of 1100, 1200, or 2100 s. The dispersions among these fits were 013 in , 0.025 in axial ratio (b/a), 28 in position angle, 0.04 mag in total magnitude, and 0.06 mag in central surface brightness. The errors in the stacked image are expected to be roughly times smaller because of better signal-to-noise ratio. These errors are also likely to be systematically over estimated because cosmic rays are not properly removed in the individual images. Possible systematic errors due to imperfect knowledge of the point-spread-function (PSF) were estimated by repeating the fits with several different PSFs from different observations and different positions on the chip. The results show that these systematic errors are a few percent or less in all parameters. The derived parameters depend weakly on the choice of fitting radius (the radius over which was computed) and these were estimated from simulations of this galaxy with realistic backgrounds. For reasonable values of fitting radius, the errors were smaller than 3%, but reached extreme values of 6% for fitting radii much smaller than the half-light radius. We adopt errors corresponding to those from the individual image fits divided by and then add 5% in quadrature to allow for possible systematic errors. Details of the parameters of the lensing galaxy are summarized in Table 1.
At this redshift, the lensing galaxy has a half-light radius of kpc and for H km s-1 Mpc-1, q. The color of the galaxy is typical of galaxies with z 1 in the CFRS sample. The computed rest-frame color is .
2.1.2 The Arc and counter-images
The measured properties of the arc image are given in Table 2. The arc has a length of 21 and is centered on the galaxy to within (the precision of the measurement). The observed surface brightness is 21.2 magnitudes per square arcsecond in the brightest pixel which corresponds to 16.73 in rest-frame AB(2030) magnitudes. This surface brightness is modulated by pixellation and by the convolution with the HST point-spread function. For a compact exponential disk the implied central surface brightness would be about 2 magnitudes brighter than the observed surface brightness and for a compact bulge the implied central surface brightness would be higher by magnitudes. The exact values depend on the details of the luminosity profiles.
The arc is resolved across its narrowest dimension, i.e., it has non-zero intrinsic width compared with the point-spread function of a star on the same frame. One dimensional gaussian fits across the arc at various points along its length give a median observed width (FWHM) of 023 and a dispersion of 0025. For comparison, a fit to a star gives 018, implying an equivalent gaussian width of for the arc itself. Figure 2 shows the brightness profile along the length of the arc (and integrated across the profile). The arc centroid position was traced and the flux extracted from the image as if it were a two-dimensional spectrum. The error bars are based on the number of electrons in the image and the observed sky noise. This figure confirms the visual impression that there is real variation in surface brightness along the length of the arc and the peak of the profile occurs at the center, consistent with a normal galaxy luminosity profile.
In addition to the arc itself, other faint images are evident, especially in the subtracted image (Fig. 1b). Large magnification events such as arcs are generally due to the presence of a source near the caustic lines (e.g., Refsdal & Surdej (1994)). In simple lens geometry configurations (spherical or elliptical) they are usually accompanied by additional images on the opposite side of the lens. Models of the CFRS03.1077 lens indicate that faint images near the position of the lensing galaxy (visible near the center of the lens in Fig. 1b) are likely to be counter-images to the arc. However, they could also be small objects embedded within the lensing galaxy, or simply a projection of foreground/background objects (with the only reservation that if they are unlensed objects, they should be then at a redshift significantly lower than that of the arc source). Unfortunately, we do not have color information of these images. Since their location is very suggestive that they are counter images of the arc and in the absence of other data, we assume in the following that they are, in fact, lensed images.
2.2 CFHT spectroscopy
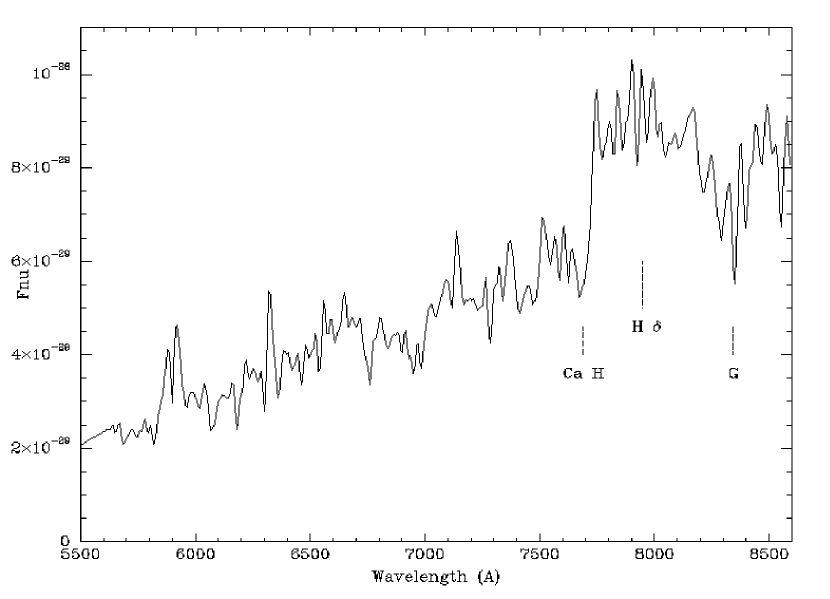
A spectrum of the lensing galaxy, CFRS03.1077, from the original CFRS survey is shown in Figure 3. Based mostly on the location of the 4000Å break and its overall spectral energy distribution, Hammer et al. (1995) assigned a redshift of z = 0.938 with a high confidence level (class 3, see Le Fèvre et al. (1995)). The strong 4000Å break and absence of any [OII] emission indicates that the galaxy is likely to be an elliptical. The slit was positioned EW and its width was 175, so part of the arc was in the MOS spectrograph slit and, indeed, the spectrum of a neighboring object, i.e., the arc, was noted by the CFRS team but no redshift was derived. After recognizing that this was likely a lensed galaxy, this spectrum was re-reduced and analysed but still no redshift determination was possible, partly because the spectrum of the arc was overwhelmed by that of the bright galaxy. (This is unlike the case of CFRS14.1311, where Crampton et al. (1996) were able to subsequently detect strong emission lines of the background quasar).
Spectra of the arc alone were obtained with the OSIS spectrograph on CFHT on 1997 August 26–28. Unfortunately, the seeing was only average during these exposures (05 – 08) and the OSIS fast guiding system, which would have improved the image quality somewhat, was not available. A 075 slit was aligned along the brightest part of the arc at PA = 20 on two of the nights, but a 10 slit had to be used during poorer seeing on 1997 Aug 27. Two spectra were obtained on 1997 Aug 26, three on Aug 27 and five on Aug 28. All exposures were 1800s, so the total exposure is equivalent to five hours. Small shifts of the arc along the slit were made between exposures to improve the flat fielding and hence signal-to-noise of the final spectra. The spectra were recorded with the STIS 2 CCD with 21 micron pixels which correspond to 3.4Å per pixel with the V150 grism and 014 per pixel in the spatial dimension. The wavelength resolution, set by the 075 slit, is 17Å and the usable wavelength range is 4000 – 9000Å.
The two dimensional spectra were bias subtracted and flat fielded using a normalized flat derived from spectra of internal calibration lamps. Two dimensional sections were then extracted from each image, centered on the spectrum of the arc. These were shifted to compensate for any wavelength shifts (determined from the night sky lines), combined and then a one dimensional spectrum was extracted. The background-subtracted two-dimensional spectrum was inspected to see if there was any indication of spatial variations of the spectral features along the arc, but none was detectable. The spectrum width is 14 pixels or 20, consistent with length of the arc (see Figures 1 and 2).
A portion of the spectrum of the arc is shown in Figure 4. A spectrum of Feige 24 was used to provide flux calibration, although the absolute calibration is uncertain due to the narrow slit width. The spectrum was cross-correlated against ultraviolet spectra of NGC1741 and NGC4214, two prototypical starburst galaxies (Conti et al., 1996; Leitherer et al., 1996). Since no emission lines are obvious in our spectrum of the arc, the strong Ly emission lines were first excised from these starburst spectra. Both of the resulting templates give a strong cross correlation peak at z = 2.94, the same redshift as derived from a visual examination of the spectrum of the arc. The rest wavelengths of the most prominent features familiar in nearby starburst galaxies are identified in Fig. 4, with a spectrum of NGC4214 shown for comparison. In common with many of the z 3 galaxies observed, for example, by Steidel et al. (1996) and Pettini et al. (1997), no Ly emission is visible, the continuum is flat and drops shortward of Ly , and numerous stellar and interstellar lines of C, O, Si and Al are visible. As with all such galaxies (Pettini et al., 1997), there is considerable scatter among the velocities derived from the individual features, and we adopt z = 2.941 with an estimated error of 0.008. We note that, in retrospect, some of the features identified in Fig. 4 are visible on our original MOS spectrum of the arc, lending additional weight to our redshift determination.
3 Lens Modelling
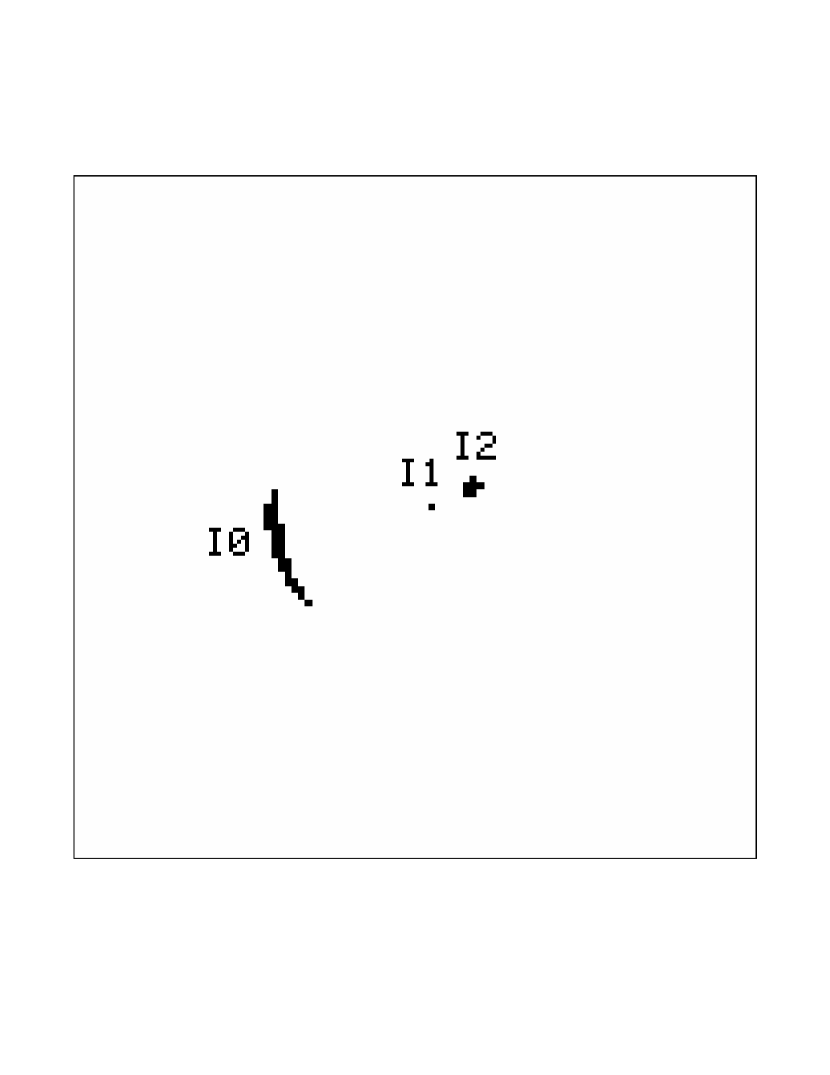
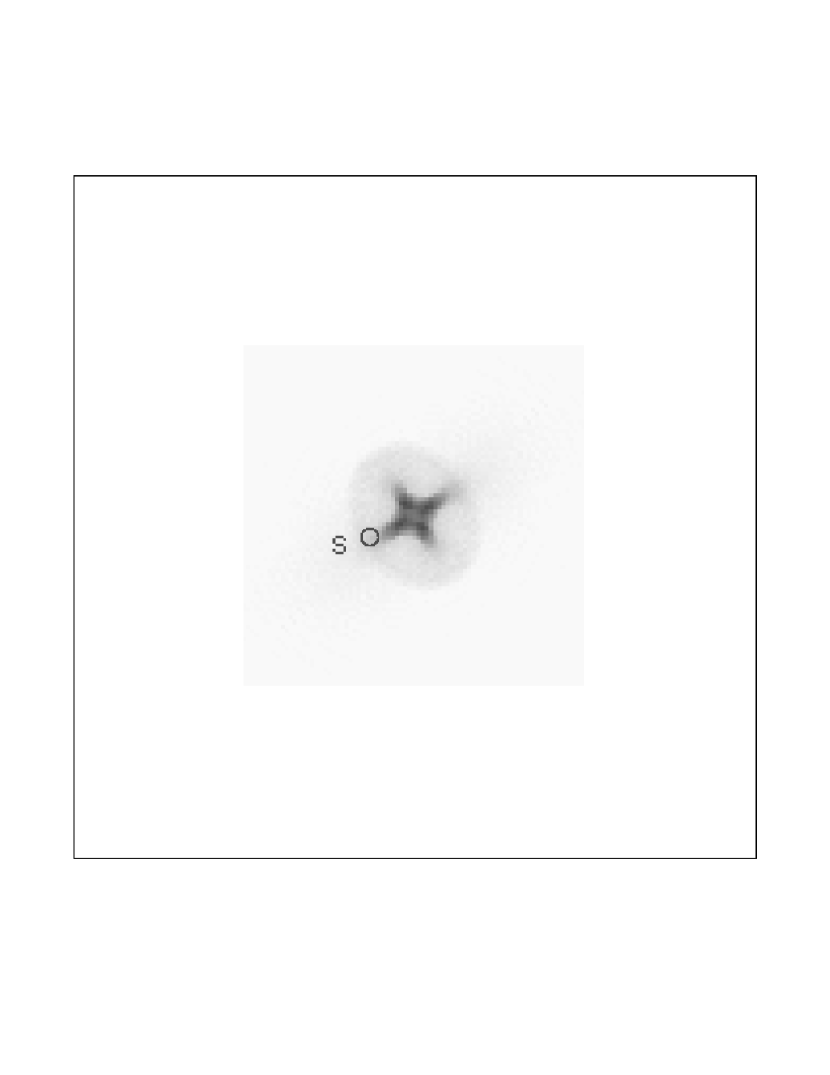
The lens CFRS03.1077 was modelled assuming an isothermal mass profile. Gravitational bending angles have been computed using the code AIGLE (see Hammer et al. (1997)) for an elliptical lens with an isothermal profile () where rc is the core radius. Mass distributions are used rather than potentials, to avoid any further assumptions in mass estimations. The arc itself can be perfectly reproduced by the model, assuming a uniform circular source (radius rs = 01) at z = 2.941, and a lens with parameters provided by the light distribution (see Table 1). However, since the true lensing parameter is the mass enclosed within a circle defined by the arc, there is a clear degeneracy between the core radius and the line of sight velocity dispersion (). It is beyond the scope of this paper to accurately evaluate the available range of acceptable parameters, but an initial evaluation gives 70km s-1, and small core radii (rc from 01 to 03 ). It is more interesting to note that for a large fraction of the (rc, ) configurations, the model predicts additional images on the other side of the lensing galaxy. These fall within 003 of the locations of the two faint blobs on the opposite side of the lensing galaxy (discussed in section 2.1.2) if a slight offset of the lens position angle, from 104 to 122° is assumed. Figure 5a shows a simulation of the three images (I0: the arc, I1 and I2: the blobs on the other side of the lens, near its center). Figure 5b shows the location of the source relative to the area of high magnification. The source falls at the edge of the elliptical caustic lines, most of its surface within the three image area. The magnification factor (10 for the arc alone) provides a magnitude for the unlensed source of 24.4.
The requirement to properly reproduce this three image configuration tightly constrains the lensing parameters. Indeed the actual number of constraints is 8 (6 for the image positions and two for the intensity ratios), while the number of parameters is only 6 (rc, , ellipticity, P.A. and the source location). This leads us to believe that I1 and I2 are likely counter images of the arc, with the result that the mass estimates of the lens are very accurate. Actually the lensing model predicts an accuracy as small as 2 km s-1 for the lens velocity dispersion. The cosmological parameter ( or ) is another factor of uncertainty. However, the gravitational bending angle depends on the ratio of the angular diameter distances between the lens and the source and of the lens and so the dependency on the cosmological parameters is small. For the present example, = 0.5 leads to = 3902 km s-1 and = 0 to = 3842 km s-1. Our determination of the mass parameter can be summarized by = 3875 km s-1.
3.1 Evolution of early type galaxies
The photometric model fitting to the luminosity profile of the lensing galaxy that was described in section 2.1.1 gives the central surface brightness and half-light radius corresponding to an law. These values allow us to derive an expected velocity dispersion from the fundamental plane relations between size, surface brightness, and velocity dispersion. Jorgensen, Franx & Kjaergaard (1996) give the required relations. The observed central surface brightness is in . At a redshift of this corresponds to where the latter term is the correction from observed wavelength to -band. This value, , converts to and surface brightness at , . Using the relations given by Jorgensen, Franx & Kjaergaard (1996) yields a velocity dispersion of . This is in very good agreement with the mass parameter derived from the lensing model above. The fact that it agrees so well, however, poses another problem in that it apparently represents a contradiction to the passive evolution model for elliptical galaxies. For example, Schade et al. (1999) claim evolution of nearly 1 magnitude in luminosity (or, equivalently, surface brightness) for an elliptical at this redshift. In fact, the lensing galaxy is one of the sample of elliptical galaxies in the CFRS/LDSS imaging survey that was used to derive the evolution. In order to estimate mass from the photometric parameters of this galaxy the observed surface brightness should be “de-evolved”, that is, the central surface brightness should be made one magnitude fainter before it is compared to the local () fundamental plane. If this is done, a mass estimate of is obtained, obviously very significantly lower than the mass estimate from the lens model.
This result for CFRS03.1077 is contrary to results from studies of the evolution of the fundamental plane at moderate redshift (Kelson, Illingworth, van Dokkum & Franx, 2000; van Dokkum, Franx, Kelson, & Illingworth, 2001) and of lensing galaxies on average. Kochanek et al. (2000) present data from 30 lenses and conclude that the fundamental plane for both field galaxies and cluster galaxies are similar and that they are representative of passively evolving populations formed at z 2. That view is consistent with the fundamental plane studies. The reason that CFRS03.1077 does not appear to share this behavior is not obvious. Is there substantial variance in the evolution history of massive elliptical galaxies? An examination of Figure 3 from Schade et al. (1999) shows that this particular galaxy lies within its error bar of the no evolution locus for elliptical galaxies in the plane and is one of the most deviant points from the evolving relation. The only other very luminous elliptical galaxy in the study by Schade et al. (1999) (CFRS 14.1311 at ) also appears in Figure 3 of that paper and lies exactly on the evolving relation implying an evolution in luminosity (or, equivalently, in surface brightness) of magnitude. Remarkably, that galaxy is an Einstein Cross lens discovered by Ratnatunga et al. (1995) and studied by Crampton et al. (1996) who report a velocity dispersion of 230 km s-1 as implied by the lens model. If the observed values of and for CFRS 14.1311 are converted into a velocity dispersion via the local fundamental plane then a value of km s-1 is obtained. If an evolution of one magnitude in surface brightness is then applied this is reduced to km s-1, roughly consistent with the value derived from the lens model. In other words, CFRS14.1311 behaves as expected but CFRS03.1077 does not. It should be noted that neither of these galaxies have detectable levels of [OII]3727 emission which would indicate star formation and, furthermore, the galaxy with lower surface brightness (CFRS03.1077) is the bluer of the two galaxies, opposite to what might be expected if a recent burst of star formation was a factor.
In summary, we have two independent methods of estimating the velocity dispersion of these two lens galaxies. The photometric method uses size and surface brightness to estimate the expected velocity dispersion assuming that these galaxies lie on either the local fundamental plane or on an evolved fundamental plane. The lens method is independent of the galaxy light and depends only on the lens geometry. The results of these two methods can be made to be consistent only if CFRS03.1077 lies on the un-evolved fundamental plane whereas CFRS 14.1311 has evolved by magnitude at . In other words, the results suggest that these two highly luminous field elliptical galaxies may have had very different evolutionary histories.
4 CONCLUSION
Our spectroscopic observations confirm that the arc surrounding the z = 0.938 elliptical galaxy CFRS03.1077 is indeed a lensed image of a background galaxy. The redshift of this galaxy is z = 2.941. Standard lens models easily reproduce the observed arc structure and also suggest that two faint objects observed near the lensing galaxy on the opposite side to the arc are lensed images. Observations at other wavelengths should be obtained to determine the colors of these objects. If they are the same as the arc, then this would be further evidence that they are lensed images and can be confidently used to constrain the lens geometry. Multi-wavelength observations of CFRS03.1077 could also be used to examine whether the internal colors of the galaxy itself are normal or show strong variations indicative of recent star formation (cf Menanteau, Abraham & Ellis (2001)). If the internal colors are not homogeneous this may help explain why the line of sight velocity dispersion determined from the lens model is higher than expected from fundamental plane considerations assuming passive evolution since .
CFRS03.1077 demonstrates the potential offered by detailed study of Einstein ring lenses. With the advent of 8m class telescopes, especially those equipped with integral field spectrographs, the spectroscopic data reported here can now be very significantly improved. Images at other wavelengths should be obtained to establish or identify additional lensed images in order to more tightly constrain the lens model.
References
- Conti et al. (1996) Conti, P.S., Leitherer, C. & Vacca, W.D. 1996, ApJ, 461, L87
- Crampton et al. (1996) Crampton, D., Le Fèvre, O., Hammer, F. & Lilly, S.J. 1996, A&A, 307, L53
- Jorgensen, Franx & Kjaergaard (1996) Jorgensen, I., Franx, M., & Kjaergaard,P. 1996 MNRAS, 280, 167
- Hall et al. (2000) Hall, P.B. et al. 2000, AJ, 120, 1660
- Hammer et al. (1995) Hammer, F., Crampton, D., Le Fèvre, O. & Lilly, S.J. 1995, ApJ, 455, 88
- Hammer et al. (1997) Hammer, F., Gioia, I.M., Shaya, E.J., Teyssandier, P., Le Fevre, O. & Luppino, G. 1997, Ap J, 491, 477
- Hewett et al. (2000) Hewett, P.C., Warren, S.J., Willis, J.P., Bland-Hawthorn, J., & Lewis, G.F. 2000, in “Imaging the Universe in Three Dimensions”, ed. W. van Breugel and J. Bland-Hawthorn, PASP Conf. Ser., 95, 94
- Im, Griffiths & Ratnatunga (1997) Im, M., Griffiths, R.E. & Ratnatunga, K.U. 1997, ApJ, 475, 457
- Keeton, Kochanek & Falco (1998) Keeton, C.R., Kochanek, C.S. & Falco, E.E. 1998, ApJ, 509, 561
- Kelson, Illingworth, van Dokkum & Franx (2000) Kelson,D., Illingworth,G., van Dokkum, P., & Franx, M. 2000 ApJ, 531, 137
- Kochanek, Keeton & McLeod (2001) Kochanek, C.S., Keeton, C.R., & McLeod, B.A. 2001, ApJ, 547, 50
- Kochanek et al. (2000) Kochanek, C.S., et al. 2000, ApJ, 543, 131
- Le Fèvre et al. (1995) Le Fèvre, O., Crampton, D., Lilly, S.J., Hammer, F. & Tresse, L. 1995, ApJ, 455, 60
- Leitherer et al. (1996) Leitherer, C., Vacca, W.D., Conti, P.S., Filippenko, A.V., Robert, C. & Sargent, W.L.W 1996, ApJ, 465, 717
- Lilly et al. (1995) Lilly, S.J., Le Fèvre, O., Crampton, D., Hammer, F. & Tresse, L. 1995, ApJ, 455, 50
- Menanteau, Abraham & Ellis (2001) Menanteau, F., Abraham, R.G., & Ellis, R.S. 2001, MNRAS, 322, 1
- Miralda-Escudé & Lehár (1992) Miralda-Escudé , J. & Lehár, J. 1992, MNRAS, 259, 31
- Narayan & Bartelmann (1999) Narayan, R. & Bartelmann, M. 1999, in A. Dekel and J.P. Ostriker, eds. Formation of Structure in the Universe. Cambridge Univ. Press, 360
- Pettini et al. (1997) Pettini, M., Steidel, C.C., Dickinson, M., Kellog, M., Giavalisco, M., Adelberger, K.L. 1997, in The Ultraviolet Universe at Low and High Redshift, ed. W. Waller, Woodbury, AIP press, p 279
- Ratnatunga et al. (1995) Ratnatunga, K.U., Ostrander, E.J., Griffiths, R.E., & Im, M. 1995, ApJ, 453, L5
- Ratnatunga, Griffiths & Ostrander (1999) Ratnatunga, K.U., Griffiths, R.E., & Ostrander, E.J. 1999, AJ, 117, 2010
- Refsdal & Surdej (1994) Refsdal, S. & Surdej, J. 1994, Rep. Prog. Phys, 57, 117
- Schade et al. (1995) Schade, D., Lilly, S., Crampton, D., Le Fèvre, O., Hammer, F., & Tresse, L. 1995, ApJ, 451, 1
- Schade et al. (1996) Schade, D., Lilly, S., Le Fèvre, O., Hammer, F., & Crampton, D. 1996, ApJ, 464, 79
- Schade et al. (1999) Schade, D. et al. 1999, ApJ, 525, 31
- Schneider (1996) Schneider, P. 1996, in E. Martinez-Gonzalez and J.L. Sans, eds. The universe at high z, large scale structure and the cosmic microwave background: Proceedings of an Advanced Summer School, held at Laredo, Cantabria, Spain, 148.
- Steidel et al. (1996) Steidel, C.C., Giavalisco, M., Pettini, M., Dickinson, M. & Adelberger, K.L. 1996, ApJ, 462, L17
- van Dokkum, Franx, Kelson, & Illingworth (2001) van Dokkum,P., Franx,M., Kelson,D., & Illingworth,G. 2001, ApJ, 553, L39
- Warren et al. (1998) Warren, S.J., Iovino, A., Hewett, P.C. & Shaver, P.A. 1998, MNRAS, 299, 1215
- Warren et al. (1999) Warren, S.J., Lewis, G.F., Hewett, P.C., Moller, P., Shaver, P., & Iovino, A. 1999, A&A, 343, L35
| Re | b/a | PA | ||||
|---|---|---|---|---|---|---|
| arcsec | deg | mag | mag | mag | mag | |
| 1.740.1 | 0.670.03 | 104.43 | 20.360.05 | 2.130.15 | 22.770.1 | 1.530.2 |
| z | Length | Width | SB( | IAB | M(B)AB |
|---|---|---|---|---|---|
| arcsec | arcsec | mag | mag | mag | |
| 2.941 | 2.1 | 0.170.02 | 21.2 | 21.94 | 22.5 |