Dust emission and star formation toward a redshift 5.5 QSO
We report observations of the low-luminosity quasar RD J030117+002025 (RD0301 hereafter) at 250 GHz (1.20 mm) using the Max-Planck Millimeter Bolometer (MAMBO) array at the IRAM 30-meter telescope. The quasar was detected with a 1.2 mm flux density of . The lack of detectable 1.4 GHz radio emission indicates that the millimeter emission is of thermal nature, making RD0301 the most distant dust-emission source known. When matching a 50 K grey body thermal far-infrared (FIR) spectrum to the observed millimeter flux we imply a FIR luminosity , which is comparable to the quasar’s optical luminosity. If the FIR luminosity arises from massive star formation, the implied star formation rate would be , comparable to that of the starburst galaxies which dominate the average star formation and FIR emission in the early Universe. The FIR luminosity of RD0301 is close to the average of that found in optically far more luminous high-redshift quasars. The comparably high millimeter to optical brightness ratio of RD0301 is further evidence for that there is no strong correlation between the optical and millimeter brightness of high-redshift quasars, supporting the idea that in high-redshift quasars the dust is not heated by the AGN, but by starbursts.
Key Words.:
Galaxies: formation – Galaxies: starburst – Galaxies: high-redshift – Galaxies: quasars: individual: RD J030117+002025 – Quasars: dust emission – Millimeter1 Introduction
Many high-redshift quasars (QSOs) have recently been found through wide field imaging surveys, notably the Sloan Digital Sky Survey (SDSS; Schneider et al. sch01 (2001); Anderson et al. and01 (2001)) and the Digital Palomar Sky Survey (DPSS; Kennefick et al. 1995a ,1995b ; Djorgovski et al. djo99 (1999)). Now over 250 QSOs are known with redshifts , thirteen of which are at (Fan et al. fan99 (1999), 2000a , 2000b ; Zheng et al. zhe00 (2000); Stern et al. ste00 (2000); Sharp et al. sha01 (2001); Fan et al. fan01 (2001)) and one at (Fan et al. fan01 (2001)). All but one of the QSOs were found from magnitude limited surveys, limiting their implied rest frame blue magnitudes to .
In a 74 arcmin2 field observed for the SPICES survey (Stern et al. ste01 (2001)), Stern et al. (ste00 (2000)) discovered the redshift 5.50 QSO RD (i.e., “R-band Dropout”) J030117+002025 (RD0301 hereafter), which has an -band AB magnitude of 23.4 and in an Einstein-de Sitter Universe (, ), and in a -cosmology (, , ) which we adopt throughout this paper. RD0301 is significantly fainter than the typical QSO found in the wide field SDSS and DPSS surveys. The discovery of such a very high redshift QSO was surprising because the surface density of such objects, as implied by the intermediate-redshift QSO luminosity function and redshift evolution models, is so low that the probability to find one in the observed field is only (Stern et al. ste00 (2000)). The discovery may therefore imply that the luminosity evolution of faint high-redshift QSOs is weaker than expected, and that there could be a larger, optically faint QSO population at high redshifts. This possibility is particularly interesting in terms of which sources re-ionize the early Universe (cf., the recent Gunn-Peterson trough results of Becker et al. [bec01 (2001)] and Djorgovski et al. [djo01 (2001)]).
Another important question in studies of the early Universe is how the growth of massive black holes relates to the formation of early stellar populations. A tight correlation between black hole masses and bulge luminosities or velocity dispersions in local galaxies indicates that their formation was closely related (Magorrian et al. mag98 (1998)). The recent detection of strong thermal dust emission from many high-redshift QSOs shows that vigorous star formation is coeval with black hole growth (Carilli et al. 2001a ; Omont et al. omo01 (2001); Isaak et al. isa01 (2001)). Interestingly, the FIR luminosity of these QSOs does not seem to be well correlated with their optical luminosity in the studied range of optical luminosities, to . A similar result was previously found also in lower redshift, lower optical luminosity QSOs (Sanders et al. san89 (1989); Chini et al. chi89 (1989)). Such a lack of correlation might suggest that the warm dust is not heated by the QSO. Instead, star formation and black hole accretion could have had a common cause, which might be the infall of material toward the center of the host galaxy.
The QSOs observed in the millimeter and submillimeter surveys are the optically most luminous objects, and their implied optical luminosities are on average ten times higher than their FIR luminosities, so that dust heating by the AGN cannot be excluded on energetic grounds. It is of great interest therefore to investigate whether strong millimeter emission is also found in high-redshift QSOs which are optically much fainter than those observed so far. In this respect, RD0301 is a unique object: it is the optically least luminous QSO known at , and it is one of the highest redshift quasars ever detected.
Searching for high-redshift dust emission is of great interest also because for them there was little time to produce the observed dust. At redshift 5.5, the universe was about 1 Gyr old, a time not much longer than the dynamical timescale of typical galaxies. Observing large amounts of dust at such redshifts thus sets back the first epochs of vigorous star formation irrespective of whether the observed dust was heated by an AGN or a starburst.
2 Observations and results
Our observations of RD0301 were made during the winters of 2000 and 2001 with the 37-channel Max-Planck Millimeter Bolometer array (MAMBO; Kreysa et al. 1999a , 1999b ) at the IRAM 30-meter telescope on Pico Veleta, Spain. MAMBO is sensitive between 190 and 315 GHz, with half-power sensitivity limits at 210 and 290 GHz, and an effective bandwidth center for steep thermal spectra at GHz. The bolometer feed horns are matched to the telescope FHWM beam at 1.2 mm of . They are arranged in an hexagonal pattern with a beam separation of 22′′. The source was observed with the array’s central channel, using the “on-off” observing mode, in which the telescope secondary mirror chops in azimuth by 30 to 50′′ at a rate of 2 Hz. For on-off observations the target is positioned on the array’s central bolometer, and after every 10 seconds of integration the telescope is nodded so that the previous “off” beam, which typically misses the other bolometer beams, becomes the “on” beam. Thus for only half the on-sky observing time the target is positioned on any bolometer. A scan usually lasts for 12 or 16 such 10 sec sub-scans, i.e., 6 to 8 on-off cycles.
The telescope pointing was monitored regularly on two deg distant pointing sources, 0336019 and 0221067, and was in most cases stable within . The signals from the pointing sources were monitored for sensitivity problems. The gain calibration was performed using observations of Mars, Uranus, and Ceres. We here adopt a calibration factor of 12 500 counts per Jansky for 0.5 sec integration bins, a value which is expected to be accurate to within 20%. The point-source sensitivity was on average , i.e., in one second of on-sky (on and off source) integration, an rms noise level of 30 mJy is reached.
The data were analyzed using the MOPSI software package created by Robert Zylka (see Zylka zyl98 (1998)). Correlated sky noise was subtracted from each channnel as the weighted mean of the signals from the best-correlating surrounding channels.
RD0301 was observed on seventeen different nights between February 2000 and March 2001. The atmospheric conditions were mostly very good, with zenith opacities between 0.1 and 0.2. From a total of 184 scans, each with 120 or 180 sec on-sky exposure, we eliminated one observation (1 March 2000) of 15 scans because of a 5′′ pointing drift. Six other scans were eliminated throughout because they showed unusual noise, possibly due to passing clouds. To improve the quality of the data we furthermore ignored 10 scans at elevations below 27 degrees, where the gain-elevation and opacity corrections become large and uncertain.
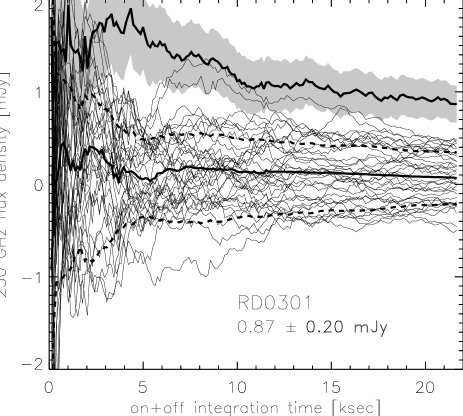
The total on-sky integration time was 6.0 hours. The scans were reduced individually, and the signals were then averaged, which yields a target flux of (Fig. 1). If the scans with elevation deg were included, the signal rises to mJy. When weighting the scan signals by each scans’ inverse average mean square noise level, the signal becomes . The dispersion in the integrated signals of the off-target channels is 0.26 mJy. The source signal appears stronger in the winter 1999/2000 observations, which might in part be due to the fact that many of these observations were performed at low elevation, making them subject to larger gain-elevation and opacity uncertainties.
The coadded data of both years show an average signal that stabilizes at a significant level compared with the target channel’s integrated noise, and also compared with the signal of the off-target channels. We therefore believe that the source is detected with the confidence level suggested by the errors quoted.
To our knowledge this is the deepest integration ever at millimeter or submillimeter wavelengths, and the faintest thermal emission ever detected. As a promising outlook we note that this object would be detected by ALMA in a few seconds, with an angular resolution of less than 0.1 arcsec.
3 Discussion
3.1 Thermal nature of the millimeter emission
At redshift 5.5 our observing frequancy of 250 GHz corresponds to an emitted frequency of 1625 GHz or a wavelength of 185 . From a flux measurement at only one frequency we cannot distinguish whether the emission follows a steep thermal spectrum, or constitutes the millimeter extension of a radio synchrotron spectrum. The VLA 1.4 GHz FIRST survey (Becker, White & Helfand bec95 (1995)) however yields a 5 upper limit flux density of 1 mJy within 30′′ from RD0301. Since rising non-thermal spectra are not observed at high radio frequencies, it is unlikely that the millimeter emission is synchrotron radiation. Carilli et al. (2001a , 2001b ) show that for most of the high-redshift QSOs detected at 1.2 mm warm dust is the likely source of the emission.
3.2 FIR luminosity, dust mass, and star formation rate
We therefore conclude that the millimeter flux of RD0301 is thermal in nature. When matching the observed 1.2 mm flux of 0.87 mJy to a grey body with a dust temperature of 50 K and an emissivity index (well adapted for high-redshift sources – see, e.g., Benford et al. 1999), the FIR luminosity of RD0301 is , and the implied dust mass . The FIR luminosity of RD0301 is comparable to its optical luminosity, , given by the rest frame blue magnitude (for a -cosmology). We here adopted the blue luminosity bolometric correction factor of derived for the PG sample by Elvis et al. (elv94 (1994)).
Both the FIR luminosity and the dust mass are comparable to those derived for local infrared-luminous galaxies such as Arp 220 and Mrk 231 (e.g., Radford et al. rad91 (1991)). The thermal luminosity of RD0301 is comparable also to that of the bright high-redshift starburst galaxies found in deep optical surveys (Adelberger & Steidel ade00 (2000)), and of those thought to be producing the bulk of the FIR background emission (Peacock et al. pea00 (2000)). If the FIR luminosity of RD0301 arose from a continuous starburst of age 10 to 100 Myr with a modified Salpeter IMF (see Omont et al. omo01 (2001) for details on the adopted starburst model), the implied star formation rate would be . This value again is similar to those inferred for Arp 200 and Mrk 231.
3.3 Comparison with the SDSS and DPSS QSOs
The millimeter flux of RD0301 is typical for the optically brightest high-redshift QSOs. When averaging (as if we observed one single object) the MAMBO observations of the 112 redshift 3.6 to 5.0 QSOs observed in the Carilli et al. (2001a ) SDSS and Omont et al. (omo01 (2001)) DPSS surveys, one obtains an average flux density of mJy, which implies an average luminosity of . The dust luminosity of RD0301 is therefore close to the average dust luminosity of a sample of quasars with , sources which are optically 10 to 100 times brighter than RD0301.

The mean blue magnitudes of the Carilli et al. (2001a ) and Omont et al. (omo01 (2001)) QSOs are and mag, respectively (Fig. 2). Although the QSOs of these samples span a range of about 25 in optical brightness, the DPSS QSOs studied by Omont et al. (omo01 (2001)) are on average twice as bright in the optical as the SDSS QSOs observed by Carilli et al. (2001a ). Similarly, the average 1.2 mm flux of the QSOs in the respective samples differs by a factor two, mJy versus mJy (large squares in Fig. 2). However, the significance of a possible correlation between the average optical and millimeter brightness of high QSOs remains low since the scatter in both quantities is much larger than the difference between the samples’ averages (see Omont et al. [omo02 (2002)] for a detailed statistical discussion).
RD0301 does not follow the possible trend of increasing millimeter flux with optical luminosity seen in the QSO millimeter surveys, as Fig. 2 well illustrates. Further (sub)millimeter observations of optically faint () high-redshift QSOs are needed to clarify the relation between their thermal and optical luminosities. A lack of such a correlation would support the idea that the dust heating is caused by young, massive stars, and not by the AGN. This hypothesis is also supported by the detection of CO emission in a number of high-redshift QSOs (Guilloteau gui01 (2001); Cox et al. cox02 (2002)), and by the lack of strong radio emission from most of them (Carilli et al. 2001b ).
Alternatively, unification models of AGN might not necessarily predict a strong correlation between the orientation-dependent optical emission and the isotropic FIR flux from the AGN. But still the AGNs’ FIR flux should correlate well with its hard X-ray emission, which does not suffer much from extinction. Millimeter-studies of high-redshift, hard X-ray sources would be most useful to address this interesting issue (e.g. Page et al. pag01 (2001)). SIRTF observations of mid-IR PAH features should also be able to clarify the origin of the FIR emission: a strong correlation between PAH and FIR emission supports the starburst origin of the FIR luminosity (Genzel et al. gen98 (1998)).
Acknowledgements.
We wish to thank E. Kreysa, L. Reichertz and the MPIfR bolometer group for building MAMBO, and R. Zylka for providing the excellent MOPSI data reduction package. Thanks also to Alain Omont, Chris Carilli, Hauke Voss, Alexandre Beelen, and the IRAM staff for help with the observations and interpretation. The constructive comments and criticism from Daniel Stern are much appreciated. IRAM is supported by INSU/CNRS (France), MPG (Germany), and IGN (Spain).References
- (1) Adelberger, K. L., Steidel, C. C. 2000, ApJ, 544, 218
- (2) Almaini, O., Lawrence, A., & Boyle, B. J. 1999, MNRAS, 305, L59
- (3) Anderson, S. F., Fan, X., Richards, G. T., et al. 2001, AJ, 122, 503
- (4) Becker, R. H., White, R. L., & Helfand, D.J . 1995, ApJ, 450, 559
- (5) Becker, R. H., Fan, X., White, R. L., et al. 2001, AJ, 122, 2850
- (6) Benford, D., Cox, P., Omont, A., Phillips, T. G., & McMahon, R. G. 1999, ApJ, 518, L65
- (7) Carilli, C. L., Bertoldi, F., Menten, K. M., et al. 2001a, ApJ, 555, 625
- (8) Carilli, C. L., Bertoldi, F., Omont, A., Cox, P., McMahon, R. G., & Isaak, K. G. 2001b, AJ, 122, 1679
- (9) Chini, R., Kreysa, E., & Biermann, P. L., 1989, A&A, 219, 87
- (10) Cox, P., Omont, A., Djorgovski, S. G., Bertoldi, F., Pety, J., Carilli, C. L., Isaak, K. G., & McMahon, R. G. 2002, A&A,, submitted
- (11) Djorgovski, S. G. 1999, in The Hy-Redshift Universe: Galaxy Formation and Evolution at High Redshift, ASP Conference Proceedings, Vol. 193, A. J. Bunker & W. J. M. van Breugel (eds.), p. 397
- (12) Djorgovski, S. G., Castro, S., Stern, D., & Mahabal, A. A. 2001, ApJ, 560, L5
- (13) Elvis, M., Wilkes, B. J., McDowell, J. C., et al., 1994, ApJS 95, 1
- (14) Fan, X., Strauss, M. A., Schneider, D. P., et al. 1999, AJ, 118, 1
- (15) Fan, X., Strauss, M. A., Schneider, D. P., et al. 2000a, AJ, 119, 1
- (16) Fan, X., White, R. L., Davis, M., et al. 2000b, AJ, 120, 1167
- (17) Fan, X., Narayanan, V. K., Lupton, R. H., et al. 2001, AJ, 122, 2833
- (18) Genzel, R., Lutz, D., Sturm, E., Egami, E., Kunze, D., Moorwood, A. F. M., Rigopoulou, D., Spoon, H. W. W., Sternberg, A., Tacconi-Garman, L. E., Tacconi, L., & Thatte, N. 1998, ApJ, 498, 579
- (19) Guilloteau, S. 2001, in Astronomy with ALMA, ed. A. Wootten, ASP Conference Series, in press
- (20) Isaak, K. G., Priddey, R. S., McMahon, R. G., Omont, A., Peroux, C., Sharp, R. G., & Withington, S. 2001, MNRAS, 329, 149
- (21) Kennefick, J. D., De Carvalho, R. R., Djorgovski, S. G., et al. 1995a, AJ, 110, 78
- (22) Kennefick, J. D., Djorgovski, S. G., & Calvalho, R. R. 1995b, AJ, 110, 2553
- (23) Kreysa, E., et al. 1999a, SPIE 3357, 319
- (24) Kreysa, E., Gemünd, H.-P., Gromke, J., et al. 1999b, Infrared Physics & Technology 40, 191
- (25) Magorrian, J., Tremaine, S., Richstone, D., et al. 1998, AJ, 115, 2285
- (26) Omont, A., Cox, P., Bertoldi, F., McMahon, R. G., Carilli, C. L., & Isaak, K. G. 2001, A&A, 374, 371
- (27) Omont, A., Beelen, A., Bertoldi, F., Cox, P., McMahon, R. G., Carilli, C. L., & Isaak, K. G. 2002, A&A, in preparation
- (28) Page, M. J., Stevens, J. A., Mittaz, J. P. D., & Carrera, F. J. 2001, Science 294, 2516
- (29) Peacock, J. A., et al. 2000, MNRAS, 318, 535
- (30) Radford, S. J. E., Solomon, P. M., & Downes, D. 1991, ApJ, 368, L15
- (31) Sanders, D. B., Phinney, E. S., Neugebauer, G., Soifer, B. T., & Matthews, K., 1989, ApJ, 347, 29
- (32) Schneider, D. P., Fan, X., Strauss, M. A., et al. 2001, AJ, 121, 1232
- (33) Sharp, R. G., McMahon, R. G., Irwin, M. J., & Hodgkin, S. T. 2001, MNRAS, 236, L45
- (34) Stern, D., Spinrad, H., Eisenhardt, P., Bunker, A. J., Dawson, S., Stanford, S. A., & Elston, R. 2000, ApJ, 533, L75
- (35) Stern, D., Connolli, A., Eisenhardt, P., et al. 2000, proceedings of the ESO/ECF workshop on Deep Fields, 9-12 Oktober 2000, Garching, ed. S. Cristiani et al., (Springer) p. 76
- (36) Zheng, W., et al. 2000, AJ, 102, 1607
- (37) Zylka, R. 1998, The MOPSI Cookbook, www.mpifr-bonn.mpg.de/staff/bertoldi/mambo/