The FUV spectrum of TW Hya. I. Observations of H2 Fluorescence1
Abstract
We observed the classical T Tauri star TW Hya with HST/STIS using the E140M grating, from 1150–1700 Å, with the E230M grating, from 2200–2900 Å, and with FUSE from 900–1180 Å. Emission in 143 Lyman-band H2 lines representing 19 progressions dominates the spectral region from 1250–1650 Å. The total H2 emission line flux is erg cm-2 s-1, which corresponds to at TW Hya’s distance of 56 pc. A broad stellar Ly line photoexcites the H2 from excited rovibrational levels of the ground electronic state to excited electronic states. The C II 1335 Å doublet, C III 1175 Å multiplet, and C IV 1550 Å doublet also electronically excite H2. The velocity shift of the H2 lines is consistent with the photospheric radial velocity of TW Hya, and the emission is not spatially extended beyond the resolution of HST. The H2 lines have an intrinsic FWHM of km s-1. One H2 line is significantly weaker than predicted by this model because of C II wind absorption. We also do not observe any H2 absorption against the stellar Ly profile. From these results, we conclude that the H2 emission is more consistent with an origin in a disk rather than in an outflow or circumstellar shell. We also analyze the hot accretion-region lines (e.g., C IV, Si IV, O VI) of TW Hya, which are formed at the accretion shock, and discuss some reasons why Si lines appear significantly weaker than other TR region lines.
1 INTRODUCTION
T Tauri stars (TTSs) are young ( Myr), roughly solar mass stars that have only recently emerged from their natal molecular clouds to become optically visible (see reviews by Bertout, 1989; Feigelson & Montmerle, 1999). The presence of disks around classical TTSs (CTTSs) is now well established observationally. Millimeter wave measurements of the dust continuum from the outer disk can be used to estimate the disk mass, assuming a dust to gas ratio (see review by Zuckerman 2001). Such estimates typically yield masses of M⊙, consistent with the minimum mass for the solar nebula (e.g., Beckwith et al., 1990). Spectral line observations can be used to study the inner regions of the disk through their kinematic signatures. This has been done successfully for very young embedded sources using the infrared (IR) bands of CO (Carr, Mathieu, & Najita, 2001; Thi et al., 2001; Najita et al., 1996; Chandler, Carlstrom, & Scoville, 1995), but the results are confusing for the CTTSs that show CO band emission (Thi et al., 2001; Chandler et al., 1995).
Molecular hydrogen is expected to be times more abundant than other gas tracers such as CO in the disks surrounding young stars. Depending on the density, H2 can survive at temperatures of up to 4000 K (e.g., Williams et al., 2000), and can self-shield well against UV radiation fields, making it an excellent diagnostic of disks around young stars. Good probes of gas in circumstellar disks are needed to determine the lifetime of gas in these environments where planets likely form. Most studies of disks to date have relied on the IR to millimeter wavelength spectral energy distribution (SED) of these young stars. These studies are mainly sensitive to micron-sized dust and have shown that the typical survival time for this dust is only a few million years (Strom, Edwards, & Skrutskie, 1993; Wolk & Walter, 1996; Hillenbrand & Meyer, 1999; Alves, Lada, & Lada, 2000). This does not mean, however, that the disks around these stars disappear on this short timescale. Theories of giant planet formation suggest that after the dust collects into larger particles (and no longer shows up in studies of the SED), the gas is still present in the disk for some time before it accretes onto the planets (e.g., Wuchterl, Guillot, & Lissauer, 2000). Indeed, if for most CTTSs the gas disappears from the disk on the same timescale as the dust does, it may be quite difficult to form giant gas planets.
Molecular hydrogen around a CTTS was first detected by 2.12183 m 1-0 S(1) line emission in the spectrum of T Tau (Beckwith et al., 1978). Brown et al. (1981) discovered ultraviolet emission lines of H2 in an IUE spectrum of T Tau and identified them as fluorescent lines pumped by Ly, which were previously seen in sunspot spectra. In both cases, it was apparent that the molecular hydrogen emission from T Tau is spatially extended. Subsequently, H2 has been studied often around CTTSs in both the IR and UV. Carr (1990) surveyed young stellar objects in the IR, finding H2 emission in 4 CTTSs. The location of this H2 emission is very important. Recent ground-based images of T Tau show that the IR emission is quite extended, reaching to 20″ from the star van Langevelde et al., 1994; see also Herbst et al., 1996, 1997. The extended IR H2 emission seen around T Tau and other young embedded sources like L1448 (Bally, Lada, & Lane, 1993) is interpreted as shock heated emission from the interaction of the stellar/disk wind/jet with the surrounding cloud material (see review by Reipurth & Bally, 2001). Thi et al. (2001) used ISO to detect H2 emission in the IR from 22 CTTSs, Herbig Ae/Be stars, and debris-disk stars, but with a large aperture extending over 20″ this emission may include both disk emission and spatially extended H2 emission from outflows. They assumed based on the strength of on-source versus off-source CO emission that the bulk of the emission occurred in the circumstellar disks. However, Richter et al. (2001) attemped to detect on-source H2 emission from five of these sources using a small slit, but failed to detect any significant H2 emission.
Magnetic quadrupole transitions of H2 in the IR are very weak, and electric dipole transitions within the ground electronic state are forbidden because H2 has no net dipole moment. In the UV, the large oscillator strengths of the electronic Lyman-band (B-X) transitions lead to strong emission and absorption lines via transitions to and from the excited electronic state. Valenti, Johns-Krull, & Linsky (2000) observed H2 emission in the UV around 13 of 32 TTSs studied with IUE. Valenti et al. (2000) go on to argue that the limited sensitivity of IUE may be the only reason that H2 was not detected in the remaining 19 TTS. Johns-Krull, Valenti, & Linsky (2000) attributed UV pumping to the excitation of H2, because the observed flux in H2 lines scales with the total UV flux. The UV H2 lines of T Tau are spatially extended beyond the disks thought to be in this system and may have substantial contributions from outflows. However, as described below, we do not think that the H2 lines from TW Hya arise in a molecular outflow.
More recently, Ardila et al. (2001) detected fluorescent H2 around a sample of CTTSs with HST/GHRS and attributed the pumping to the red wing of Ly. Roberge et al. (2001) and Herczeg et al. (2001) presented observations of circumstellar H2 absorption against the O VI profiles of the Herbig Ae/Be stars AB Aur and DX Cha, as observed with the Far Ultraviolet Spectrograph Explorer (FUSE). Herczeg et al. (2001) identified H2 emission in FUSE observations of TW Hya and V4046 Sgr in two Lyman-band H2 lines, but did not detect significant H2 absorption against O VI for these two stars.
TW Hya is the most prominent member of the recently named TW Hydrae association (TWA – Webb et al., 1999) located at a distance of pc (Wichmann et al., 1998), making it the closest known CTTS to the solar system. Webb et al. (1999) estimated that TW Hya is a star with an age of 10 Myr based on evolutionary tracks of D’Antona & Mazzitelli (1997). Most other members of the TWA are naked T Tauri stars (NTTSs - TTSs which lack close circumstellar disks), which confirms that TW Hya is quite old for a CTTS. TW Hya shows strong H emission (Rucinski & Krautter, 1983; Webb et al., 1999) produced in the accretion column, and an IR excess (Jayawardhana et al., 1999) produced by dust emission from a disk. The mass accretion rate has been measured to be from yr-1 (Muzerolle et al., 2000; Alencar & Batalha, 2001). By measuring the width of magnetically sensitive lines, Johns-Krull & Valenti (2001b) estimated that the mean magnetic field of TW Hya is of order 3 kG. Recent imaging of TW Hya shows that its disk is viewed very nearly face-on (Weinberger et al., 1999; Krist et al., 2000). D. Potter determined the inclination angle using IR polarimetry, while Alencar & Batalha (2001) estimated an inclination of by analyzing time-series profiles of H. The outer radius of the disk extends more than 225 AU (Krist et al., 2000; Trilling et al., 2001; Weinberger et al., 2001) from the star, and its inner truncation radius is about 0.3 AU (Trilling et al., 2001). D’Alessio (2001) found evidence from comparing the observed spectral energy distribution (SED) of TW Hya to models of SEDs that grains in the inner AU of the disk may have grown in size and settled towards the midplane, while dust and gas in the outer disk is well-mixed. The disk mass is roughly (Wilner et al., 2000; Thi et al., 2001; Trilling et al., 2001). Based on submillimeter CO emission and estimates for the disk mass, Thi et al. (2001) and van Zadelhoff et al. (2001) determined that CO is underabundant by a factor of around TW Hya, with respect to a typical ISM H2/CO ratio of . There is no molecular cloud associated with TW Hya (Webb et al., 1999), and therefore no opportunity to observe whether or not there is an outflow from H2 or CO observations. Weintraub, Kastner, & Bary (2000) reported the detection of H2 emission in the 1-0 S(1) line at 2.12183 m from TW Hya, attributing this line to formation in the circumstellar disk, in which the H2 is excited by non-thermal electrons produced by X-ray ionization. TW Hya is a strong X-ray source, with as measured with Chandra by Kastner et al. (2001). These Chandra observations indicated an overabundance of Ne, an underabundance of O and Fe, and solar-like abundances of Si, Mg and N in the X-ray emission region. From the sharply peaked emission measure distribution and high electron density, Kastner et al. (2001) concluded that the X-ray emission is produced in an accretion shock. Alternatively, Gagne et al. (2002) argued that the Chandra X-ray emission may be consistent with an origin either in the accretion shock or in a corona.
Here, we use HST/STIS and FUSE spectra of TW Hya to study its circumstellar environment, focusing on the substantial number of H2 emission lines seen in the UV. In §2 we explain the observations and data reduction. In §3 we identify the emission lines and examine their profiles. In §4 we show that the Si lines are anonomously weak, and propose a depletion of Si in the accretion column as one possible explanation. In §5, we discuss the H2 fluorescence, and in §6 we argue that this emission most likely originates in the circumstellar disk of TW Hya. In paper II, we model the H2 line fluxes to assess the physical conditions that give rise to the H2 fluorescence.
2 OBSERVATIONS AND DATA REDUCTION
We used the Space Telescope Imaging Spectrograph (STIS) on Hubble Space Telescope (HST) to observe the pre-main sequence star TW Hya on 2000 May 7. We used the medium resolution E140M grating and the 05 05 aperture for a 2300 s integration (see Table 1). In this paper we only briefly discuss a contemporaneous E230M spectrum of TW Hya.
We reduced the data using the CALSTIS software package (Lindler, 1999) written in the Interactive Data Language (IDL), which yields equivalent results to the HST archive pipeline. Wavelengths were assigned by the reduction software using calibration lamp spectra obtained during the observations. A canonical wavelength solution is determined from a 2-D fit of emission lines in a deep lamp exposure. Then a 2-D cross-correlation of the deep exposure with a short lamp exposure obtained during the TW Hya observations provides the offset that must be applied to the canonical wavelength solution. Absolute wavelengths are accurate to km s-1, and relative wavelengths are accurate to km s-1 (Leitherer et al., 2001). Scattered light was removed from the data using the ECHELLE_SCAT routine available in the CALSTIS package, which is identical to the sc2d algorithm used in the standard HST pipeline.
We used the FUSE satellite to observe TW Hya on 2000 June 6 with the LWRS () aperture for a 2081 s integration (Herczeg et al., 2001). We reduced the data using v1.8 of the CALFUSE pipeline (Kruk, Murphy, & Young, 2001). FUSE consists of 4 gratings with two channels each. The spectrum was re-binned to one wavelength bin per resolution element to increase signal-to-noise. In this paper we use spectra from the SiC1A, LiF1A, LiF2B, and LiF2A channels, covering the spectral regions 915–1006 Å, 990–1080 Å, 1095–1185, and 1090–1180 Å, respectively. We calibrate the wavelengths of the LiF1A and LiF2A segments using H2 lines, and of the SiC2A segment using C III ISM absorption, to obtain an accuracy of Å.
3 EMISSION LINES
3.1 Line Identification
We detect in the STIS E140M observation of TW Hya over 200 emission lines in the 1140-1710 Å spectral region, shown in Figures 1–2. We use a database of over 19,000 H2 Lyman-band lines (Abgrall et al., 1993) and the Kurucz & Bell (1995) atomic line database to identify lines based upon both coincidence with calculated (for H2) or lab rest wavelengths (for atoms) and consistency of fluxes with predicted branching ratios from the upper state for H2 lines.
We identify 143 H2 lines, including five blends, from 19 excited levels, listed in Table 2 by upper level. Following conventional spectroscopic notation, these lines are identified as R or P depending on the change in rotational quantum number of or , respectively, where refers to the rotational quantum number of H2 in the upper excitation state and refers to the rotational quantum number in the lower excitation state. For example, the line 0-4 P(1) at 1335.921 Å is the transition between , in the ground electronic state and , in the excited electronic state. We use the term progression to indicate the set of R and P transitions from a single excited level to the various available levels in the ground electronic state, as demonstrated in Figure 3. We describe our identification of lines by analyzing in detail the lines from the level in the excited electronic state. Table 3 shows the possible radiative transitions from this state. We detect five of the six transitions with the largest radiative de-excitation rates, , and calculate that the flux ratios are consistent with the branching ratios. The only undetected line among the strongest six transitions is 0-5 P(18) at 1548.146 Å. The flux at this wavelength is dominated by the blue side of the C IV 1548 Å line, making the detection of the H2 line difficult. In addition to these 143 H2 lines from our STIS observations, Figure 4 shows the detection of the Lyman-band H2 transitions 1-1 P(5) at 1161.864 Å and 1-1 R(3) at 1148.751 Å in the FUSE spectra of TW Hya (Herczeg et al., 2001).
In Table 4 we list 15 tentatively identified H2 Lyman-band lines from 10 different excited levels. Based on branching ratios, these lines should be among the strongest lines from a given excited level, and a transition to that excited level coincides with a strong emission feature. For these tentative identifications, emission in the other transitions from the same upper level is either masked by strong emission features, occurs shortward of the spectral region we observed, is obscured by a wind absorption feature in an atomic line, or is too weak to be clearly identified as emission. For example, we identify a narrow feature at 1593.826 Å tentatively as emission in the H2 transition 3-10 R(5), the second strongest transition from , with a calculated rest wavelength of 1593.751 Å. The strongest transition from this excited state, 3-10 P(7) at 1611.315 Å, appears to be weakly present. The third and fourth strongest lines, 3-1 R(5) and 3-1 P(7), have wavelengths shortward of the STIS bandpass. This observation is too short to detect the weaker lines. The excited level for this transition may be pumped by C III via the 3-2 R(5) transition at 1175.248 Å. We do not use these tentatively identified H2 lines in further analysis.
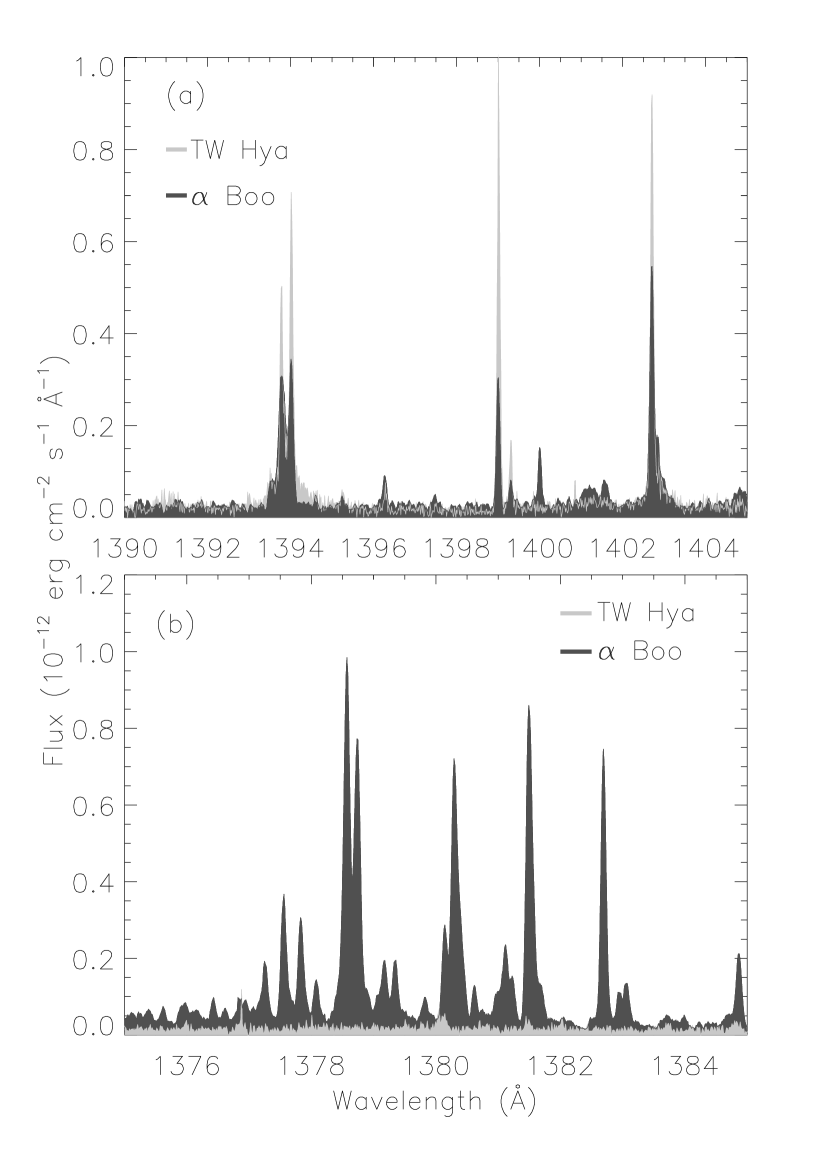
A similar test of over 75,000 CO lines from the Kurucz database failed to identify any groups of CO lines in the spectrum of TW Hya; we therefore consider the coincidence of individual CO transitions with observed emission lines as random chance. The usual electronic pumping routes through the O I multiplet at 1305 Å, as seen in giant stars such as Boo (Ayres, 1986; Ayres et al., 1997b) do not appear to occur in TW Hya (see Figure 5). A number of weak, narrow emission lines from 1354–1357 Å may be CO A-X emission, pumped by H2 emission at 1393.9 Å via transitions within the thermal width of the H2 line.
3.2 Spatial Extent of Emission
Observing with a aperture, for TW Hya’s distance of 56 pc, we detect H2 emission that occurs spatially within 14 AU of the star. The STIS E140M mode can provide some information on the spatial extent of the H2 emission across the aperture. We analyze separately the spatial distribution of H2 lines with wavelengths Å, Å, and Å, because the width of the instrumental spatial profile increases towards lower wavelengths (Leitherer et al., 2001). In this analysis, we do not use H2 lines contaminated by N V, C II, Si IV, or C IV emission. We co-add the spatial extent of many H2 lines and compare their spatial distribution to other lines with similar wavelengths. The Ly 1215.67 Å line, the C IV 1549 Å doublet, and the He II 1640 Å line are probably produced in the accretion shock near the stellar surface (e.g., Calvet et al., 1996) and therefore should be spaitially unresolved and represent a good estimate of the spatial profile in the cross-dispersion direction. Cooler lines, such as the O I 1304 Å triplet and the C I multiplets at 1561 Å and 1657 Å, may be produced in the accretion shock or may also be somewhat extended. The geocoronal Ly line uniformly fills the aperture.
We use the order locations on the detector to identify the location of each H2 line and then extract a subimage, a pixel region around the brightest pixel at this location. We co-add these subimages, and then create normalized spatial profiles for H2 from 3 pixel (011) wide swaths and for atomic lines from 7 pixel (026) wide swaths centered on the brightest pixel. Although the brightest pixel is offset in different wavelength bins by up to half a pixel, this only slightly affects the central region of the spatial profile and does not affect the wings of the profile. Figure 6 shows that the H2 profile has more power in the wings of the spatial profile than the high-temperature lines and O I, although the wings are comparable to the extent of C I emission. Geocoronal Ly emission, which uniformly fills the aperture, is clearly more extended than the H2 emission.
In Figure 6c we compare the spatial extent of C IV emission and H2 emission lines above 1500 Å. We split these H2 lines into 9 lines with flux above and 36 lines below erg cm-2 s-1. The stronger H2 lines do not show the broad wings that the weak emission lines show. Similarly, we compare C IV emission at the peak wavelength to C IV emission on the edge of its spectral profile. The spatial profile from the peak emission strongly resembles the spatial profile of the strong H2 lines, while the spatial profile from the weak wings of the C IV profile strongly resembles the spatial profile of the weak H2 emission lines. This relationship, with weak H2 lines having broader wings than strong H2 lines, holds for all wavelengths. This weak emission in the wings may be due to a weak extended background UV source or detector background. We conclude that the H2 emission is not extended in the cross-dispersion direction beyond the resolution of the telescope, comparable to 2.8 AU, or a 1.4 AU radius from the central star.
3.3 Line Profiles
We fitted most of the emission lines with either a single or, for blended lines, multiple Gaussians. Several lines were not fitted because their profiles are non-Gaussian, as shown by many examples in Figure 7. The profiles of Ly 1215.67 Å, the C IV 1549 Å doublet, the N V 1240 Å doublet, the He II 1640.5 Å line, the C III 977 Å line, and the C II 1335.7 Å line show strong redshifted emission with a sharp blue edge. ISM absorption appears in the O I 1302 Å, C II 1334.5 Å line, Si II 1526.7 Å, and in the Mg II 2800 Å doublet, centered at the rest wavelength of these transitions in the heliocentric frame. The low-temperature O I 1305 Å triplet, C II 1335 Å doublet, N I 1492.6 Å, and Si II lines at 1526.7 Å and 1533.4 Å, along with the Mg II 2800 Å doublet in the NUV, have P-Cygni profiles that indicate winds of km s-1. Physical properties that can be inferred from these lines will be determined in a subsequent paper.
We do not observe H2 absorption within the Ly profile, even though the H2 must absorb the Ly photons to cause the fluorescence (see §5). In HST/STIS observations of Mira B, Wood, Karovska & Raymond (2002) detect H2 absorption against Ly as well as the corresponding fluorescence. Our FUSE observations do not show significant H2 absorption against the O VI profiles. These unseen H2 lines, with , have been observed in other PMS stars (Roberge et al., 2001; Herczeg et al., 2001). Because there is no H2 absorption in our line of sight, if the H2 is in a circumstellar shell or outflow around TW Hya, then the shell or outflow must be clumpy enough such that the H2 is not in our line of sight to the star. In Paper II we will quantify this conclusion.
The observed Ly profile is characterized by a strong red wing, possibly produced in the accretion shock, and a dark, wide absorption feature that extends to -700 km s-1. The large width of the Ly line may be caused by pressure broadening, which Muzerolle, Calvet, & Hartmann (2001) argue produces the broad wings of H based on modelling its line profile. The absorption feature is probably caused by a combination of wind, circumstellar, and interstellar absorption. In Paper II we will analyze the Ly profile in greater detail, including on a comparison between the observed Ly profile and a synthetic Ly profile reconstructed from H2 emission line fluxes.
To correct for instrumental line broadening, we now calculate the spectral line-spread function of the detector. We determined in §3.2 that emission in both atomic and molecular lines is not spatially extended in the cross-dispersion direction. If the emission is also not extended in the dispersion direction, then from the spatial distribution of emission we can determine the spectral line-spread function. We fit multiple Gaussians to the spatial distribution of H2 in three regions: , , and . We then multiply the FWHM of these Gaussians by 0.82, which is the ratio of the plate scale of the detector in the cross-dispersion direction to the plate scale in the dispersion direction due to anamorphic magnification. We then fit emission lines with Gaussians, correcting for the spectral line-spread function, to obtain intrinsic line widths. Parameters of these fits to atomic and unidentified lines are listed in Table 5. We only list the flux from our Gaussian fits to H2 lines because there are so many and they are all similar. We measured the flux of the two FUSE H2 in the LiF1B and LiF2A channels separately and co-added the flux of each line, weighted by the error in the flux.
The aperture is not a supported operating mode for STIS. The line-spread function we calculate from the spatial profile of the H2 emission is similar to the line-spread function determined by Leitherer et al. (2001) for the aperture, and as expected, they are slightly broader for the aperture. We show in Figure 8 that the mean observed FWHM of H2 lines is 222Errors are errors throughout paper km s-1, before removing instrumental broadening. Two lines, 1-8 P(11) at 1603.164 Å and 1-4 R(3) at 1314.690 Å, have anomalous widths of more than 30 km s-1 and are not used in future analysis. After removing instrumental broadening with our calculated spectral line-spread function, the average FWHM of the 30 H2 lines with fluxes above erg cm-2 s-1 is km s-1, which corresponds to a temperature of 6200 K if the broadening were entirely thermal. Although we believe our calculated spectral line-spread function is more accurate for our data than the line-spread function given in Leitherer et al. (2001) for the aperture, we calculate a FWHM of km s-1 when we correct for instrumental broadening using the line-spread function for the aperture. In Paper II we will determine the temperature of the H2 emission region and calculate the non-thermal broadening of the H2 emission.
Figure 9 shows that the mean velocity shift of 137 H2 lines is km s-1, with respect to rest wavelengths calculated by Abgrall et al. (1993). We used a conservative error estimate of 0.75 km s-1 for the assumed random uncertainty in the rest wavelengths, which is slightly larger than the difference between observed and calculated wavelengths, as given by Abgrall et al. (1993). The velocity shift of H2 lines, given the approximate km s-1 uncertainty in wavelength zero-point calibration for STIS E140M spectra (Leitherer et al., 2001), is consistent with previous photospheric radial velocity measurements: km s-1 (Weintraub et al., 2000), km s-1 (Kastner et al., 1999), km s-1 (de la Reza et al., 1989), and km s-1 (Torres et al., 2001). The velocity shift for 30 lines shortward of 1350 Å is km s-1, compared with km s-1 for 67 lines between 1350 Å and 1550 Å, and km s-1 for 29 lines above 1550 Å, confirming the excellent relative wavelength scale of STIS.
4 HOT ACCRETION LINES
Emission in lines of C IV, Si IV, N V, and O VI, from gas at K, is probably produced in an accretion flow near the surface of the star (Calvet et al., 1996; Lamzin, 1998), as indicated by their broad red wings, which may be produced by rapidly inflowing hot gas. This emission may also be produced in a stellar transition region, although these red wings are broader than emission from most active stars with a coronal emission source (e.g., Ayres et al., 2001). The ratio of flux in the C IV doublet near 1550 Å to the flux in the Si IV doublet at 1400 Å is 30. In a study of eight CTTSs with HST/GHRS, Ardila et al. (2001) found that this ratio varies from 0.5 to 3 in stars that show Si IV emission, but Si IV emission was conspicuously absent from a number of these stars. In spectra of main-sequence and giant stars, the flux ratio of these two doublets is typically about two (e.g., Ayres et al., 1997a). In giant stars such as Boo, the Si IV doublet may be absorbed by Si I bound-free absorption below 1525 Å (Ayres et al., 1997b). When this absorption occurs, we expect C I continuum absorption to quench any N V emission, as is observed for Boo (Ayres, private communication), but we detect strong N V emission at 1238 Å and 1243 Å. Temperature effects probably do not explain the weakness of the Si IV features because it is formed at 80,000 K, close to the 100,000 K formation temperature of C IV. Strong emission in the red wing of the C III line at 977.0 Å indicates the presence of cooler material in the accretion flow, while a strong red wing in C IV, N V, and O VI emission indicates hotter material in the flow.
We do not detect Si III features at 1206 Å and 1296 Å, which are strong in main-sequence and active stars, and the Si II features at 1309.3 Å, 1526.7 Å, and 1533.3 Å are weak. In addition, Valenti et al. (2000) find in IUE spectra of TW Hya that the Si III] 1892 Å line is also fairly weak, although a reasonable amount of flux is present in the Si II] 1808 Å and Si II] 1817 Å lines. All of this leads us to speculate that Si may be underabundant in the accretion flow. In the gas phase of the ISM, Si is underabundant by a factor of 100 relative to solar because Si readily depletes onto grains (Fitzpatrick, 1996). Chiang et al. (2001) and D’Alessio et al. (1999) provide evidence that grains in a circumstellar disk settle near the midplane. Gammie (1996) showed that ionized material at the surface of the disk couples to the magnetic field, and thereby preferentially accretes onto the star. Silicon may therefore be underabundant in the accretion flow because it is predominantly located in grains at the circumstellar midplane that do not participate in the accretion. If most of the Si is bound in grains, then we might expect strong SiO emission from stellar disks when the accretion shock has underabundant Si IV emission, since the formation of SiO is one step towards the incorporation of Si into dust. Weinberger et al. (2001) and Sitko, Russell, & Lynch (2000) find a broad hump in the IR region 8-13 m, which they attribute to a combination of silicates, and Weinberger et al. (2001) conclude that the disk of TW Hya contains several hundred Earth masses of condensed silicates and ices. If depletion onto grains in a TTS environment resembles similar processes in the ISM, then other refractory elements such as Fe should also be underabundant. Unfortunately, analysis of the strength of NUV Fe II lines is complicated, partly because most of them are photoexcited by Ly (Carpenter, Robinson, & Judge, 1994; McMurry & Jordan, 2000), and there are no other Fe lines available for us to study. Kastner et al. (2001) found solar-like abundances of Si and Mg, an underabundance of Fe and O, and an overabundance of Ne in the Chandra spectrum of TW Hya. They attributed the X-ray emission to the accretion shock, which disagrees with previous models in which X-rays from TTSs are produced in a coronae (e.g., Feigelson & Montmerle, 1999). If this is the case, then our speculation that Si is underabundant in the accreting gas would be incorrect. We also note that we do not detect Cl I emission at 1351.7 Å, which is strong in most stars due to pumping by C II. We will pursue these abundance issues further in a future paper.
5 H2 FLUORESCENCE
We identify 19 progressions of H2 lines, each with a distinct upper vibrational level and rotational level . In Table 6, we list these progressions, including the number of detected lines and flux () in each progression. Ten other progressions listed in Table 3 include the 15 tentatively identified H2 lines. Figure 10 shows that most levels in the excited electronic state are photoexcited by transitions coincident with Ly. Figure 11 shows that the lower levels of these transitions are the lowest energy levels with transitions coincident with Ly, indicating that the level populations may be thermal. The C IV doublet, C II doublet, and C III multiplet also pump some of these levels.
The observed Ly profile includes a broad absorption feature with FWHM about km s-1, produced by neutral H in the ISM, circumstellar material, and a wind from TW Hya or its disk. We detect no flux due to either Ly or H2 emission in this dark absorption line. This absorption feature coincides with several H2 transitions that pump the excited state, so most of the Ly absorption must occur after the Ly emission encounters the H2.
We demonstrate the identification of a pumping mechanism for a given excited level by returning to the case of . Because most of the H2 is in the ground electronic state, and the low transition probabilities preclude any collisional redistribution of H2 within the excited electronic state, one of the transitions shown in Table 3 must pump the level. Of these transitions, only the 0-5 P(18) 1548.213 Å line overlaps with a strong emission line observed in the TW Hya spectrum. The weak H2 feature at 1381 Å is unable to pump a significant amount of H2 into the level. The continuum at the wavelengths of these transitions is also unable to pump an appreciable amount of H2 into this level. The 0-2 R(16) transition, which would be observed at 1335.357 Å, falls in between the C II 1335 Å doublet. We do not expect significant blue emission from the 1335.7 Å line in this doublet. The C II 1334.5 Å line probably has a strong red wing similar to the C II 1335.7 Å line, but this wing is absorbed by a wind in C II 1335.7 Å. We estimate that the strength of the C II 1334.5 Å line at +180 km s-1 is erg cm-2 s-1, which is the strength of the C II 1335.7 Å line at the same position. This flux is a factor of 10 weaker than the C IV flux available to pump this upper level. The lower levels for 0-2 R(16) and 0-5 P(18) have energies 2.8 eV and 3.8 eV, respectively, that are too high to have a significant population at sensible temperatures. The level is particularly difficult to populate. We conclude that either the 0-5 P(18) transition at 1548.213 Å or the 0-2 R(16) transition at 1335.357 Å pumps this upper level. The pumping mechanism for almost all other levels is well determined.
The pumping transitions listed in Table 6 require significant populations in the lower rovibrational levels. Changes in these level populations may alter which pumping mechanism is most important for certain excited levels. At low temperatures, the ground vibrational level will be much more populated than excited vibrational levels. As a result, and would be pumped by the continuum via 0-0 P(1) at 1110.062 Å and 0-0 P(2) at 1110.119 Å, respectively. However, because we do not observe other progressions that would be pumped by the continuum, we conclude that the gas temperature is sufficiently high that Ly pumps these excited levels. The level is pumped by both C III 1174 Å via the 3-2 P(4) transition at 1174.923 Å and by Ly via the 3-3 P(2) transition at 1217.031 Å. Pumping of the and the tentative route cannot possibly occur if the H2 populations are thermal because the energy of the lower level for the routes which populate these levels are very high; we claim that the C IV emission pumps these former via 0-3 P(25) at 1547.971 Å, and that C IV and C II emission pumps the latter, as described above. The lower level for the first transition has an energy of 4.2 eV, compared with the 4.5 eV dissociation energy of the H2 molecule.
One H2 transition, 0-4 R(1) at 1333.851 Å, with a flux of erg cm-2 s-1, is about six times weaker than would be expected by branching ratios. Its counterpart, 0-4 P(3) at 1342.314 Å, has a similar branching ratio and lower energy level, and a flux of erg cm-2. In Paper II, we will show quantitatively that this particular line is anomalously weak, and that it is the only line that is signifcantly weaker than predicted by our modelling. We conclude that this H2 line, which is centered at 130 km s-1 to the blue side of the C II 1334.5 Å line, is absorbed by a wind component of this C II line. This result places the wind in our line of sight to the H2 emission region, and constrains the plausible geometries of TW Hya’s circumstellar environment.
We now analyze the velocity shifts and line FWHMs pumped from levels with eV and eV separately. As discussed in §3.3, the velocity shift of H2 lines increases slightly with increasing wavelength, probably because of the relative wavelength accuracy of STIS. We correct for these changes by fitting a line to the velocity shift and wavelength of each transition. We find that the velocity shift of 37 lines pumped from high energy levels is an average of km s-1 above the estimated velocity, while the velocity shift of the 65 lines pumped from low-excitation levels is km s-1 from the estimated velocity shift. The accuracy of the wavelengths calculated by Abgrall et al. (1993) compared with laboratory wavelengths indicates that there is most likely not a wavelength bias for high-energy lines. Thus, the difference in the mean velocity shift between the two groups of H2 lines is likely real.
6 ORIGIN OF H2 EMISSION
We now consider a circumstellar shell, an outflow, the stellar photosphere, and a disk as possible places of origin for the H2 emission. We have a number of pieces of evidence to discriminate between models. The H2 emission is not shifted by more than 3 km s-1 relative to the photospheric radial velocity. The spatial extent of the emission indicates that most of it occurs within from the star. The Ly profile shows no H2 absorption, which gives an upper limit to the amount of H2 in our line of sight. Finally, the C II wind feature absorbs H2 emission, which indicates that C II lies in our line of sight to the warm H2.
Warm molecular emission has in the past been interpreted as shock-heated emission due to an outflow interacting with the surrounding ambient molecular material. However, the TWA is isolated from any molecular cloud, so this type of emission is difficult to accept. Molecular emission is absorbed by a wind component in the C II line at 1334.5 Å, which would not occur in most shell models. The H2 progressions pumped near line-center of Ly probably would not occur because of H I absorption in the wind. Assuming the outflow interacts with surrounding material at a large distance from the star, the H2 emission should be more extended. Consequently, we rule out emission from a surrounding molecular cloud.
Molecular gas could become entrained in an outflow, or perhaps form part of the outflow, which could produce emission from hot H2 gas. In this scenario, the star would have to be extremely close to face-on so that we do not observe either spatial extent in the H2 emission or H2 absorption against the Ly emission. However, we rule out velocity shifts greater than 3 km s-1 for the H2 emission, which is inconsistent with expected outflow velocities.
Johns-Krull & Valenti (2001a) determined that CO absorption near 1.6 m occurs in the photosphere of most TTSs. The data analyzed here are roughly consistent with an origin of the H2 emission in the photosphere. If the H2 is produced in the photosphere, then it should be detected in the IR around Naked TTSs (NTTS) as well as CTTSs, but this emission has not yet been detected. In a study of H2 fluorescence with HST/GHRS, Ardila et al. (2001) detected H2 emission from eight CTTSs but did not detect H2 emission from the one NTTS in their sample. This result is consistent with a disk origin of H2 emission, if the gas disappears from the disk on the same timescales that dust disappears. However, because this H2 emission is reprocessed Ly emission, NTTSs may not show H2 emission because their atomic emission lines are typically weak. Even with weak profiles, Ly may still be strong near the center of the line profile. In Figure 10, two progressions are pumped near the rest wavelength of Ly, and fluoresence in these progressions could in principle be seen from NTTSs. This comparison requires further observations with greater sensitivity than HST/GHRS offered in order to interpret the results.
We conclude that the most likely site of H2 emission is in the disk. A disk origin satisfies all of our requirements listed above. The fluorescence could only occur in the surface layer of the disk, because grains would absorb any UV radiation below a certain depth. In Paper II, we will calculate the physical properties of the H2 emission region. The H2 fluorescence typically occurs in warm regions ( K), which may pose certain problems in comparing this conclusion with disk models (e.g., D’Alessio et al., 2001; Chiang et al., 2001; Glassgold & Najita, 2001). From the temperature of the disk, we will calculate the thermal broadening of the H2 emission and subsequently spatially constrain the H2 emission using its orbital velocity.
If this H2 fluorescence occurs in a disk, then the line profiles from stars with higher inclinations should be wider. In HST/STIS spectra of the DF Tau, with an edge-on disk, Linsky (1999) found that FWHM of the H2 emission lines were typically about 25 km s-1, while we calculate a FWHM of 18 km s-1for the face-on system TW Hya. Johns-Krull & Valenti (2001a) determined from CO absorption that the of DF Tau is km s-1, compared with km s-1for TW Hya. The additional broadening observed in the H2 lines of DF Tau may result either from a faster orbital velocity if the H2 is in the disk, or a faster stellar rotation if the H2 is in the photosphere.
7 SUMMARY
Our analysis of the ultraviolet spectra of TW Hya obtained with the STIS instrument on HST and with FUSE lead to the following conclusions:
1. The 1250–1650 Å spectrum is dominated by molecular hydrogen fluorescence in 143 Lyman band lines. The observed flux in these lines is erg cm-2 s-1, corresponding to at the stellar distance of 56 pc. The H2 spectrum is pumped to the excited electronic state mainly by transitions coincident with the broad Ly emission line. Other lines, such as the C II 1335 Å doublet, C III 1175 Å multiplet, and the C IV 1550 Å doublet may also pump some H2 to the excited electronic state.
2. The H2 emission is not spatially extended from the star, given a resolution of , corresponding to 2.8 AU at 56 pc. With a face-on disk, the H2 emission is produced within 1.5 AU of the central star.
3. The wavelengths of the H2 emission is not shifted by more than 3 km s-1 with respect to the photospheric velocity of the star.
4. The stellar wind occurs in our line of sight to the H2 emission region, based upon the anomolously weak flux in an H2 line that has a wavelength coincident with a wind feature of C II 1334.5 Å.
5. No significant H2 absorption is detected against the Ly profile or the O VI emission lines.
6. The H2 emission likely originates in the surface layer of a disk, rather than a circumstellar shell or an outflow. We cannot rule out the possibility that the H2 emission is produced in the stellar photosphere.
7. Silicon II, III, and IV lines are anomolously weak in the UV, possibly because Si depletes onto grains that accumulate in the disk midplane and decouples from the surface material of the disk that preferentially accretes. Thus the accretion column responsible for the high temperature emission lines would then be very silicon-poor. Models of the accretion shock are needed to further probe this possibility.
8 ACKNOWLEDGEMENTS
This research is supported by NASA grant S-56500-D to the University of Colorado and NIST, and by a grant to the University of Colorado through the Johns Hopkins University. We thank Tom Ayres, Phil Maloney, David Hollenbach and Bruce Draine for valuable discussions.
References
- Abgrall et al. (1993) Abgrall H., Roueff, E., Launay, F., Roncin, J. Y., & Subtil, J. L. 1993, A&AS, 101, 273
- Alencar & Batalha (2001) Alencar, S.H.P. & Batalha, C. 2001, ApJ, submitted.
- Alves et al. (2000) Alves, J., Lada, C., & Lada, E. 2000, Ap&SS, 272, 213
- Ardila et al. (2001) Ardila, D. R., Basri, G., Walter, F. M., Valenti, J. A., Johns-Krull, C. M. 2001, ApJ, to appear in ApJ
- Ayres (1986) Ayres, T. R. 1986, ApJ, 308, 246
- Ayres et al. (1997a) Ayres, T. R., Brown, A., Harper, G. M., Bennett, P. D., Linsky, J. L., Carpenter, K. G., & Robinson, R. D. 1997, ApJ, 491, 876
- Ayres et al. (1997b) Ayres, T. R., Brown, A., Harper, G. M., Bennett, P. D., Linsky, J. L., Carpenter, K. G., & Robinson, R. D. 1997, in ASP Conf. Ser. 223, Cool Stars, Stellar Systems & the Sun 11, (San Fransisco: ASP), 1079
- Ayres et al. (2001) Ayres, T.R., Brown, A., Osten, R.A., Huenemoerder, D.P, Drake, J.J., Brickhouse, N.S., & Linsky, J.L. 2001, ApJ, 549, 554
- Bally et al. (1993) Bally, J., Lada, E. A., & Lane, A. D. 1993, ApJ, 418, 322
- Beckwith et al. (1978) Beckwith, S. V. W., Gatley, I., Matthews, K., & Neugebauer, G. 1978, ApJ, 223, L41
- Beckwith et al. (1990) Beckwith, S. V. W., Sargent, A. I., Chini, R., & Güsten, R. 1990, AJ, 99, 924
- Bertout (1989) Bertout, C. 1989, ARA&A, 27, 351
- Brown et al. (1981) Brown, A. Jordan, C., Millar, T. J., Gondhalekar, P., & Wilson, R. 1981, Nature, 290, 34
- Calvet et al. (1996) Calvet, N., Hartmann, L., Hewett, R., Valenti, J., Basri, G., & Walter, F. 1996, Cool Stars, Stellar Systems & the Sun, R. Pallavicini & A. K. Dupree (eds.), ASP Conf. Series
- Carpenter et al. (1994) Carpenter, K., Robinson, R., & Judge, P. 1994, BAAS, 185, 4509
- Carr (1990) Carr, J. S. 1990, AJ, 100, 1244
- Carr et al. (2001) Carr, J. S. Mathieu, R.D., & Najita, J.R. 2001, ApJ, 551, 454
- Chandler et al. (1995) Chandler, C. J., Carlstrom, J. E., & Scoville, N. Z. 1995, ApJ, 446, 793
- Chiang et al. (2001) Chiang, E. I. Joung, M. K., Creech-Eakman, M. J. Qi, C., Kessler, J. E., Blake, G. A., & van Dishoeck, E. F. 2001, ApJ, 547, 1077
- D’Alessio et al. (1999) D’Alessio, P., Calvet, N., Hartmann, L., Lizano, S., & Canto, J. 1999, ApJ, 527, 893
- D’Alessio (2001) D’Alessio, P. 2001, in ASP Conf. Ser., vol. 244, Young Stars Near Earth: Progress and Prospects, ed. R. Jayawardhana & T. Greene (San Fransisco: ASP), 239
- D’Alessio et al. (2001) D’Alessio, P., Calvet, N., & Hartmann, L. 2001, ApJ, 553, 321
- D’Antona & Mazzitelli (1997) D’Antona, F. & Mazzitelli, I. 1997, Mem. Soc. Astron. Italiana, 68, 4
- de la Reza et al. (1989) de la Reza, R., Torres, C. A. O., Quast, G., Castilho, B. V., & Vieira, G. L. 1989, ApJ, 343, 61
- Feigelson & Montmerle (1999) Feigelson, E. D. & Montmerle, T. 1999, ARA&A, 37, 363
- Fitzpatrick (1996) Fitzpatrick, E. L. 1996, ApJ, 473, L55
- Gagne et al. (2002) Gagné, M., Cohen, D., Owocki, S. & Ud-Doula, A. 2002, to appear in ASP Conf. Ser., The High Energy Universe at Sharp Focus: Proceedings of the First Chandra Science Symposium, ed. S. Vrtilek, E.M. Schlegel & L. Kuhi (San Fransisco:ASP)
- Gammie (1996) Gammie, C. F. 1996, ApJ, 457, 355
- Glassgold & Najita (2001) Glassgold, A. & Najita, J. 2001, in ASP Conf. Ser., vol. 244, Young Stars Near Earth: Progress and Prospects, ed. R. Jayawardhana & T. Greene (San Fransisco: ASP), 251
- Herbst et al. (1996) Herbst, T. M., Beckwith, S. V. W., Glindemann, A., Tacconi-Garman, L. E., Kroker, H. & Krabbe, A. 1996, AJ, 111, 2403
- Herbst et al. (1997) Herbst, T. M., Robberto, M. & Beckwith, S. V. W. 1997, AJ, 114, 744
- Herczeg et al. (2001) Herczeg, G. J., Linsky, J. L., Brown, A., Harper, G. M., & Wilkinson, E. 2001, to appear in ASP Conf. Ser., Cool Stars, Stellar Systems & the Sun 12
- Hillenbrand & Meyer (1999) Hillenbrand, L. & Meyer, M. 1999, BAAS, 195.0209
- Jayawardhana et al. (1999) Jayawardhana, R., Hartmann, L., Fazio, G., Fisher, R. S., Telesco, C. M., & Piña, R. K. 1999, ApJ, 521, L129
- Johns-Krull et al. (2000) Johns-Krull, C. M., Valenti, J. A., & Linsky, J. L. 2000, ApJ, 539, 815
- Johns-Krull & Valenti (2001a) Johns-Krull, C. M. & Valenti, J. A. 2001a, ApJ, 561, 1060
- Johns-Krull & Valenti (2001b) Johns-Krull, C. M. & Valenti, J. A. 2001b, in ASP Conf. Ser., vol. 244, Young Stars Near Earth: Progress and Prospects, ed. R. Jayawardhana & T. Greene (San Fransisco:ASP), 147
- Kastner et al. (1999) Kastner, J. H., Huenemoerder, D. P., Schulz, N. S., & Weintraub, D. A. 1999, ApJ, 525, 837
- Kastner et al. (2001) Kastner, J. H. Huenemoerder, D. P., Schulz, N. S., Canizares, C.R., & Weintraub, D.A. 2001, to appear in ApJ
- Krist et al. (2000) Krist, J. E., Stapelfeldt, K. R., Ménard, F., Padgett, D. L., & Burrows, C. J. 2000, ApJ, 538, 793
- Kruk et al. (2001) Kruk, J., Murphy, E. & Young, P. 2001, The Calfuse Pipeline Reference Guide
- Kurucz & Bell (1995) Kurucz, R. L. & Bell, B. 1995, CD-ROM No. 23. (Cambridge: Smithsonian Astrophysical Observatory)
- Lamzin (1998) Lamzin, S.A. 1998, Astronomy Reports, 42, 322
- Leitherer et al. (2001) Leitherer, C., et al. 2001, STIS Instrument Handbook, Version 5.1 (Baltimore: STScI)
- Lindler (1999) Lindler, D. 1999, CALSTIS Reference Guide (Greenbelt: NASA/LASP)
- Linsky (1999) Linsky, J.L., Valenti, J., & Johns-Krull, C.M. 1999, AAS, 195, 214
- McMurry & Jordan (2000) McMurry, A. D., Jordan, C. 2000, MNRAS, 313, 423
- Muzerolle et al. (2000) Muzerolle, J., Calvet, N., Briceno, C., Hartmann, L., & Hillenbrand, L. 2000, ApJ, 535, L47
- Muzerolle et al. (2001) Muzerolle, J., Calvet, N., & Hartmann, L. 2001, ApJ, 550, 944
- Najita et al. (1996) Najita, J., Carr, J.S., Glassgold, A.E., Shu, F.H., & Tokunaga, A.T. 1996, ApJ, 462, 919
- Reipurth & Bally (2001) Reipurth, B. & Bally, J. 2001, ARA&A, 39, 403
- Richter et al. (2001) Richter, M.J., Jaffe, D.T., Blake, G.A., & Lacy, J.H. 2001, AAS, 199, 6005
- Roberge et al. (2001) Roberge, A., et al. 2001, ApJ, 551, 97
- Rucinski & Krautter (1983) Rucinski, S. M. & Krautter, J. 1983, A&A, 121, 217
- Sitko, Russell, & Lynch (2000) Sitko, M.L., Russell, R.W., & Lynch, D.K., 2000, AJ, 120, 2609
- Strom et al. (1993) Strom, S. E., Edwards, S., & Skrutskie, M. F. 1993, in Protostars and Planets III, ed. E. H. Levy & J. I. Lunine (Tucson: Univ. of Arizona Press), 837
- Thi et al. (2001) Thi, W. F., et al., 2001, ApJ, 561, 1074
- Torres et al. (2001) Torres, C. A. O., Quast, G. R., de la Reza, R., da Silva, L., & Melo, C. H. F. 2001, in ASP Conf. Ser., vol. 244, Young Stars Near Earth: Progress and Prospects, ed. R. Jayawardhana & T. Greene
- Trilling et al. (2001) Trilling, D. E., Koerner, D. W., Barnes, J. W., Ftaclas, C., & Brown, R. H. 2001, ApJ, 552, 151
- Valenti et al. (2000) Valenti, J. A., Johns-Krull, C. M., & Linsky, J. L. 2000, ApJS, 129, 399
- van Langevelde et al. (1994) van Langevelde, H. J., van Dishoeck, E. F., van der Werf, P. P., & Blake, G. A. 1994, A&A, 287, L25
- van Zadelhoff et al. (2001) van Zadelhoff, H. J., van Dishoeck, E. F., Thi, W.F., & Blake, G. A. 2001, A&A, 377, 566
- Webb et al. (1999) Webb, R. A., Zuckerman, B., Patience, J., White, R. J., Schwartz, M. J., McCarthy, C., & Platais, I. 1999, ApJ, 512, L63
- Weinberger et al. (1999) Weinberger, A. J., Schneider, G., Becklin, E. E., Smith, B. A., & Hines, D. C. 1999, BAAS, 194, 6904
- Weinberger et al. (2001) Weinberger, A.J., Becklin, E.E., Schneider, G., Chiang, E.I., Lowrance, P.J., Silverstone, M., Zuckerman, B., Hines, D.C. & Smith, B.A. to appear in ApJ
- Weintraub et al. (2000) Weintraub, D. A., Kastner, J. H. & Bary, J. S. 2000, ApJ, 541, 767
- Wichmann et al. (1998) Wichmann, R., Bastian, U., Krautter, J., Jankovics, I., & Rucinski, S. M. 1998, MNRAS, 301, L39
- Williams et al. (2000) Williams, D.A., et al. 2000, in Molecular Hydrogen in Space, ed. F. Combes & G. Pineau de Forets (Cambridge: Cambridge University Press), 99
- Wilner et al. (2000) Wilner, D. J., Ho, P. T. P, Kastner, J. H., & Rodriguez, L. F. 2000, ApJ, 534, 101
- Wolk & Walter (1996) Wolk, S. J. & Walter, F. M. 1996, AJ, 111, 2066
- Wood et al. (2002) Wood, B. E., Karovska, M. & Raymond, 2002. submitted to ApJ
- Wuchterl et al. (2000) Wuchterl, G., Guillot, T., & Lissauer, J. J. 2000, in Protostars and Planets IV, ed. V. Mannings, A. P. Boss, & S. S. Russell, (Tucson: Univ. of Arizona Press), 1081
- Zuckerman (2001) Zuckerman, B. 2001, ARA&A, 39, 549


| Date | Dataset | Grating | Time | Aperture | Resolution | ||
|---|---|---|---|---|---|---|---|
| 7 May 2000 | O59D01020 | E230M | 1675 s | 2157 Å | 2965Å | 30000 | |
| 8 May 2000 | O59D01030 | E140M | 2300 s | 1140 Å | 1735Å | 45800 | |
| 3 June 2000 | P1860101000 | FUSE | 2031 s | 900 Å | 1188Å | 15000 |
| Table 2: H2 Progressions1 | ||||||||||
|---|---|---|---|---|---|---|---|---|---|---|
| Pumped by 0-2 P(1) 1219.368 Å | Pumped by 0-2 R(0) 1217.205 Å | Pumped by 0-2 R(1) 1217.643 Å | ||||||||
| 1335.921 | 0-4 P(1) | 3.4(0.8) | 1274.589 | 0-3 R(0) | 27.4(1.1) | 1274.980 | 0-3 R(1) | 24.6(1.0) | ||
| 1396.281 | 0-5 P(1) | 3.3(0.5) | 1279.518 | 0-3 P(2) | 39.2(1.1) | 1283.161 | 0-3 P(3) | 28.0(1.2) | ||
| 1457.474 | 0-6 P(1) | 3.7(0.5) | 1333.533 | 0-4 R(0) | 42.8(1.2) | 1333.851 | 0-4 R(1) | 7.9(0.7) | ||
| 1338.630 | 0-4 P(2) | 73.1(1.3) | 1342.314 | 0-4 P(3) | 64.9(1.3) | |||||
| Pumped by 0-2 R(2) 1219.089 Å | 1393.785 | 1-5 R(0) | 35.3(1.7) | 1394.021 | 0-5 R(1) | 52.4(1.9) | ||||
| 1346.970 | 0-4 P(4) | 3.8(0.5) | 1399.013 | 1-5 P(2) | 73.8(1.7) | 1402.707 | 1-5 P(3) | 73.1(1.8) | ||
| 1395.255 | 0-5 R(2) | 2.4(0.4) | 1454.892 | 1-6 R(0) | 20.8(1.1) | 1455.038 | 1-6 R(1) | 30.9(1.4) | ||
| 1407.350 | 0-5 P(4) | 3.0(0.5) | 1460.223 | 2-6 P(2) | 41.6(1.5) | 1463.885 | 1-6 P(3) | 42.1(1.4) | ||
| 1468.454 | 0-6 P(4) | 3.4(0.6) | 1516.271 | 0-7 R(0) | 21.2(b) | 1516.271 | 0-7 R(1) | 21.2(b) | ||
| 1521.647 | 2-7 P(2) | 16.2(1.1) | 1525.215 | 2-7 P(3) | 17.9(1.0) | |||||
| Pumped by 0-5 P(18) 1548.146 Å | ||||||||||
| 1437.868 | 0-3 P(18) | 1.6(0.5) | Pumped by 1-2 P(5) 1216.070 Å | Pumped by 1-2 R(6) 1215.726 Å | ||||||
| 1446.791 | 0-4 R(16) | 4.4(0.5) | 1148.7012 | 0-1 R(3) | 4.6(0.9) | 1237.918 | 0-2 P(8) | 11.5(1.3) | ||
| 1493.748 | 0-4 P(18) | 4.7(0.7) | 1161.8752 | 0-1 P(5) | 10.9(b) | 1271.074 | 0-3 R(6) | 14.1(1.0) | ||
| 1501.748 | 0-5 R(16) | 3.8(0.6) | 1202.449 | 0-2 R(3) | 11.3(2.2) | 1293.927 | 0-3 P(8) | 13.0(0.8) | ||
| 1554.948 | 0-6 R(16) | 4.3(0.8) | 1257.883 | 0-3 R(3) | 18.1(0.9) | 1327.623 | 0-4 R(6) | 6.1(0.7) | ||
| 1271.979 | 1-3 P(5) | 20.5(1.0) | 1351.100 | 0-4 P(8) | 2.8(0.4) | |||||
| Pumped by 1-1 P(11) 1212.425 Å | 1314.690 | 1-4 R(3) | 12.2(0.7) | 1409.024 | 1-5 P(8) | 2.2(0.5) | ||||
| 1292.507 | 0-3 R(9) | 4.9(0.5) | 1329.184 | 1-4 P(5) | 7.5(0.7) | 1442.920 | 1-6 R(6) | 11.3(0.7) | ||
| 1323.303 | 0-3 P(11) | 3.8(0.6) | 1372.550 | 2-5 R(3) | 3.2(0.4) | 1467.147 | 1-6 P(8) | 17.6(1.1) | ||
| 1380.131 | 1-4 P(11) | 3.4(b) | 1387.422 | 2-5 P(5) | 7.1(0.6) | 1500.511 | 2-7 R(6) | 19.7(1.2) | ||
| 1462.201 | 0-6 R(9) | 3.8(0.6) | 1431.072 | 3-6 R(3) | 29.0(1.2) | 1524.712 | 2-7 P(8) | 23.5(1.3) | ||
| 1494.260 | 0-6 P(11) | 4.8(0.6) | 1446.178 | 3-6 P(5) | 44.2(1.5) | 1556.921 | 3-8 R(6) | 17.0(1.1) | ||
| 1518.184 | 0-7 R(9) | 5.6(0.9) | 1489.625 | 3-7 R(3) | 48.2(1.7) | 1580.743 | 3-8 P(8) | 17.5(1.8) | ||
| 1572.402 | 1-8 R(9) | 4.5(0.9) | 1504.812 | 3-7 P(5) | 57.5(2.3) | 1633.905 | 3-9 P(8) | 5.5(1.5) | ||
| 1603.314 | 1-8 P(11) | 9.7(2.2) | 1547.398 | 3-8 R(3) | 35.3(2.7) | |||||
| 1562.457 | 4-8 P(5) | 37.2(1.7) | Pumped by 4-3 R(6) 1214.995 Å | |||||||
| Pumped by 3-0 P(18) 1217.982 Å | 1603.164 | 4-9 R(3) | 11.2(2.2) | 1393.003 | 0-6 P(8) | 1.2(0.3) | ||||
| 1268.890 | 0-1 P(18) | 1.4(0.4) | 1617.952 | 4-9 P(5) | 11.6(1.9) | 1522.086 | 0-9 R(6) | 2.1(0.5) | ||
| 1597.239 | 0-9 R(16) | 4.3(1.0) | 1606.359 | 0-11 R(6) | 4.4(0.9) | |||||
| 1597.514 | 0-8 P(18) | 2.0(0.9) | ||||||||
| Table 2 (continued): | ||||||||||
| Pumped by 2-1 P(13) 1217.904 Å | Pumped by 2-1 R(14) 1218.521 Å | Pumped by 3-3 P(1) 1217.038 Å | ||||||||
| 1237.589 | 0-2 R(11) | 8.7(1.1) | 1257.460 | 0-1 P(16) | 2.7(0.5) | 1270.631 | 0-4 P(1) | 3.1(0.5) | ||
| 1271.238 | 0-2 P(13) | 13.5(0.9) | 1310.622 | 0-2 P(16) | 4.1(0.6) | 1380.131 | 3-6 P(1) | 3.4(b) | ||
| 1290.961 | 0-3 R(11) | 9.1(0.6) | 1323.741 | 0-3 R(14) | 2.1(0.4) | 1435.112 | 0-7 P(1) | 4.0(0.5) | ||
| 1380.042 | 0-4 P(13) | 2.3(0.5) | 1470.513 | 0-5 P(16) | 1.9(0.5) | 1591.385 | 3-10 P(1) | 14.4(1.5) | ||
| 1399.304 | 0-5 R(11) | 12.1(0.9) | 1569.340 | 0-7 P(16) | 3.1(0.9) | 1636.401 | 0-11 P(1) | 7.8(1.8) | ||
| 1434.598 | 1-5 P(13) | 15.6(0.9) | 1612.458 | 1-8 P(16) | 3.6(0.9) | |||||
| 1453.160 | 1-6 R(11) | 15.4(0.9) | 1617.505 | 1-9 R(14) | 4.1(1.3) | Pumped by 3-3 R(2) 1217.031 Å | ||||
| 1488.306 | 1-6 P(13) | 6.8(0.8) | and 3-2 P(4) 1174.923 Å | |||||||
| 1540.174 | 2-7 P(13) | 5.2(b) | Pumped by 3-1 P(14) 1213.356 Å | 1434.143 | 0-7 R(2) | 1.5(0.4) | ||||
| 1555.950 | 2-8 R(11) | 20.1(1.2) | 1370.343 | 0-4 P(14) | 4.0(0.5) | 1445.258 | 0-7 P(4) | 3.1(0.5) | ||
| 1588.867 | 2-8 P(13) | 24.1(1.6) | 1386.577 | 0-5 R(12) | 3.4(0.5) | 1540.174 | 3-9 R(2) | 5.2(b) | ||
| 1602.336 | 3-9 R(11) | 28.7(2.5) | 1422.670 | 0-5 P(14) | 1.6(0.4) | 1589.226 | 3-10 R(2) | 4.6(0.9) | ||
| 1632.688 | 3-9 P(13) | 17.5(2.0) | 1488.100 | 0-7 R(12) | 6.7(1.0) | 1633.710 | 0-11 R(2) | 2.9(0.8) | ||
| 1522.875 | 1-7 P(14) | 5.1(0.8) | ||||||||
| Pumped by 3-1 R(15) 1214.465 Å | 1578.435 | 3-9 R(12) | 8.9(b) | Pumped by 4-2 R(12) 1213.677 Å | ||||||
| 1254.188 | 0-1 P(17) | 11.7(0.8) | 1608.409 | 1-9 P(14) | 8.5(1.1) | 1349.699 | 0-4 P(14) | 0.8(0.2) | ||
| 1265.232 | 0-2 R(15) | 13.6(0.9) | 1615.507 | 3-10 R(12) | 6.8(1.4) | 1415.400 | 0-6 R(12) | 1.5(0.3) | ||
| 1367.681 | 0-4 R(15) | 4.3(0.6) | 1509.491 | 0-8 R(12) | 1.3(2.9) | |||||
| 1408.876 | 0-4 P(17) | 11.6(0.7) | Pumped by 4-3 P(5) 1214.781 Å | 1541.331 | 0-8 P(14) | 2.2(0.8) | ||||
| 1418.291 | 0-5 R(15) | 10.9(0.7) | 1253.716 | 0-4 R(3) | 6.0(0.7) | 1611.132 | 4-10 P(14) | 8.6(1.2) | ||
| 1507.250 | 1-6 P(17) | 4.4(0.7) | 1266.930 | 4-4 P(5) | 12.9(b) | 1614.063 | 1-11 R(12) | 4.5(1.1) | ||
| 1514.067 | 1-7 R(15) | 10.1(0.9) | 1359.146 | 1-6 R(3) | 6.5(0.8) | |||||
| 1591.064 | 1-8 P(17) | 6.3(1.2) | 1372.768 | 1-6 P(5) | 7.2(0.7) | Pumped by 4-0 P(19) 1217.410 Å | ||||
| 1593.339 | 2-9 R(15) | 25.7(1.9) | 1463.641 | 1-8 R(3) | 2.3(0.6) | 1266.930 | 4-1 P(19) | 12.9(b) | ||
| 1621.200 | 3-10 R(15) | 11.8(1.5) | 1477.106 | 2-8 P(5) | 5.8(0.7) | 1274.085 | 0-2 R(17) | 5.0(0.6) | ||
| 1622.205 | 3-9 P(17) | 29.7(2.3) | 1513.566 | 2-9 R(3) | 4.3(0.7) | 1372.131 | 0-4 R(17) | 4.9(0.6) | ||
| 1526.622 | 3-9 P(5) | 6.1(1.0) | 1414.761 | 0-4 P(19) | 4.6(0.6) | |||||
| 1Observed , line ID, & Flux() | 1572.709 | 4-10 P(5) | 6.8(1.1) | 1465.261 | 0-6 R(17) | 5.2(0.8) | ||||
| Flux, in 10-15 erg cm-2 s-1 | 1602.689 | 3-11 R(3) | 17.6(2.0) | 1505.222 | 0-6 P(19) | 3.9(0.8) | ||||
| 2Observed with FUSE | 1613.784 | 3-11 P(5) | 20.4(1.5) | 1544.345 | 1-8 R(17) | 3.6(0.8) | ||||
| (b) indicates blend | ||||||||||
| Aul | Flux1 | Aul | Flux1 | |||||||
|---|---|---|---|---|---|---|---|---|---|---|
| Å | (s-1) | Å | (s-1) | |||||||
| 1501.674 | 2.178e+08 | 5 | 16 | 5.01 | 1604.905 | 5.346e+07 | 7 | 16 | ||
| 1493.673 | 2.107e+08 | 4 | 18 | 4.63 | 1335.299 | 4.231e+07 | 2 | 16 | ||
| 1446.719 | 1.948e+08 | 4 | 16 | 4.35 | 1647.325 | 1.914e+07 | 7 | 18 | ||
| 1548.146 | 1.909e+08 | 5 | 18 | 1325.281 | 1.501e+07 | 1 | 18 | |||
| 1554.849 | 1.497e+08 | 6 | 16 | 5.42 | 1280.162 | 9.346e+06 | 1 | 16 | ||
| 1437.781 | 1.435e+08 | 3 | 18 | 3.03 | 1650.012 | 5.812e+06 | 8 | 16 | ||
| 1391.008 | 1.132e+08 | 3 | 16 | 1269.897 | 1.648e+06 | 0 | 18 | |||
| 1599.932 | 9.589e+07 | 6 | 18 | 1226.004 | 9.338e+05 | 0 | 16 | |||
| 1381.413 | 6.097e+07 | 2 | 18 | 1687.919 | 2.402e+05 | 8 | 18 | |||
| 1 erg s-1 cm-2 | ||||||||||
| ID | Flux1 | Pump ID | Pump | (eV) | |
| 1412.887 | 2-5 P(11) | 2.6(0.6) | 2-2 R(9) | 1219.101 | 1.56 |
| 1465.110 | 0-6 R(5) | 2.1(0.6) | 0-1 R(5) | 1173.9812 | 0.72 |
| 1363.575 | 0-4 R(8) | 2.3(0.4) | 0-3 P(10) | 1334.497 | 2.10 |
| 1393.506 | 0-4 P(10) | 2.8(1.0) | 0-3 P(10) | 1334.497 | 2.10 |
| 1404.040 | 0-4 P(11) | 2.3(0.5) | 0-0 P(11) | 1175.893 | 0.88 |
| 1522.331 | 0-6 P(11) | 3.7(0.8) | 0-0 P(11) | 1175.893 | 0.88 |
| 1500.244 | 0-3 P(22) | 1.6(0.4) | 0-4 R(20) | 1551.8363 | 3.76 |
| 1491.761 | 1-7 P(2) | 3.5(0.6) | 1-8 P(2) | 1550.0852 | 3.36 |
| 1498.097 | 0-2 P(25) | 1.4(0.5) | 0-3 P(25) | 1547.971 | 4.20 |
| 1542.322 | 0-4 R(23) | 3.0(0.8) | 0-3 P(25) | 1547.971 | 4.20 |
| 1594.139 | 0-4 P(25) | 2.0(0.9) | 0-3 P(25) | 1547.971 | 4.20 |
| 1359.052 | 1-3 P(14) | 2.6(0.7) | 1-1 R(12) | 1212.543 | 1.49 |
| 1541.125 | 1-7 R(12) | 2.3(0.6) | 1-1 R(12) | 1212.543 | 1.49 |
| 1578.435 | 1-7 P(14) | 8.94 | 1-1 R(12) | 1212.543 | 1.49 |
| 1593.826 | 3-10 R(5) | 3.2(0.8) | 3-2 R(5) | 1175.248 | 1.20 |
| 1608.238 | 5-12 R(6) | 2.6(0.8) | 5-3 P(8) | 1218.575 | 1.89 |
| erg cm-2 s-1 | |||||
| 2Unlikely pumping mechanisms | |||||
| 3Also 0-5 P(22) at 1550.826 Å | |||||
| 4Flux uncertain due to line blend | |||||
| ID | FWHM | (FWHM) | Flux | (F) | ||||
|---|---|---|---|---|---|---|---|---|
| Å | km s-1 | km s-1 | km s-1 | km s-1 | (10-15 erg cm-2 s-1 Å-1) | |||
| C III | 1175.734 | - | - | 417 | 10.3 | 412 | 11 | 1.28 |
| S I | 1295.696 | 9.7 | 1.6 | 47.7 | 3.70 | 14.85 | 0.91 | 1.05 |
| S I | 1296.231 | 13.9 | 2.1 | 51.4 | 4.63 | 11.89 | 0.83 | 1.05 |
| Si II | 1309.333 | 13.1 | 1.8 | 133.6 | 3.90 | 63.20 | 1.91 | 1.55 |
| ? | 1315.725 | - | 1.8 | 9.6 | 2.3 | 2.14 | 0.37 | 1.13 |
| C I | 1328.896 | 14.4 | 1.3 | 10.8 | 2.71 | 2.92 | 0.42 | 1.19 |
| C I | 1329.183 | 18.7 | 2.1 | 25.7 | 2.48 | 8.33 | 0.62 | 1.19 |
| C I | 1329.652 | 14.4 | 1.8 | 34.5 | 3.84 | 8.03 | 0.79 | 1.24 |
| Cl I | 1351.709 | 11.8 | 3.9 | 49.5 | 9.0 | 4.81 | 0.66 | 1.01 |
| ? | 1355.434 | - | 1.9 | 17.0 | 1.8 | 6.17 | 0.69 | 0.93 |
| ? | 1355.642 | - | 2.4 | 14.4 | 4.8 | 1.86 | 0.51 | 0.93 |
| O I | 1355.844 | 54.5 | 3.0 | 48.5 | 7.8 | 7.53 | 0.96 | 0.80 |
| ? | 1356.200 | - | 3.2 | 15.2 | 5.4 | 1.39 | 0.46 | 0.80 |
| ? | 1360.228 | - | 7.3 | 27.8 | 8.60 | 2.76 | 0.66 | 0.79 |
| Si IV | 1393.935 | 42.8 | 2.8 | 168.3 | 6.46 | 75.92 | 4.51 | 1.62 |
| Si IV | 1402.828 | 9.4 | 3.4 | 130.2 | 8.13 | 34.14 | 2.74 | 1.16 |
| S I | 1425.084 | 11.4 | 1.7 | 10.9 | 3.58 | 2.07 | 0.46 | 1.26 |
| ? | 1436.618 | - | 1.2 | 12.7 | 2.92 | 3.51 | 0.57 | 1.02 |
| C I | 1463.351 | 3.0 | 2.2 | 31.0 | 4.31 | 8.99 | 1.07 | 0.92 |
| C I | 1560.403 | 18.1 | 1.7 | 28.6 | 4.42 | 12.97 | 1.64 | 1.00 |
| C I | 1560.784 | 19.6 | 1.9 | 48.8 | 4.42 | 22.01 | 2.03 | 1.00 |
| C I | 1561.460 | 23.1 | 1.6 | 62.6 | 3.84 | 36.79 | 2.57 | 1.00 |
| C I | 1656.362 | 17.2 | 1.6 | 52.5 | 3.44 | 53.15 | 4.17 | 1.00 |
| C I | 1657.029 | 3.8 | 1.8 | 49.1 | 3.98 | 62.29 | 4.36 | 1.28 |
| C I | 1657.448 | 12.5 | 2.9 | 60.5 | 7.60 | 43.67 | 3.90 | 1.28 |
| C I | 1657.967 | 10.9 | 1.6 | 25.3 | 3.62 | 27.71 | 3.05 | 1.28 |
| C I | 1658.204 | 15.0 | 2.0 | 36.0 | 4.88 | 32.75 | 3.27 | 1.28 |
| ID | (eV) | # of lines | ||||||
| 3-2 P(4)2 | 1174.923 | 3 | 3 | 2 | 4 | 1.13 | - | - |
| 1-1 P(11) | 1212.425 | 1 | 10 | 1 | 11 | 1.36 | 8 | 39 |
| 3-1 P(14) | 1213.356 | 3 | 13 | 1 | 14 | 1.79 | 9 | 42 |
| 4-2 R(12) | 1213.677 | 4 | 13 | 2 | 12 | 1.93 | 6 | 19 |
| 3-1 R(15) | 1214.465 | 3 | 16 | 1 | 15 | 1.94 | 11 | 140 |
| 4-3 P(5) | 1214.781 | 4 | 4 | 3 | 5 | 1.65 | 15 | 96 |
| 4-3 R(6) | 1214.995 | 4 | 7 | 3 | 6 | 1.72 | 3 | 8 |
| 1-2 R(6) | 1215.726 | 1 | 7 | 2 | 6 | 1.27 | 13 | 162 |
| 1-2 P(5) | 1216.070 | 1 | 4 | 2 | 5 | 1.20 | 18 | 350 |
| 3-3 R(2) | 1217.031 | 3 | 3 | 3 | 2 | 1.50 | 5 | 17 |
| 3-3 P(1) | 1217.038 | 3 | 0 | 3 | 1 | 1.48 | 5 | 33 |
| 0-2 R(0) | 1217.205 | 0 | 1 | 2 | 0 | 1.00 | 10 | 395 |
| 4-0 P(19) | 1217.410 | 4 | 18 | 0 | 19 | 2.20 | 7 | 36 |
| 0-2 R(1) | 1217.643 | 0 | 2 | 2 | 1 | 1.02 | 11 | 360 |
| 2-1 P(13) | 1217.904 | 2 | 12 | 1 | 13 | 1.64 | 13 | 179 |
| 3-0 P(18) | 1217.982 | 3 | 17 | 0 | 18 | 2.02 | 3 | 10 |
| 2-1 R(14) | 1218.521 | 2 | 15 | 1 | 14 | 1.79 | 7 | 22 |
| 0-2 R(2) | 1219.089 | 0 | 3 | 2 | 2 | 1.04 | 4 | 13 |
| 0-2 P(1) | 1219.368 | 0 | 0 | 2 | 1 | 1.02 | 3 | 10 |
| 0-5 P(18) | 1548.146 | 0 | 17 | 5 | 18 | 3.78 | 5 | 19 |
| erg cm-2 s-1 | ||||||||
| 2Secondary pump - primary pump is 3-3 R(2) at 1217.03 | ||||||||