Formation of gas disks in merging galaxies
Abstract
Observations indicate that much of the interstellar gas in merging galaxies may settle into extended gaseous disks. Here, I present simulations of disk formation in mergers of gas-rich galaxies. Up to half of the total gas settles into embedded disks; the most massive instances result from encounters in which both galaxies are inclined to the orbital plane. These disks are often warped, many have rather complex kinematics, and roughly a quarter have counter-rotating or otherwise decoupled central components. Disks typically grow from the inside out; infall from tidal tails may continue disk formation over long periods of time.
keywords:
galaxies: mergers – galaxies: kinematics and dynamics – galaxies: structure1 INTRODUCTION
Gas falling into the nuclei of interacting and merging galaxies has attracted much attention. Nuclear inflows fuel the bursts of star formation responsible for the anomalous colors (Toomre & Toomre 1972; Larson & Tinsley 1978) and extraordinary IR luminosities (Joseph & Wright 1985; Sanders & Mirabel 1996) of merging galaxies; the stars formed in this manner may play a crucial role in transforming merger remnants into elliptical galaxies (Kormendy & Sanders 1992). Numerical simulations show that these inflows occur when gravitational torques remove angular momentum from shocked galactic gas (Noguchi 1988; Hernquist 1989; Combes, Dupraz, & Gerin 1990; Barnes & Hernquist 1991, 1996). In typical cases percent of the gas initially distributed throughout the progenitor disks may wind up in a nuclear cloud with dimensions of .
Less attention has been paid to the gas which fails to reach the nuclei of merger remnants. Extended HI, HII, and X-ray emission is often seen in merging galaxies, but the gas responsible is usually too dilute to directly fuel violent star formation or AGN activity. There has been little numerical work on the fate of extended gas in mergers, in part because it’s expensive to continue a simulation once a compact nuclear gas cloud has formed.
There are reasons to think that extra-nuclear gas may play a role in the evolution of merger remnants. The well-studied merger remnant NGC 7252 exhibits extended emission from ionized gas with remarkably complex kinematics (Schweizer 1982, 1998): an inner disk with radius and a well-defined axis of rotation is surrounded by a region which shows rapid minor-axis rotation and an apparent velocity reversal. This inner disk, seen as a vivid spiral in HST images (Whitmore et al. 1993), contains of molecular and ionized gas (Dupraz et al. 1990). A comparable amount of atomic gas lingers in the tidal tails; these return gas to the main body of the remnant at at rate of (Hibbard et al. 1994; Hibbard & Mihos 1995). Whatever the fate of this gas, it’s worth asking how a system with such complex kinematics could form in the first place.
In this paper I use simulations to explore the possibility that extended gas disks and associated structures can form as part of the merger process. Each simulation begins with a pair of disk galaxies falling together on a parabolic relative orbit, and follows their collision and the eventual formation and initial relaxation of a merger remnant. The interstellar material is modeled by including a component obeying the equations of motion of an isothermal gas. This approach is deliberately simple-minded when compared to simulations which include star formation, feedback, and other processes (e.g. Katz 1992; Mihos & Hernquist 1994; Gerritsen & Icke 1997; Springel 2000). Star formation is clearly important for the evolution and eventual fate of merging galaxies, but there’s no evidence that stellar processes are essential for the formation of gas disks like the one in NGC 7252. My intention is to present a simple model which appears capable of explaining the disks observed in merger remnants.
2 SIMULATIONS
Isothermal simulations are relatively cheap, so an encounter survey can be performed with modest computational resources. For ease of comparison, I adopted the same set of four encounter geometries used in previous studies (e.g. Barnes 1992; Barnes & Hernquist 1996). Table 1 lists disk inclinations and pericentric arguments for the passages used in this paper. Each combination was used in three different encounters: first, a close passage of galaxies with a 1:1 mass ratio; second, a more distant passage, again with a 1:1 ratio; and third, a close passage with a 3:1 mass ratio. Thus there are simulations in this survey. For convenience, I designate each simulation by specifying the disk geometry (from Table 1), the mass ratio (either 1:1 or 3:1), and optionally the pericentric separation (C or D). Thus DIR 1:1 C specifies a direct, close passage of equal-mass galaxies, DIR 1:1 D is a more distant version of the same encounter, and INC 3:1 is an inclined passage of galaxies with a 3:1 mass ratio.
| Geometry | ||||
|---|---|---|---|---|
| DIRect | 0 | – | 71 | 30 |
| RETrograde | 180 | – | -109 | 30 |
| POLar | 71 | 90 | -109 | 90 |
| INClined | 71 | -30 | -109 | -30 |
The galaxy models in these experiments are the same as those used in earlier studies (Barnes 1998; Bendo & Barnes 2000). Briefly, each model contains a bulge with a shallow cusp (Hernquist 1990), an exponential disk with constant scale height (Freeman 1970; Spitzer 1942), and a dark halo with a constant-density core (Dehnen 1993; Tremaine et al. 1994). Density profiles for these components are
| (1) |
where is the spherical radius, is the cylindrical radius in the disk plane, and is the distance from the disk plane. The gas is initially distributed like the disk component and amounts to percent of the disk mass. Initial velocities and velocity dispersions for the collisionless components were determined from the Jeans equations (e.g. Hernquist 1993); the disk gas was set rotating at the local circular velocity.
Unless otherwise indicated, the results below are given in simulation units with . In these units, the galaxies in the equal-mass encounters had total masses and length scales , , , and . These choices yield a model with half-mass radius , rotation period , and binding energy . The same model was used for the larger galaxy in the simulations with a 3:1 mass ratio, while the smaller model was simply scaled down by a factor of in mass and a factor of in radius, thereby following a relation similar to the observed luminosity-rotation velocity relation for disk galaxies. The large galaxy model may be roughly scaled to the Milky Way by equating the simulation units of length, mass, and time to , , and , respectively. Gravitational forces were calculated after smoothing the mass distribution using a Plummer kernel with .
The gas had an isothermal equation of state, , where the sound speed is fixed at velocity units. The simulation code evaluates the heating of each gas particle due to adiabatic compression and shocks; this energy is assumed to be radiated instantly, so the gas stays at a constant temperature. The sound speed is an order of magnitude smaller than typical circular velocities in these models; thus gas pressure forces are relatively small, and the gas travels on roughly ballistic trajectories except where diverted by shocks. If the large galaxy model is scaled to the MW, the sound speed is , corresponding to a gas temperature of . I chose this value to take account of non-thermal pressures due to magnetic fields and turbulence, but the more conventional choice of would yield nearly identical results.
Initial conditions for the encounters were generated by building pairs of galaxy models, placing them on the chosen orbits, and rotating them to the desired orientations. The initial center-of-mass position and velocity of each galaxy were determined from a parabolic orbit of two point masses and with pericentric separation and time of pericenter . For the 1:1 encounters the close passages had , while the distant passage had . The 3:1 encounters used . In all cases , so point masses on these orbits would reach pericenter exactly one time unit after the start of the simulation. Of course, the actual trajectories deviate from the Keplerian ideal as soon as the galaxy models begin to interpenetrate (e.g. Barnes 1988, 1992). At first passage, these deviations are modest – the close encounters come within at , while the distant ones reach at .
Each simulation used particles. Collisionless components were followed using standard N-body techniques, while the gas was simulated using Smoothed Particle Hydrodynamics or SPH (e.g. Monaghan 1992); the code uses a hierarchical algorithm to compute gravitational forces, adaptive smoothing to resolve a fixed mass scale in the gas, and adaptive time-steps determined by a Courant condition. To take maximum advantage of a cluster of eight processors, I ran multiple calculations simultaneously. Most runs required between and processor hours, largely spent in the later stages where high gas densities demand very short time-steps. Energy and angular momentum were conserved to a fraction of a percent in all cases.
The resolution of these simulations is comparable to that available in earlier SPH studies of dissipative encounters involving disk galaxies (e.g. Hernquist 1989; Barnes & Hernquist 1991, 1996; Mihos & Hernquist 1994, 1996). Gravitational forces were evaluated with a fixed smoothing of length units, which is small enough to follow the overall dynamics of the interacting galaxies; the nuclei of the resulting merger remnants are poorly resolved, but the disks formed in these simulations are an order of magnitude larger than and thus not severely compromised by gravitational smoothing. Hydrodynamic forces were calculated by smoothing over gas particles; each gas particle has a mass of mass units, so the SPH calculation has a mass resolution of . For gas with a density and sound speed , the Jeans length is and the Jeans mass is ; the gravitational force calculation resolves if , while the SPH calculation resolves if . Thus the collapse of small-scale structure in the gas is limited by the spatial resolution of the gravitational force calculation, with hydrodynamic resolution playing only a secondary role. Suppression of small-scale collapse, which would be fatal for studies of fragmentation via Jeans instabilities (e.g. Bate & Burkert 1997), may even benefit these simulations by preserving the smooth structure of the gas. The code does not suppress the Jeans instability on scales ; on such scales, the gas is usually stabilized by the combined effects of pressure and rotation (Toomre 1964).
Nonetheless, these simulations are in fact quite crude. The SPH smoothing length often exceeds the vertical scale height of the simulated gas disks; in effect, these structures are resolved in the radial direction, but not in the vertical direction. Under such circumstances the calculation provides only a rough approximation to the dynamics of a smooth gas, and it seems better to view the SPH code as a locally momentum-conserving scheme in which particles representing gas tend to seek out closed, non-intersecting orbits. At least an order of magnitude more gas particles are needed to significantly improve this situation. While there’s no simple way to anticipate the results of such ambitious calculations, it’s plausible that disk-like structures like those reported in this paper will continue to appear in future experiments.
3 ENCOUNTERS
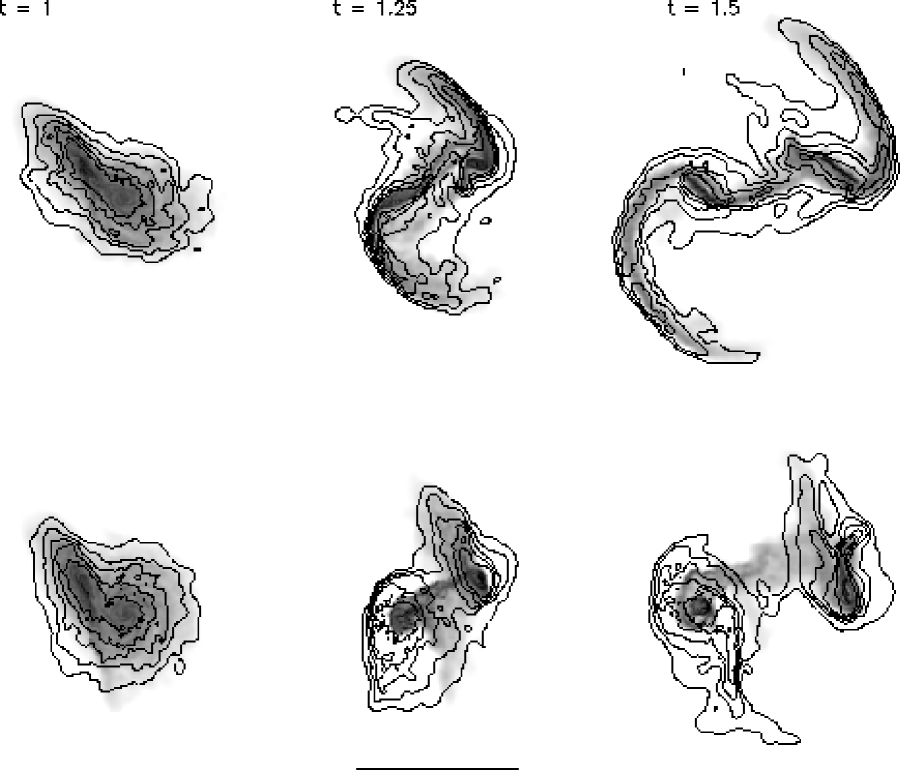
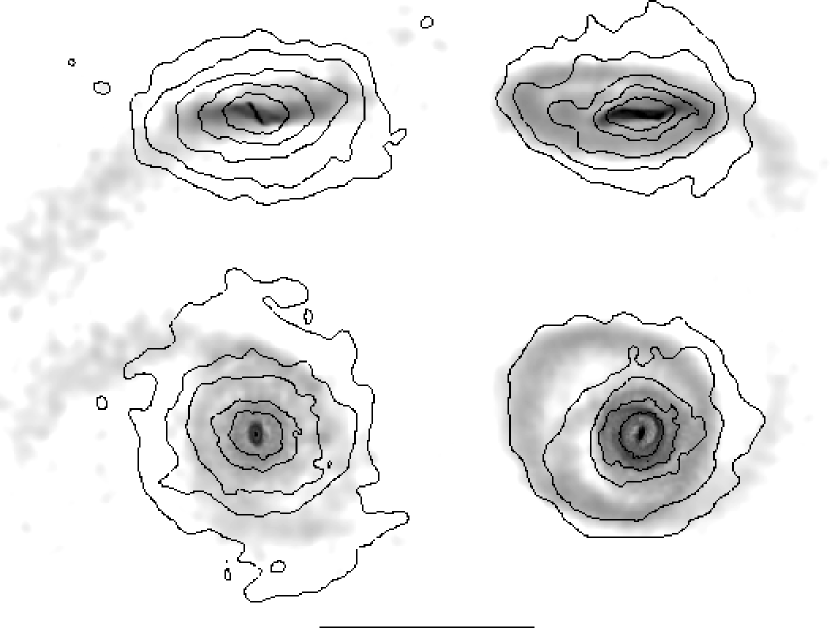
Direct and retrograde versions of a close passage are compared in Figure 1. Encounter DIR 1:1 C (top) resembles direct encounters described in other studies (Barnes & Hernquist 1991, 1996; Mihos & Hernquist 1994, 1996). Although the disks interpenetrate, only a modest fraction of the gas actually collides with gas from the other disk. The stellar and gaseous components both respond to the tidal forces by developing extended bridges and tails (Toomre & Toomre 1972). In the aftermath of such passages, much of the gas is rapidly driven into the central regions; these inflows are driven by gravitational torque between the stellar and gaseous bars formed in tidally perturbed disks (Combes, Dupraz, & Gerin 1990; Barnes & Hernquist 1991; Mihos & Hernquist 1996). Encounter RET 1:1 C (bottom) illustrates a violent hydrodynamic interaction. The geometry of this collision insures that a large fraction of the gas suffers strong shocks as the galaxies intersect. By time (middle), much of the gas in these disks has been swept toward their centers. These inflows are not driven by gravitational torques – the stellar disks are far less perturbed than the gas, and incapable of exerting strong gravitational torques. Instead, they are driven by hydrodynamic forces; the gas loses its spin angular momentum by colliding directly with gas in the other galaxy. Gas which escapes being swept in forms a plume connecting the two galaxies; such structures may have been observed in some deeply interpenetrating encounters (e.g. Condon et al. 1993; Tsuchiya, Korchagin, & Wada 1998).
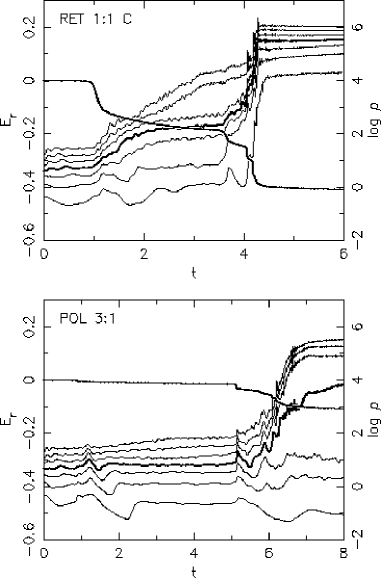
To illustrate the range of evolutionary histories in this sample of encounters, Figure 2 concisely summarizes two rather different experiments. In these plots, is the total energy lost to radiative processes, while is the gas density. As one might guess from the discussion above, encounter RET 1:1 C is the most dissipative of those studied here; net radiative losses amount to percent of the initial binding energy of the entire system. These losses occur in large-scale shocks as the two galaxies plow into each other at , fall back together at , and merge at . Gas densities increase with each burst of dissipation; by the end of the simulation percent of the gas lies in a barely-resolved disk at the center of the merger remnant. In contrast, encounter POL 3:1 is the least dissipative, losing only percent of its initial binding energy. The first passage at , while close enough to produce definite tidal features, barely registers in the traces of and . The next passage, at , is more dramatic, and the final merger at drives about half of the gas into the central regions; the rest of the gas eventually settles into a warped disk.
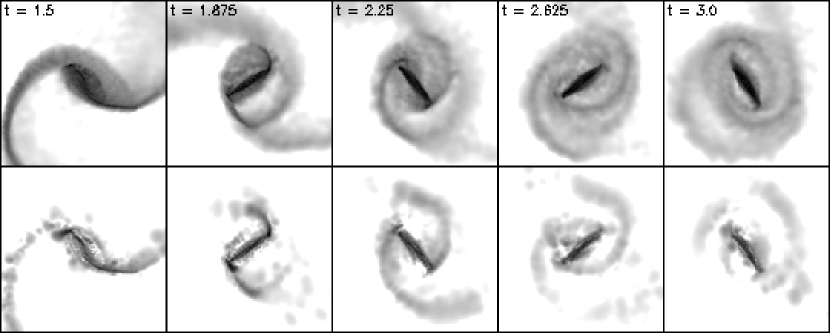
Disk formation need not wait until the merger process is completed; reaccretion from tidal bridges and tails can feed high angular momentum gas back into galaxies after any reasonably direct passage. An example is illustrated in Figure 3. Here the upper row shows gas in the larger disk of encounter DIR 3:1 responding after the direct passage of its lighter companion; note the pronounced bar typically formed in such passages. The lower row shows where shocks occur by rendering each particle with intensity proportional to the local dissipation rate . While the central bar is prominent in the lower images, shocks also develop in the disk surrounding the bar. Some of these shocks form where gas falling back from the tidal tail and bridge impinges on the disk; others occur within the disk, perhaps in response to forcing by the central bar. Between times and the reaccreted gas nearly doubles the size of the disk.
Reaccretion of gas from tidal tails is evident in a recent HI study of NGC 4038/9 (Hibbard et al. 2001). Relative to the systemic velocity, most of the tail associated with the northern disk (NGC 4038) is moving away from us, but the gas at the base of the tail has the opposite sense of motion. This indicates that the material at the base has already attained apocenter and is now falling back onto the disk. This reaccreted gas may be fueling the ring of star formation in the disk of NGC 4038.
One consequence of this disk rebuilding is that the gas and stars may be kinematically segregated in tidally disturbed disks. Reaccreted gas seeks out closed orbits, usually close to the disk plane, while reaccreted stars remain on highly eccentric orbits. This can produce dramatic effects in further tidal interactions, possibly explaining some cases in which stellar and HI tails fail to coincide (Hibbard, Vacca, & Yun 2000, Mihos 2001). Figure 4 illustrates the behavior of gas and stars in the second passage of encounter POL 1:1 C. The first frame shows two fairly relaxed gas disks (grey-scale), each embedded in a distended stellar disk (contours). In the second frame the disks have moved past each other, and a pronounced tail extends from the more direct member of the pair. By the third frame the gas and stellar distributions are quite different – the one is no longer a good predictor of the other. For example, the gas in the lower tail crosses several contours of the stellar distribution; evidently the kinematically cold gas has produced a narrow tidal tail, while the warmer stellar component has raised a broader feature. This last frame also shows that the two galaxies are at the point of merging.
4 REMNANTS
In broad outline, the mergers resulting from these twelve encounters are similar to those described in earlier studies (Negroponte & White 1983; Barnes & Hernquist 1991, 1996). Table 2 lists merger times for all twelve encounters. Gas usually has little effect on the overall dynamics of orbit decay and merging; of the four 1:1 C encounters, three merge within times of the corresponding stellar-dynamical versions (Barnes 1998). (The exception is RET 1:1 C, where the mechanical friction of the gas hastens the merger by .) As mentioned in the introduction, gas which suffers strong shocks tends to fall into galactic nuclei before and during the merger, where it creates central concentrations of highly dissipated gas. On the other hand, the gas which is not involved in strong shocks retains a large fraction of its initial angular momentum, and is available to build extended disks like those shown in Figure 5.
| Geom. | Orbit | N | B | D | L | T | ||
|---|---|---|---|---|---|---|---|---|
| DIR | 1:1 C | 6.0 | 3.9 | 72 | 1 | 10 | 13 | |
| 1:1 D | 10.0 | 8.5 | 85 | 2 | 2 | 8 | ||
| 3:1 | 6.0 | 4.3 | 79 | 1 | 8 | 10 | ||
| RET | 1:1 C | 6.0 | 4.3 | 91 | 3 | 3 | 3 | |
| 1:1 D | 11.5 | 9.5 | 93 | 5 | 2 | |||
| 3:1 | 6.0 | 5.5 | 89 | 11 | ||||
| POL | 1:1 C | 8.0 | 4.5 | 65 | 27 | 3 | 5 | |
| 1:1 D | 12.0 | 9.8 | 66 | 21 | 4 | 8 | ||
| 3:1 | 8.0 | 6.3 | 52 | 10 | 22 | 14 | 2 | |
| INC | 1:1 C | 8.0 | 4.4 | 76 | 18 | 4 | ||
| 1:1 D | 12.0 | 8.1 | 42 | 51 | 1 | 5 | ||
| 3:1 | 8.0 | 6.4 | 75 | 10 | 11 | 4 |
Ideally, simulations would be run well past . But as already noted, the later stages of these calculations are quite slow. Practical considerations forced me to stop at the times listed in Table 2. Most remnants had time units to relax; scaling the initial disks to the Milky Way, the galaxies in these experiments merged to before the end of the calculations. These remnants may thus be compared to late-stage Toomre-sequence (Toomre & Toomre 1972; Toomre 1977) galaxies or to IR-luminous merger remnants (Sanders & Mirabel 1996).
4.1 Structure
Figure 6 summarizes the distribution and kinematics of gas at the end of each simulation. These plots show logarithmic radii vs. radial velocities of gas particles. The distributions are roughly symmetric with respect to the horizontal axis at small radii, but distinctly asymmetric at larger radii. The narrow diagonal streaks seen at large radii represent tails extracted from the disks before they merged. Almost every pericentric passage yields a pair of tails, but the amount of tail material and its subsequent evolution depend on the geometry of the passage. Thus at the instants shown in Figure 6 the remnant produced by RET 3:1 has almost no gaseous tail material, while remnant DIR 3:1 still shows three distinct tails (and the remains of a fourth), each originating from a different disk at a different passage. The dashed curves in the upper right of each plot represent the nominal escape velocity . Some tail material has enough velocity to escape, but almost all falls back eventually. Tail material with has passed apogalacticon and is now falling back; as this material reenters the remnant, the gas encounters shocks and begins evolving toward closed orbits.
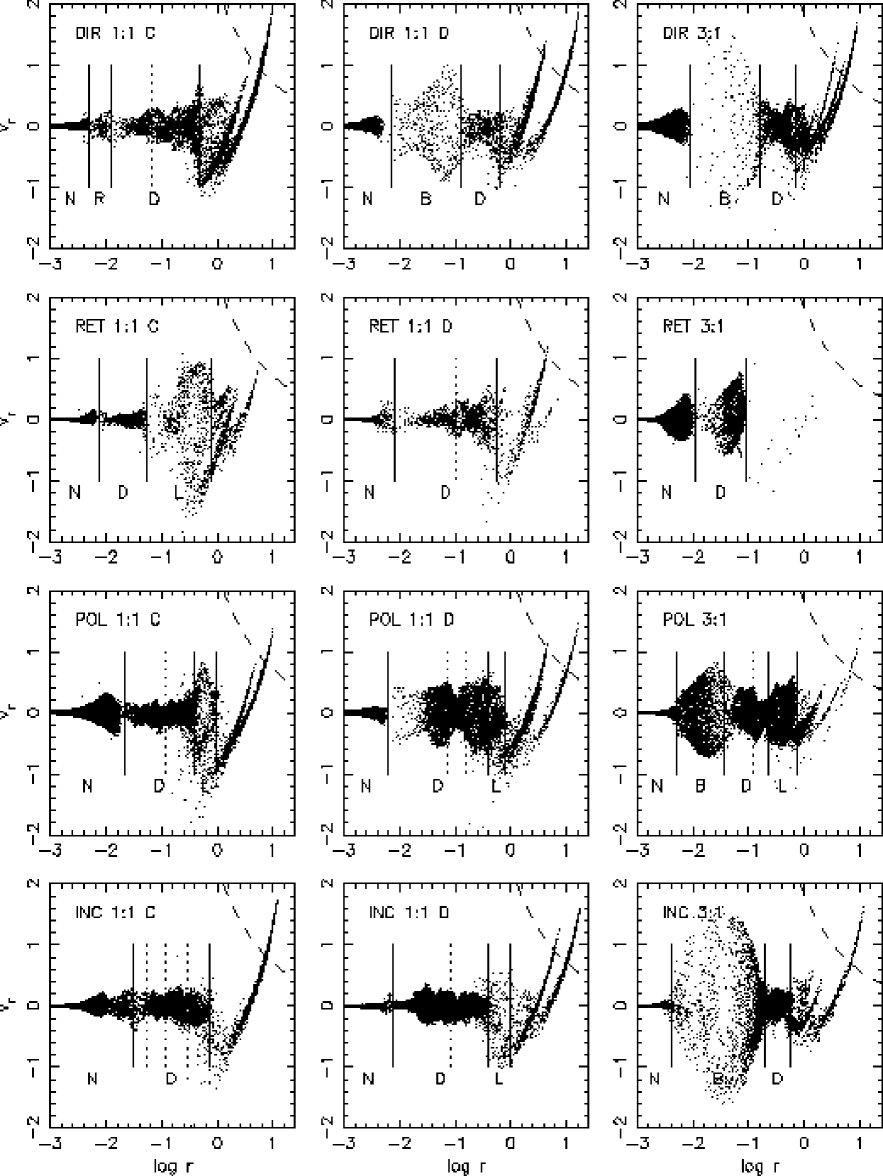
If the infalling gas has relatively little angular momentum it may plunge deep into the remnant and directly assimilate into a disk. In many cases, however, the tail gas has so much angular momentum that it initially side-swipes the central disk and subsequently follows eccentric, looping paths before falling back yet again; a vivid example is provided on the right in Figure 5. The gas on these looping orbits populates transition zones between asymmetric and symmetric distributions in Figure 6. These zones are labeled by the letter “L”; the various POLar encounters all produce clear examples of this behavior. A given gas particle may settle into a closed orbit after executing a few loops, but the loop structures themselves are replenished by continued infall.
At radii where the gas distribution is nearly symmetric with respect to lie the gas disks formed by this infall process. Gas on nearly-circular orbits has , while gas on elongated orbits has a large dispersion. Thus in Figure 6 the vertical spread of the points at a given radius gives information on the shapes of gas orbits. For example, remnants such as POL 1:1 C, INC 1:1 C, and INC 1:1 D have large amounts of gas with fairly narrow distributions; this gas lies in rotating disks, each labeled “D” in the plots. At smaller radii, remnants DIR 1:1 D, DIR 3:1, POL 3:1, and INC 3:1 have zones, labeled “B” in the plots, with large, symmetric spreads in . These arise where central triaxial or bar-like structures dominate the potential and the gas consequently moves on elongated orbits.
All twelve remnants have nuclear gas clouds characterized by very high densities, often of order model units. These nuclei, which are labeled “N” in Figure 6, usually have small radial velocity dispersions; most are supported by a combination of pressure and circular motion. But remnants DIR 3:1, RET 3:1, POL 1:1 C, and INC 1:1 C are different; in these cases the nuclear gas lies in rotating elliptical disks. These nuclei are barely resolved in the present simulations, so their detailed dynamics are not well-determined. However, the total masses and angular momenta of nuclear clouds should be more reliable since these are determined by events on somewhat larger scales. Several of these nuclear gas disks are kinematically decoupled with respect to the remnants they inhabit.
The gas fractions in the nuclei, bars, disks, loops, and tails of all remnants are listed in Table 2. Here and in what follows, each of these components is simply defined as all gas within an appropriate range of radii measured from the center of each remnant. These radii often correspond to obvious features in Figure 6; for example, the “D” (disk) component in remnant DIR 1:1 C is delimited by the abrupt end of the infalling tails at on the one hand, and by a marked change in the density of points at on the other hand. In a few cases the divisions between components are less obvious; in particular, it’s hard to define the boundaries between disks and outer loops from the data in Figure 6. To fix these boundaries more accurately, I used an interactive viewing program to inspect the gas distribution in three dimensions; on such a display, as in the right-hand side of Figure 5, the distinction between nearly circular disks and elongated loops is unmistakable.
As Table 2 shows, the initial orientation of the colliding disks has a definite effect on the distribution of gas in the remnants. Encounters in which both disks are tilted with respect to the orbital plane yield remnants with massive disks, while encounters in which a disk lies in the orbital plane drive more gas to the nuclear regions. Nuclei contain an average of percent of the gas in the remnants of DIRect and RETrograde encounters; the most massive nuclei, found in the RETrograde encounters, are produced by violent hydrodynamic forces as illustrated in Figure 1. In contrast, only percent of the gas lies in the nuclei of the POLar and INClined remnants; the balance is found in the extended bars, disks, and loops surrounding these nuclei.
Figure 7 displays rotation directions for the gas in the remnants. In each plot, an area-preserving map is used to transform the unit sphere of all possible spin directions onto the unit circle ; the direction of the initial orbit’s angular momentum vector always maps to the origin of . Any area-preserving map from the sphere to the plane must create some distortion; here, the direction exactly opposite to maps to the entire edge of the circle, and nearby regions are stretched into elongated crescents. However, the area-preserving property of this map implies that an isotropic ensemble of directions is mapped to a uniform distribution within . The images represent the angular momenta directions of gas particles; each particle’s angular momentum vector, measured with respect to the center of the remnant as defined by the peak gas density, was projected onto and thence mapped to , and the resulting distributions were smoothed with an iterated boxcar. In these images, color is used to indicate radii, with grey for the nuclei, blue for small radii, green and yellow for intermediate radii, and red for large radii.
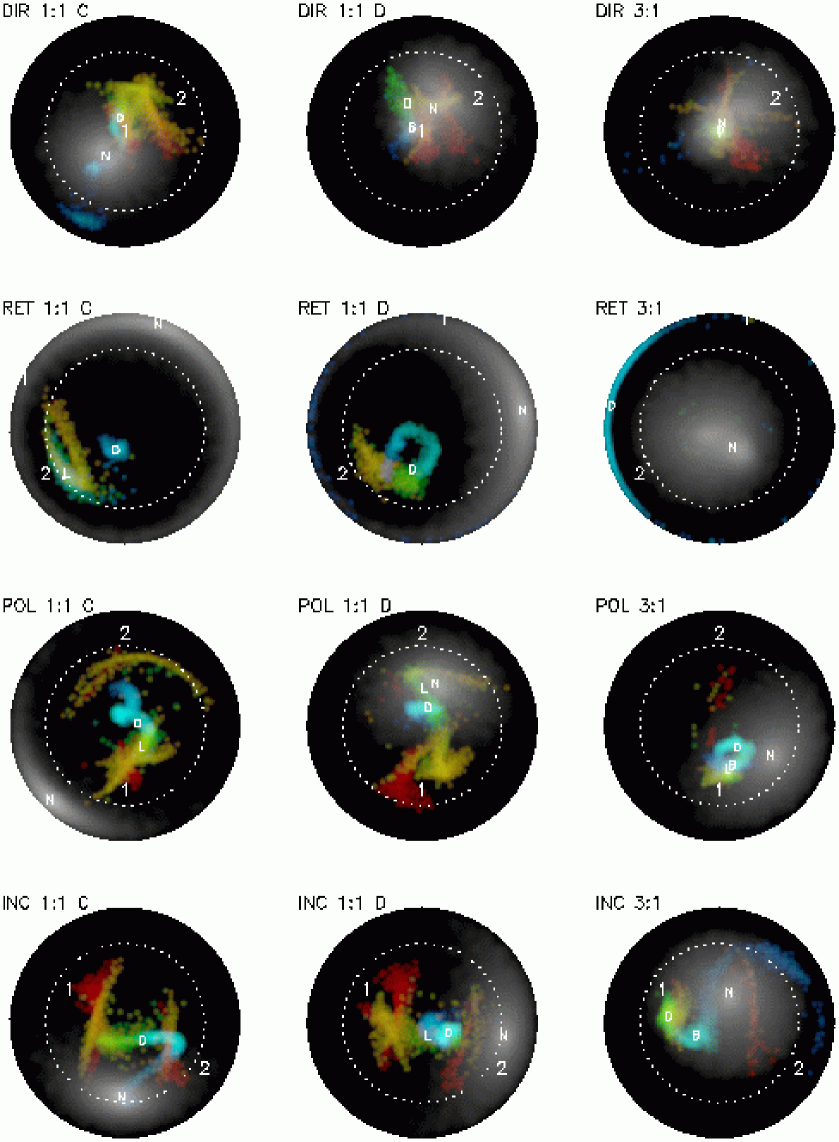
As Figure 7 shows, the remnants have diverse kinematics. Many of the structures seen here can be identified with components delineated in Figure 6. Gas in the nuclei, shown in grey, produces the broadest distributions, but each nucleus has a well-defined net spin direction which is marked by a “N” in these plots. Likewise, the “B”, “D”, and “L” symbols mark the net spin directions of the bars, disks, and loops; these coincide with the angular momenta of gas particles, shown in blue and green. On the other hand, the spin vectors of the initial disks, labeled “1” and “2”, generally don’t correspond to favored spin directions in the remnants, but often appear associated with material in tidal tails, here shown in yellow and red.
A few remnants display fairly simple structures. For example, remnants of DIRect encounters tend to have nuclei and disks with reasonably well-aligned rotation, basically because the spins and orbital motion of the initial encounter reinforce each another. But in many cases the gas has some kind of kinematic misalignment. All remnants of RETrograde passages have disjoint angular momenta distributions, with counter-rotating nuclei and disks. This is not surprising given the rather contrived initial conditions of these mergers; the distribution of gas between direct and retrograde rotation reflects the competition of spin and orbital angular momenta in these encounters. Several other remnants have gas nuclei with dramatic kinematic misalignments: remnant POL 1:1 C has a counter-rotating nucleus, while remnants INC 1:1 C and D have nuclei which rotate about axes roughly perpendicular to the axes of their disks.
As noted above, many remnant disks have warps. A disk which warps progressively along a single direction appears as a roughly linear feature with a smooth color gradient in Figure 7, as in the plot for remnant INC 1:1 C. In other disks the warp’s direction changes with radius, perhaps as a result of differential precession; such warps produce curved forms as in the plot for remnant POL 1:1 C, or even circular features like the one in RET 1:1 D. Most of these disks are fairly flat at small radii, as if the inner disks are locked into a single plane by self-gravity. Warps in the outer disks of these remnants may be excited by the return of tail material with misaligned angular momentum. In Figure 7 these remnants exhibit fairly smooth transitions from the disks (blue or green) to the tails (yellow or red); thus the angular momentum of the gas changes in a continuous manner with radius. The tails contain large amounts of angular momentum; as this material falls back it could exert strong torques, creating long-lived warps in remnant disks.
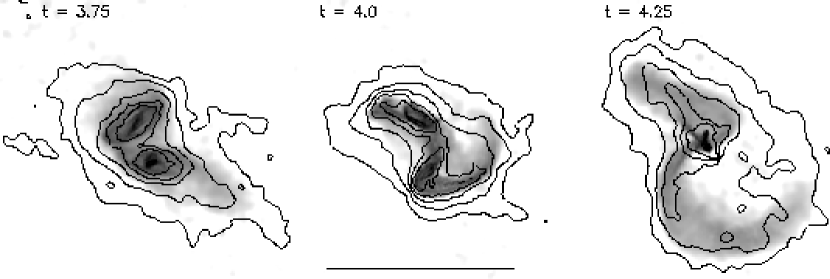
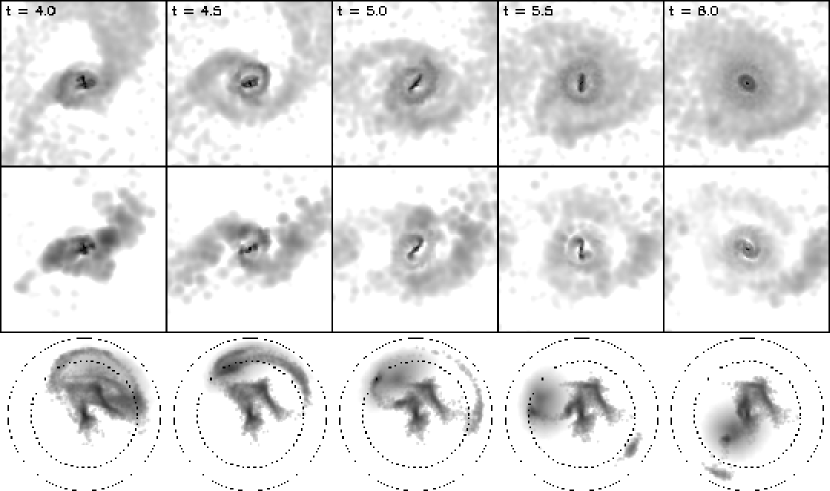
Remnant DIR 1:1 C provides the example of a precessing inner disk shown in Figure 8. This disk, bounded by the dotted line at in the upper-left panel of Figure 6, begins forming as soon as the nuclei of its progenitors have merged and the gravitational potential has settled down. By it’s seen roughly edge-on extending from eight to two o’clock; it has precessed counter-clockwise by by . During this time the inner disk remains relatively well-aligned with the nucleus. But between the nucleus and the inner disk lies a ring of material, inclined by , which precesses clockwise by between and . If the nucleus and inner disk are actually locked in alignment, they must be coupled gravitationally, since the ring lies between them.
To rough approximation, both the inner disk and extra-nuclear ring in this remnant behave like inclined rotators precessing in an oblate potential. But the middle row in Figure 8 provides evidence that viscous forces also influence the dynamics of the inner disk. These images show the gas particles weighted by their dissipation rate ; the inner disk is quite prominent, as is the gas just beyond the inner disk. The latter exhibits a spiral dissipation pattern, implying that angular momentum is being transported radially. One consequence of this viscous coupling may be the gradual decrease in the inclination of the inner disk.
The inner disk of DIR 1:1 C acquired its tilt in a fairly straightforward manner. Some percent of the gas particles in this component came from the galaxy, and the angular momentum of these particles determines the initial orientation of the disk. Some misaligned components in other remnants may be explained in a similar way; in these cases the misaligned material comes preferentially from one progenitor or the other. But the relationship between the originating disk and the final spin direction is not always simple – gravitational and hydrodynamical torques play a large role in determining the final rotation direction of the gas.
4.2 Infall
The simulations cover only the early evolution of these merger remnants; they include the violent dissipative events which form the inner parts of gas disks but end shortly thereafter. On longer time-scales, much of the gas lingering in tidal tails will fall back (Hibbard & Mihos 1995), evolve through loop-like structures, and finally seek out closed orbits. It’s computationally expensive to follow this process much past the stage shown here, but counting the bound tail gas, it appears that the DIRect and RETrograde remnants have enough material to form disks containing up to percent of the total gas, while the POLar and INClined mergers can form disks containing to nearly percent.
The time-scale for this infall is easily estimated in the limit where the tail gas is just barely bound to the remnant. In this limit the tail material moves on nearly radial orbits in an approximately Keplerian potential. Suppose that a tail is formed during a pericentric passage at time . A parcel of tail material with specific binding energy reaches apogalacticon at radius , and falls back at time
| (2) |
In this model there’s a one-to-one relationship between the binding energy distribution of the tail material and the rate at which this material is reaccreted. Let be the differential distribution of binding energy of tail gas; then the reaccretion rate is
| (3) |
As Figure 6 shows, some tails are entirely bound; these fall back completely after a finite time. On the other hand, a tail which extends to generally has a distribution which is approximately constant for . This follows because the tidal interaction has no way to “pick out” the escape energy; thus will be nonzero and continuous near (e.g. White 1987; Jaffe 1987). Thus if some tail gas has enough energy to escape then the reaccretion rate as .
This model gives a crude but serviceable description of the infall of tail material in remnant DIR 1:1 C. Figure 9 shows infall times for particles from the tails created at the first passage (); the horizontal axis is the measured time of infall, while the vertical axis is the time predicted by (2) using specific binding energies determined at time . This comparison was made using collisionless particles from the stellar disks: gas is deflected by shocks, so its exact instant of perigalacticon is harder to define. But both gas and stars travel on nearly ballistic trajectories while in tails, so the rough agreement seen here should also hold for the gas. The scatter between the predicted and measured infall times probably arises because actual orbits are not radial and the true potential is not Keplerian. At later times the simple analytic model should grow more accurate since late-returning material falls back from ever-larger distances. Figure 10 shows the infall rate for gas from the first-passage tails of DIR 1:1 C, predicted using binding energies measured at . Because of the way this sample of tail particles was defined, the infall rate is depressed for . At later times, however, the infall rate evolves almost precisely as . This is consistent with the distribution of binding energies of gas in these tails, which varies by less than percent for .


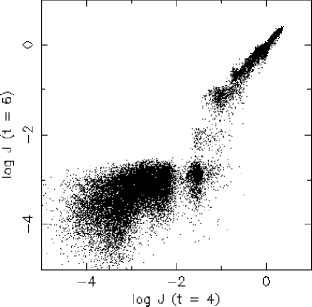
If the infall time of tail gas is basically determined by its specific binding energy , its evolution once it falls back into the remnant depends largely on its specific angular momentum . Studies of disk formation (e.g. Mestel 1963; Fall & Efstathiou 1980) often assume that each parcel of disk material conserves angular momentum during proto-galactic collapse. This can be tested in the simulations; Figure 11 compares specific angular momenta of gas particles at and in remnant DIR 1:1 C. This plot shows two main components: a broad spray of points in the lower left, and a more or less diagonal distribution extending to the upper right. The former is the nucleus, while the latter include the extended disk and tidal tails. The nucleus captures some gas between and , but most of the gas which has enough angular momentum at the time of the merger – say – remains outside the nucleus and approximately conserves the magnitude of its specific angular momentum.
Detailed conservation of angular momentum can be used to predict the radial distribution of the gas at later times. For simplicity, assume that the gas eventually finds circular orbits in the potential of a spherical mass distribution. Then a gas particle’s specific angular momentum and orbital radius are related by
| (4) |
Let be the differential angular momentum distribution of the gas; then the predicted radial distribution in the final disk is
| (5) |
To predict how the disk’s radial profile evolves as infall proceeds, (2) may be used to restrict to only the gas which has fallen in before a given time.

Figure 12 illustrates the prediction of radial coordinates for gas particles in remnant DIR 1:1 C using (4) and the model potential in Appendix A. Three different scatter-plots are presented; in every one the vertical axis shows radii of gas particles which lie in the range at time . In the top plot the horizontal axis shows radii for these particles calculated from (4) using angular momenta measured at ; the points fall almost precisely on the diagonal line, confirming that the gas particles are on nearly circular orbits and that the mass model is adequate. In the middle plot the same equations are used, but the angular momenta are measured at , which is just after the merger. If individual gas particles conserved precisely, this plot would be identical to the top one; the actual distribution is considerably broader, but still more or less straddles the diagonal line. Finally, in the bottom plot the horizontal axis shows the radii measured just after the merger at ; this distribution is broader still and distinctly offset from the diagonal line, showing that significant infall has taken place between and .
In sum, Figure 12 represents a qualified success for this simple model of disk formation by infall from tails. Given a model potential , the radial coordinate of a particle of disk gas can be calculated with some accuracy if its final angular momentum is known. If the angular momentum at an earlier time is given instead, it’s still possible to roughly predict the final radius. Such predictions show some scatter, but they’re better than simply taking radii at the moment of merger as estimates of final radii. The scatter could be reduced if the torques acting on the gas between and were taken into account – but this is beyond the scope of the present model.

Figure 13 illustrates the use of (4) to predict the future growth of the disk in remnant DIR 1:1 C. Here the dotted curve shows the actual radial distribution of all gas particles with at ; this subset includes the disk and some of the infalling tail material. The three solid curves show predicted radial distributions of gas particles with , , and . At radii all particles are on essentially circular orbits and all four curves agree. At larger radii the actual distribution is more extended than the predicted distribution for since outlying gas has not yet had a chance to settle into circular orbits. The distribution predicted for has a fairly sharp break at and essentially vanishes at . This reflects the fact that there is a fairly well-defined ceiling on the angular momenta of gas particles with ; binding energies and angular momenta in tails are correlated, with the less tightly bound tail material having more angular momentum. Gas with has more angular momentum than gas with , and therefore settles at larger radii; gas with settles at larger radii still. Thus the disk will grow from the inside-out, with reaccretion constantly depositing gas at the outer edge of the disk. This can be seen in Figure 8; the top row of images show the radius of the disk increasing with time, and the middle row shows that the periphery of the disk has a high rate of dissipation as infalling material collides with disk gas.
5 DISCUSSION
Gas disks like those described here were briefly reported in earlier simulations of dissipative mergers between disk galaxies (Hernquist & Barnes 1991; Barnes & Hernquist 1996). These studies used the same general methodology as the present work, but differed in several specifics. First of all, in earlier work the thermal evolution of the gas was explicitly computed, including radiative cooling with a cut-off at . This had little consequence for the gas in regions of moderate to high density where cooling times are short; however, the gas tails in the present experiments are broader and smoother since they are not cooled by adiabatic expansion. Second, the earlier studies used King (1966) distributions for the bulges and halos of the initial galaxy models. As a result, these models may have been more susceptible to bar instabilities (Mihos & Hernquist 1996), and their relative orbits decayed appreciably faster (Barnes 1998). Third, the earlier simulations used the TREESPH code (Hernquist & Katz 1989); the code used in the new simulations borrows several features from TREESPH, but it adopts a different smoothing prescription for gravitational forces, a more efficient and robust tree algorithm, a fixed number of neighbors in SPH summations, and a different time-step algorithm. Despite using somewhat different models and codes, these studies all yield broadly similar results; the process of disk formation appears to be insensitive to such details.
Simulations of polar ring formation in galaxy mergers have produced remnants with very large rings or annuli (Bekki 1998). These rings arise from a relatively restricted set of initial conditions which don’t overlap with the ones considered here.
Disk formation is also seen in simulations of hierarchical clustering which include gas as well as cold dark matter (e.g. Evrard, Summers, & Davis 1994; Navarro & Steinmetz 1997; Domínguez-Tenreiro, Tissera, & Sáiz 1998). These disks are generally identified with spiral galaxies, and they form largely from pristine gas which was not previously part of another galaxy. In common with the disks seen in the present experiments, disks formed by hierarchical clustering generally grow from the inside out.
5.1 Origins of counter-rotation
A rather striking result from this study is the large number of remnants with counter-rotating or otherwise misaligned nuclei. In some cases, counter-rotation is easily explained; for example, it’s no great surprise that the RETrograde encounters all produce remnants with counter-rotating components. Likewise, some misaligned components appear to contain gas originating almost exclusively from one of the two progenitors, and it’s likely that such “unblended” structures retain some memory of the orientation of their parent disks. But the origin of the misalignment is not always so evident.
The nuclear disk in remnant POL 1:1 C is a case in point. In terms of overall structure this remnant is very similar to one previously described (Hernquist & Barnes 1991); in both a fairly massive nuclear gas disk counter-rotates with respect to an outer gas disk and stellar component. This resemblance may not seem surprising, since the same initial disk geometry (, , , ) was used in both experiments. But the initial orbit used in the previous study was wider, with a first pericenter at . Of the encounters in the present study, the one with initial conditions most closely matching those used previously is POL 1:1 D, and POL 1:1 D does not yield a counter-rotating nucleus. It’s not clear why this encounter doesn’t produce a counter-rotating nucleus like the one seen in the earlier study, while it’s close relative POL 1:1 C provides a very good match. One possibility is that the halos used in the present study are a bit less effective at promoting orbital decay; as a result, the merging nuclei arrive at their final encounter with slightly more orbital angular momentum than they had in the earlier experiment.
The mechanism which forms counter-rotating nucleus in objects like remnant POL 1:1 C remains obscure. The nucleus of this remnant is already counter-rotating when it forms, and it’s difficult to determine when and how this material first acquired its rotation; angular momentum can only be measured with respect to a center, and before the nucleus forms the system has no unique center. This ambiguity in defining the center could actually be part of the puzzle – material co-rotating with respect to the center as defined in one way may be counter-rotating with respect to the center defined in another. Large-scale hydrodynamic interactions seem to be important; many of the counter-rotating or misaligned nuclei in the present sample form when galaxy pairs arrive at their second passage still dressed in extensive gas disks. A better understanding of the roles of gravitational and hydrodynamic torques in the formation of counter-rotating nuclei may require calculations with higher spatial resolution than available at present.
5.2 Observational connections
The results presented here invite comparisons with observations of gas disks in merger remnants. As mentioned in the introduction, NGC 7252 is an obvious example; the central disk of ionized and molecular gas in this system is about the same size as the disks produced in these experiments, and the peculiar kinematics of this disk may be due to a strong warp of the kind seen in many of these simulations. In addition, HI velocities confirm that gas is falling back into the remnant from the tidal tails (Hibbard et al. 1994). NGC 7252 has been modeled as the result of a close and fairly direct encounter between two disk galaxies of comparable mass (Hibbard & Mihos 1995). This model nicely reproduced the morphology and kinematics of the tails, but the calculations did not include a dissipative component which could form a central disk. It’s worth repeating this calculation with a combined N-body/SPH code; a single model reproducing both the tails and the central disk would be a fairly impressive accomplishment, and might help constrain the gas content of NGC 7252’s progenitors.
The peculiar elliptical galaxy NGC 3656 (Balcells 1997, Balcells et al. 2001) may be a second example. This galaxy contains shells and a pair of faint tails which suggest a merger of two disk galaxies. It also has a star-forming dust lane which corresponds to an extended disk of HI. This disk is visibly warped, and the outer edge of the disk is kinematically contiguous with gas at larger radii which may be falling in from the tidal tails. The estimated gas accretion rate in NGC 3656 is an order of magnitude lower than in NGC 7252; this may imply that NGC 3656 is at a later stage in its evolution than NGC 7252.
NGC 5128, an elliptical galaxy with an active nucleus and an extended disk of dust and gas, may represent an even later stage in the evolution of gas-rich merger remnants. Although the warped disk in this system has been interpreted as the remains of an accreted gas-rich satellite (e.g. Malin, Quinn, & Graham 1983), there are some grounds to suspect that this galaxy is the result of a fairly major merger (e.g. Schweizer 1998). These include the ripples visible in deep optical images (Malin et al. 1983), the HI fragments surrounding the galaxy (Schiminovich et al. 1994), and the misaligned rotation revealed by kinematics of planetary nebulae (Hui et al. 1995).
Nuclear gas disks and rings seem to be very common in merging galaxies selected by infrared luminosity (e.g. Downes & Solomon 1998). In remnants with single nuclei the gas tends to rotate more rapidly than the stars, indicating some degree of kinematic decoupling (Genzel et al. 2001), though it’s not clear if the extreme decoupling in remnant POL 1:1 C has yet been seen in the observations. Disks in systems which appear to still have two nuclei are not so easily explained. Molecular-line observations of Arp 220 and NGC 6240 have been interpreted in terms of a rotating disk located between the nuclei (Scoville, Yun, & Bryant 1997; Tacconi et al. 1999; Tecza et al. 2000). In the simulations, gas driven inward before the galaxies merge always accumulates in disks or bars around the individual nuclei; moreover, an incipient disk between the nuclei would be torn apart by gravitational fields as the orbits of the nuclei decay. An inter-nuclear disk might be stable if it was more massive than either nucleus (Tecza et al. 2000), but the amount of gas required seems quite extravagant, and earlier reports of a peak in the stellar velocity dispersion between the nuclei of NGC 6240 (Lester & Gaffney 1994; Doyon et al. 1994) are not supported by recent HST observations (Gerssen et al. 2001). On the other hand, the interpretation of Arp 220’s nuclei as bright spots in “a warped molecular gas disk” (Eckart & Downes 2001; Downes & Solomon 1998) seems entirely consistent with the present numerical results.
5.3 Galaxy transformation
Simulations indicate that extended gas disks can form in mergers of spiral galaxies. These disks contain between and percent of the total gas in the initial galaxies, and may extend to several times the remnant half-light radii. It’s worth noting that the initial galaxy models used in these experiments were not particularly gas-rich, and that the gas started with the same distribution as the disk stars. In real spiral galaxies the atomic gas is more extended than the stars; mergers of such systems should form remnants with even larger and more massive gas disks. Moreover, the gas content of disk galaxies is generally expected to increase with redshift; remnants with disks containing to percent of their luminous mass would very likely result by doubling the gas fraction in the initial galaxy models.
These disks, if subsequently converted to stars, would be fairly hard to detect photometrically (Rix & White 1990) unless viewed from a favorable orientation (e.g. Scorza & Bender 1990). On the other hand, disks could significantly influence the observed kinematics of merger remnants. Disks are kinematically cold, so stars formed in such disks would add narrow features to the stellar absorption-line spectra of early-type galaxies. Moreover, disks rotate faster than pressure-supported components, so these narrow features will be systematically offset from the broader profiles due to the rest of the galaxy. The combined velocity profile of a disk plus spheroid thus appears asymmetric, with a steep prograde wing and a shallow retrograde wing (e.g. Franx & Illingworth 1988; Bender 1990; Rix & White 1992; van der Marel & Franx 1993). Such profiles actually appear to be fairly typical in elliptical galaxies with measurable rotation (Bender, Saglia, & Gerhard 1994).
The observed velocity profiles may be compared with those predicted for remnants of purely dissipationless mergers between disk galaxies (Bendo & Barnes 2000, Naab & Burkert 2001). As a rule, simulated equal-mass mergers produce remnants with the opposite velocity profile asymmetry – that is, they have shallow prograde wings and steep retrograde wings. For unequal-mass mergers the situation is not so clear – one study finds profiles similar to those produced in equal-mass mergers, while the other reports cases which exhibit the same sense of asymmetry seen in observations of early-type galaxies. Naab & Burkert (2001) suggested that the formation of extended disks is necessary if mergers are to account for the observed kinematics of elliptical galaxies, but worried that the gas might not retain enough angular momentum to build extended disks. Given the contradictory results on unequal-mass mergers, it may be premature to insist that all mergers must form disks. On the other hand, the present work indicates that disks of the requisite size can form quite easily in both equal-mass and unequal-mass mergers.
If the above explanation for line profiles in elliptical galaxies is correct, one might expect different spectral lines to show different kinematic signatures. The lines produced by the younger stars making up a disk should be narrower than, and systematically offset from, the lines produced by the older stars in the spheroid. This might be tested with high signal-to-noise spectra obtained using large optical telescopes.
ACKNOWLEDGMENTS
I thank the referee, A. Burkert, for a constructive report, and M. Balcells, L. Hernquist, J. Hibbard, D. Sanders, and F. Schweizer for valuable discussions. This work was supported in part by STScI grant GO-06430.03-95A.
Appendix A REMNANT POTENTIAL
A simple model of the potential may be constructed using a Plummer model to represent the nucleus and a Hernquist model to represent the rest of the remnant:
| (6) |
For remnant DIR 1:1 C, I took to be the mass within , to be the “softened” radius of the nucleus, to be the mass of the rest of the remnant, and to be the radius enclosing a quarter of the remnant’s mass exclusive of the nucleus.
References
- [] Balcells, M. 1997, ApJ 486, L87
- [] Balcells, M., van Gorkom, J.H., Sancisi, R., del Burgo, C. 2001, astro-ph/0107165
- [] Barnes, J.E. 1988, ApJ 331, 699
- [] Barnes, J.E. 1992, ApJ 393, 484
- [] Barnes, J.E. & Hernquist, L. 1991, ApJ 370, L65
- [] Barnes, J.E. & Hernquist, L. 1996, ApJ 471, 115
- [] Barnes, J.E. 1998, Galaxies: Interactions and Induced Star Formation, eds. D. Friedli, L. Martinet, D. Pfenniger (Springer-Verlag: Berlin), p. 275
- [1] Bate, M.R. & Burkert 1997, MNRAS 288, 1060
- [2] Bekki, K. 1998, ApJ 499, 635
- [] Bender, R. 1990, A&A 229, 441
- [] Bender, R., Saglia, R.P., & Gerhard, O.E. 1994, MNRAS 269, 785
- [] Bendo, G.J. & Barnes, J.E. 2000, MNRAS 316, 315
- [] Combes, F, Dupraz, C., & Gerin, M. 1990 Dynamics and Interactions of Galaxies, ed. R. Wielen (Springer-Verlag: Berlin), p. 205
- [] Condon, J.J., Helou, G., Sanders, D.B., & Soifer, B.T. 1993, AJ 105, 1730
- [] Dehnen, W. 1993, MNRAS 265, 250
- [] Domínguez-Tenreiro, R., Tissera, P.B., & Sáiz, A. 1998, ApJ 508, L123
- [] Downes, D. & Solomon, P.M. 1998, ApJ 507, 615
- [3] Doyon, R., Wells, M., Wright, G.S., Joseph, R.D., Nadeau, D., & James, P.A. 1994, ApJ 437, 23
- [4] Dupraz, C., Casoli, F., Combes, F., & Kazes, I., A&A 228, L5
- [] Eckart, A. & Downes, D. 2001, ApJ 551, 730
- [] Evrard, A.E., Summers, F.J., & Davis, M. 1994, ApJ 422, 11
- [] Fall, S.M. & Efstathiou, G. 1980, MNRAS 193, 189
- [] Franx, M. & Illingworth, G.D. 1988, ApJ 327, L55
- [] Freeman, K.C. 1970, ApJ 160, 811
- [] Genzel, R., Tacconi, L.J., Rigopoulou, D., Lutz, D., & Tecza, M. 2001, astro-ph/0106032
- [] Gerritsen, J.P.E. & Icke, V. 1997, A&A 325, 972
- [] Gerssen, J., van der Marel, R.P., Axon, D., Mihos, C., Hernquist, L., & Barnes, J.E. 2001, The Central kpc of Starbursts and AGN, ed. J.H. Knapen, J.E. Beckman, I. Shlosman, & T.J. Mahoney (PASP: San Francisco), in press
- [] Hernquist, L. 1989, Nature 340, 687
- [] Hernquist, L. 1990, ApJ 356, 359
- [] Hernquist, L. 1993, ApJS 86, 389
- [] Hernquist, L. & Barnes, J.E. 1991, Nature 354, 210
- [] Hernquist, L. & Katz, N. 1989, ApJS 70, 419
- [] Hibbard, J.E., Guhathakurta, P., van Gorkom, J.H., Schweizer, F. 1994, AJ 107, 67
- [] Hibbard, J.E. & Mihos, J.C. 1995, AJ 110, 140
- [] Hibbard, J.E., Vacca, W.D., & Yun, M.S. 2000, AJ 119, 1130
- [] Himmard, J.E., van der Hulst, J.M., Barnes, J.E., & Rich, R.M. 2001, AJ 122, in press.
- [] Hui, X., Ford, H.C., Freeman, K.C., & Dopita, M.A. 1995, ApJ 449, 592
- [] Jaffe, W. 1987, Structure and Dynamics of Elliptical Galaxies, ed. T. de Zeeuw (D. Reidel: Dordrecht), p. 511
- [] Joseph, R.D. & Wright, G.S. 1985, MNRAS 214, 87
- [] Katz, N. 1992, ApJ 391, 502
- [] King, I.R. 1966, AJ 71, 64
- [] Kormendy, J. & Sanders, D.B. 1992, ApJ 390, L53
- [] Larson, R.B. & Tinsley, B.M. 1978, ApJ 219, 46
- [] Lester, D.F. & Gaffney, N.I. 1994, ApJ 431, L13
- [] Malin, D.F., Quinn, P.J., & Graham, J.A. 1983, ApJ 272, L5
- [] Mestel, L. 1963, MNRAS 126, 553
- [] Mihos, J.C. 2001, ApJ 550, 94
- [] Mihos, J.C. & Hernquist, L. 1994, ApJ 437, 611
- [] Mihos, J.C. & Hernquist, L. 1996, ApJ 464, 641
- [] Monaghan, J.J. 1992, ARA&A 30, 543
- [] Naab, T. & Burkert, A. 2001, astro-ph/0103476
- [] Navarro, J.F. & Steinmetz, M. 1997, ApJ 478, 13
- [] Negroponte, J. & White, S.D.M. 1983, MNRAS 205, 1009
- [] Noguchi, M. 1988, A&A 203, 259
- [] Rix, H.-W. & White, S.D.M. 1990, MNRAS 254, 389
- [] Rix, H.-W. & White, S.D.M. 1992, ApJ 362, 52
- [] Sanders, D.B. & Mirabel, I.F. 1996, ARA&A 34, 749
- [] Schiminovich, D., van Gorkom, J.H., van der Hulst, J.M., & Kasow, S. 1994, ApJ 423, L101
- [] Schweizer, F. 1982, ApJ 252, 455
- [] Schweizer, F. 1998, Galaxies: Interactions and Induced Star Formation, eds. D. Friedli, L. Martinet, D. Pfenniger (Springer-Verlag: Berlin), p. 105
- [] Scorza, C. & Bender, R. 1990, A&A 235, 49
- [] Scoville, N.Z., Yun, M.S., & Bryant, P.M. 1997, ApJ 484, 702
- [] Spitzer, L. 1942, ApJ 95, 329
- [] Springel, V. 2000, MNRAS 312, 859
- [] Tacconi, L.J., Genzel, R., Tecza, M., Gallimore, J.F., Downes, D., & Scoville, N.Z. 1999, ApJ 524, 732
- [] Tecza, M., Genzel, R., Tacconi, L.J., Anders, S., Tacconi-Garman, L.E., & Thatte, N. 2000, ApJ 537, 178
- [] Toomre, A. 1964, ApJ 139, 1217
- [] Toomre, A. 1977, The Evolution of Galaxies and Stellar Populations, eds. B. Tinsley & R. Larson (Yale University Obs.: New Haven), p. 401
- [] Toomre, A. & Toomre, J. 1972, ApJ 178, 623
- [] Tremaine, S., Richstone, D.O., Byun, Y.-I., Dressler, A., Faber, S.M., Grillmair, C., Kormendy, J., Lauer, T.R. 1994, AJ 107, 634
- [] Tsuchiya, T., Korchagin, V., & Wada, K. 1998, ApJ 505, 607
- [5] van der Marel, R.P. & Franx, M. 1993, ApJ 407, 525
- [] White, S.D.M. 1987, Structure and Dynamics of Elliptical Galaxies, ed. T. de Zeeuw (D. Reidel: Dordrecht), p. 339
- [] Whitmore, B.C., Schweizer, F., Leitherer, C., Borne, K., & Robert, C. 1993, AJ 106, 1354