The Mass Function of Field Galaxies at as Derived from the MUNICS -Selected Sample 11institutetext: Universitäts-Sternwarte München, Scheinerstr. 1,D-81679 München, Germany 22institutetext: University of Texas at Austin, Austin, Texas 78712, USA 33institutetext: Instituto Astronômico e Geofísico, Av Miguel Stéfano 4200, 04301-904, São Paulo, Brazil
The Mass Function of Field Galaxies at as Derived from the MUNICS -Selected Sample
Abstract
We derive the number density evolution of massive field galaxies in the redshift range using the -band selected field galaxy sample from the Munich Near-IR Cluster Survey (MUNICS). We rely on spectroscopically calibrated photometric redshifts to determine distances and absolute magnitudes in the rest-frame -band. To assign mass-to-light ratios, we use two different approaches. First, we use an approach which maximizes the stellar mass for any -band luminosity at any redshift. We take the mass-to-light ratio, , of a Simple Stellar Population (SSP) which is as old as the universe at the galaxy’s redshift as a likely upper limit. Second, we assign each galaxy a mass-to-light ratio by fitting the galaxy’s colours against a grid of composite stellar population models and taking their . We compute the number density of galaxies more massive than , , and , finding that the integrated stellar mass function is roughly constant for the lowest mass limit and that it decreases with redshift by a factor of and by a factor of for the two higher mass limits, respectively. This finding is in qualitative agreement with models of hierarchical galaxy formation, which predict that the number density of objects is fairly constant while it decreases faster for more massive systems over the redshift range our data probe.
1 Introduction
The traditional observables used to characterise galaxies are unsuitable for studying the assembly history of galaxies, one of the most fundamental predictions of CDM models, since these observables may be transient. The best observable for this aim is, in principle, total mass, which is on the other hand very hard to measure. It has been argued that the best available surrogate accessible to direct observation is the near-IR -band luminosity of a galaxy which reflects the mass of the underlying stellar population and is least sensitive to bursts of star formation and dust extinction (Rix & Rieke, 1993; Kauffmann & Charlot, 1998; Brinchmann & Ellis, 2000). The main uncertainty involved in the conversion of -band light to mass is due to the age of the population, amounting to only a factor of two in mass uncertainty for populations older than Gyr.
The galaxy sample used here is a subsample of the MUNICS survey, selected for best photometric homogeneity, good seeing, and similar depth. Furthermore, in each of the remaining survey patches, areas close to the image borders in any passband, areas around bright stars, and regions suffering from blooming are excluded. The subsample covers 0.27 square degrees in (23.5), (23.5), (22.5), (21.5), and (19.5); the magnitudes are in the Vega system and refer to 50% completeness for point sources.
The final catalog covers an area of 997.7 square arc minutes and contains 5132 galaxies. The fields included in this analysis are S2, S3f5–8, S5, S6, and S7f5–8. See Table 1 in Drory et al. (2001b) for nomenclature and further information on the survey fields.
The distances to the galaxies are derived using spectroscopically calibrated photometric redshifts. A comparison of spectroscopic and photometric redshifts is shown in Drory et al. (2001a).
We derive stellar masses by converting rest-frame -band luminosities to mass using two different approaches to model the mass-to-light ratios of the galaxies. We discuss the resulting integrated stellar mass functions at different mass limits and their evolution with redshift.
We assume , throughout this work. We write Hubble’s Constant as , using unless the quantities in question can be written in a form explicitly depending on .
2 The maximum PLE model
The integrated stellar mass function , the comoving number density of objects having stellar mass exceeding , is computed using the formalism as desctibed in Drory et al. (2001a).
To compute the stellar mass of a galaxy, we first use an approach which maximises the stellar mass for any -band luminosity at any redshift.
Noting that is a monotonically rising function of age for Simple Stellar Populations (SSPs), we find that the likely upper limit for is the mass-to-light ratio of a SSP which is as old as the universe at the galaxy’s redshift. This is the most extreme case of passive luminosity evolution (PLE) one can adopt. It corresponds to a situation where all massive galaxies would be of either elliptical, S0, or Sa type.
We take the mass-to-light ratios from the SSP models published by Maraston (1998), using a Salpeter IMF. Similar dependencies on age are obtained from the models of Worthey (1994) and Bruzual & Charlot (1993) although the absolute values of vary somewhat, partly due to differences in the models themselves but mostly due to the way stellar remnants are treated by the different authors.
The resulting integrated mass functions for , , and are shown in Fig. 2 along with the integrated luminosity functions for comparison.
The mean values of in the maximum PLE model in the four redshift bins are , , , and , as computed from the look-back time in our cosmology. With these mean values the mass limits correspond to absolute -band magnitudes of , , , and , respectively, for . For the numbers are , , , and . Finally, for we have , , , and (magnitudes with respect to ).
The upper and middle panels of Fig. 2 compare the evolution of the integrated luminosity to the integrated mass. It is evident that the number density of luminous -band selected galaxies does not evolve significantly (given our uncertainties) to . However, because of the inevitable evolution of the mass-to-light ratio with , the number density of massive systems does change. Transforming luminosities into masses with our maximum PLE scheme yields a roughly constant number density for our lowest mass limit, , and a decrease of the number density with redshift by a factor of for a mass limit of , and by a factor for objects more massive than . As the true at high redshift will most likely be lower than in our maximum PLE model, the true number densities are likely to decrease more rapidly with redshift.
The steepening of the curves with increasing limiting mass in the maximum PLE models (despite them all having the same mass-to-light ratios at any given redshift) is due to the invariance of the LF with redshift and its steepness at the bright end. At increasing limiting mass, one is moving down the steepening bright end of the LF, so that the same change in the mass-to-light ratio yields a higher change in the number density.
To investigate the effect the uncertainties in the photometric redshifts have on the values of the integrated mass function, we have performed Monte-Carlo simulations. The errors of the mean values of the integrated mass function (size of open symbols in Fig. 2) are derived by repeating the mass function analysis using subsamples of the template SED library, as deficiencies in the templates are the main source of concern for the accuracy of the redshifts during the photometric redshift determination.
3 The fitted mass-to-light-ratio model
To obtain a more realistic estimate of , we used our VRIJK color information and the photometric redshift to fit the age and SFR of each galaxy using a grid of composite stellar populations (CSP) with 9 exponential star formation timescales, , ranging from 0.1 to 10 Gyr with spectra extracted for 28 ages, , between 0.04 Gyr and 15 Gyr for each . The input SSPs for constructing the composite stellar populations models are taken from Maraston (2002), again using Salpeter IMF.
Fig. 1 shows the evolution of the -band mass-to-light ratios as a function of age for each value of in the grid. Except for the two largest values of , the slope at ages Gyr is remarkably independent of the actual star formation timescale. Moreover, the slope of the time evolution of is the same even for the shortest value of , 0.1 Gyr, which essentially represents an SSP. Let aside normalisation effects, we therefore may expect a similar result for the mass function as obtained with the PLE model.


The average -band mass-to-light ratio of the galaxy population determined by applying this fitting procedure is shown in Fig. 1. The figure also shows the PLE mass-to-light ratio as a function of . Apart from the different normalisation, the evolution with redshift is very similar, a consequence of the insensitivity of on the star formation history.
Finally, the lower panel of Fig.2 shows the integrated mass function for the same mass limits as those applied above, using the individually fitted values.
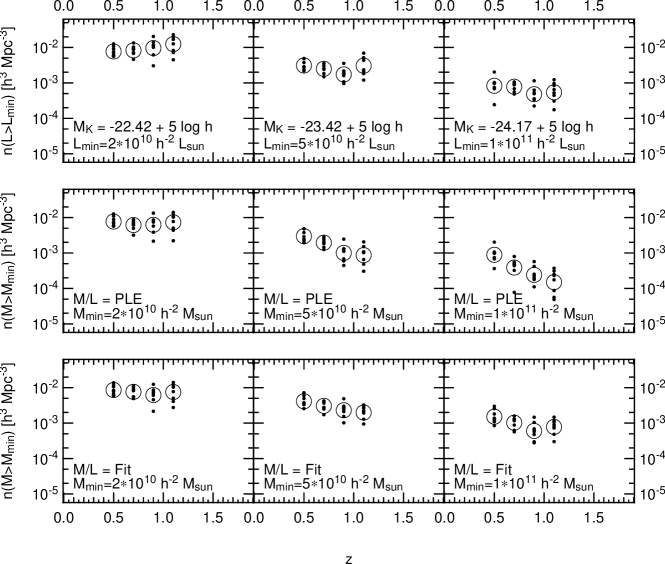
The most striking feature of Fig. 2 is the similarity of the maximum PLE and the CSP-fitted curves. Note that there is a difference in the normalisation of the two, and due to the log scaling of the figure, the slope appears to be different in the plot.
If star formation played an important role at , the presence of young populations would have pushed down, and therefore the CSP-fitted curves would be expected to be steeper than the maximum PLE curve, which assumes no star formation happens at all after .
Nevertheless, the number density of massive systems seems to decline, with this decline being stronger for more massive systems, and therefore one is inclined to think that merging does play an important role. Indeed, Le Fèvre et al. (2000) derive a number of 0.6 to 1.8 major mergers per galaxy since from HST-based pair counts of galaxies with known redshifts selected from the CFRS. We observe a decline in the number density by a factor of for somewhat more massive systems, and almost no significant density evolution at .
Therefore, we are inclined to think that if merging is the dominant factor in increasing the mass of these -selected massive galaxies, most of the merging has to be dissipationless, involving rather low star formation activity.
The main uncertainty in these conclusions is still the field to field variation, in spite of the relatively large area surveyed, followed by the choice of SED templates used in the photometric redshift code (see above). The size of the open symbols in Fig. 2 represents our estimate of the total uncertainty of the mean values. If we assume a Gould IMF (Gould et al., 1998) instead of a Salpeter IMF, the evolving curve becomes lower in its normalization as the mass-to-light ratio becomes smaller due to the reduced number of low-mass stars. The slope does not change significantly.
The observed density evolution as a function of mass is qualitatively consistent with the expectation from hierarchical galaxy formation models. Most rapid evolution is predicted for the number density of the most massive galaxies while the number density of -galaxies should evolve much less. E.g. Baugh et al. (1998) predict that the number density of galaxies of a stellar mass of decreases by a factor of over redshift range (for the cosmological parameters as used here). Though this agreement is encouraging, both more elaborated models and improved sets of data are required. The latter can be obtained by larger and deeper samples, and more realistic estimates of based on spectroscopic observations of the galaxies..
Acknowledgments
We would like to thank the Calar Alto staff for their long-standing support. This work was partly supported by the Deutsche Forschungsgemeinschaft, grant SFB 375 “Astroteilchenphysik” and the German Federal Ministry of Education and Research (BMBF), grant 05 AV9WM1/2.
References
- Baugh et al. (1998) Baugh, C. M., Cole, S., Frenk, C. S., & Lacey, C. G. 1998, ApJ, 498, 504
- Brinchmann & Ellis (2000) Brinchmann, J., & Ellis, R. S. 2000, ApJ, 536, L77
- Bruzual & Charlot (1993) Bruzual, G. A., & Charlot, S. 1993, ApJ, 405, 538
- Drory et al. (2001a) Drory, N., Bender, R., Snigula, J., Feulner, G., Hopp, U., Maraston, C., Hill, G. J., & de Oliveira, C. M. 2001a, ApJ, 562, L111
- Drory et al. (2001b) Drory, N., Feulner, G., Bender, R., Botzler, C. S., Hopp, U., Maraston, C., Mendes de Oliveira, C., & Snigula, J. 2001b, MNRAS, 325, 550
- Gould et al. (1998) Gould, A., Flynn, C., & Bahcall, J. N. 1998, ApJ, 503, 798
- Kauffmann & Charlot (1998) Kauffmann, G., & Charlot, S. 1998, MNRAS, 297, L23
- Le Fèvre et al. (2000) Le Fèvre, O., et al. 2000, MNRAS, 311, 565
- Maraston (1998) Maraston, C. 1998, MNRAS, 300, 872
- Maraston (2002) Maraston, C. 2002, MNRAS, submitted
- Rix & Rieke (1993) Rix, H., & Rieke, M. J. 1993, ApJ, 418, 123
- Worthey (1994) Worthey, G. 1994, ApJS, 95, 107