Detecting planets in protoplanetary disks: A prospective study
Abstract
We investigate the possibility to find evidence for planets in circumstellar disks by infrared and submillimeter interferometry. We present simulations of a circumstellar disk around a solar-type star with an embedded planet of 1 Jupiter mass. The three-dimensional (3D) density structure of the disk results from hydrodynamical simulations. On the basis of 3D radiative transfer simulations, images of this system were calculated. The intensity maps provide the basis for the simulation of the interferometers VLTI (equipped with the mid-infrared instrument MIDI) and ALMA. While MIDI/VLTI will not provide the possibility to distinguish between disks with or without a gap on the basis of visibility measurements, ALMA will provide the necessary basis for a direct gap detection.
1 Introduction
Based on studies of the evolution of protoplanets in protoplanetary disks, it has been established that - depending on the hydrodynamic properties of the planet and the disk - giant protoplanets may open a gap and cause spiral density waves in the disk (see, e.g., Kley 1999, Kley et al. 2001). The gap may extend up to several AU in width. Thus, the question arises if one can find such a gap as an indicator for the presence of a protoplanet with present-day or near-future techniques. In order to study this possibility, we use hydrodynamical simulations of a protoplanetary disk with an embedded planet (§ 2) and compute the expected brightness distributions, with a 3D radiative transfer code (§ 3). The resulting images are presented in § 4. Finally, we show that ALMA will provide the necessary basis to detect gaps in circumstellar disks in the mm/submm wavelength range (§ 5).
2 The disk model
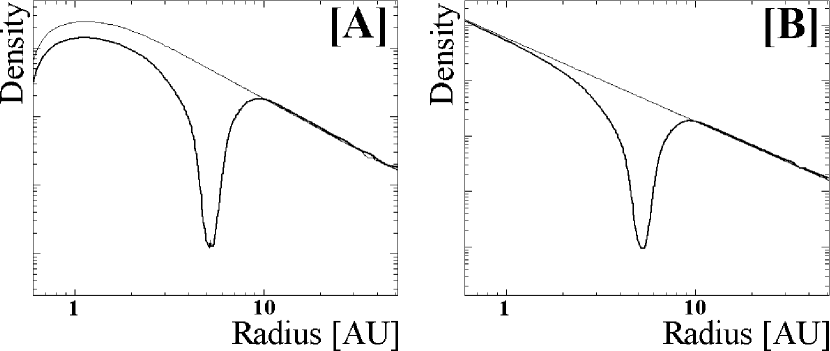
The density structure of the protoplanetary disk – on which the subsequent radiative transfer (RT) simulations and discussions are based on – results from hydrodynamical simulations in which the disk is assumed to be flat and non-self-gravitating. The mutual gravitational interaction between the planet and the central star, and the gravitational torques of the disk acting on planet and star are included. The 3D density structure is Gaussian in the vertical direction where for the scale height H(r) we assume a constant ratio H/r=0.05. The radial density profile of the disk is shown in Fig. 1[A].
The mass of the star is assumed to be 1 , the mass of the planet is 1 Jupiter mass, and the mass of the disk is . For the dust-to-gas mass ratio we take the classical value of 1:100. The diameter of the disk is 104 AU which is comparable to the size of the disks seen in silhouette against the Orion Nebula (McCaughrean & O’Dell 1996). The planet is located at a distance of 5.2 AU from the star. The structure of the spirals and the gap reaches an equilibrium after about 150 orbits (). The specifics of the models and the results, in particular the width and internal structure of the gap, are described in detail in Kley (1999) and Kley et al. (2001).
3 Radiative transfer simulations
We used the results from the hydrodynamical simulations to calculate the dust continuum emission. The RT has been performed with a 3D continuum code which is based on the Monte Carlo method. The RT is simulated self-consistently, taking into account both the initial temperature of the dust due to viscous heating and the additional energy input of the central star. The dust density and temperature structure are defined on a grid which is chosen to be identical with that of the hydrodynamical simulations. Thus, any additional discretization error resulting from the “transfer” of the density/temperature structure to the RT code is avoided. For further information concerning the RT code, we refer to Wolf et al. (1999) and Wolf & Henning (2000).
In addition to the results from the hydrodynamical simulations, we introduce the following RT parameters: spherical dust grains consisting of “astronomical” silicates (optical data from Draine & Lee 1984, radius 0.12 m); star: effective temperature K, luminosity ; wavelength range for the simulation of the radiative transfer: m. We should note that the resulting temperature structure of the disk is in good agreement with the temperature distribution resulting from 2D hydrodynamical disk models with the same geometry.
4 Images
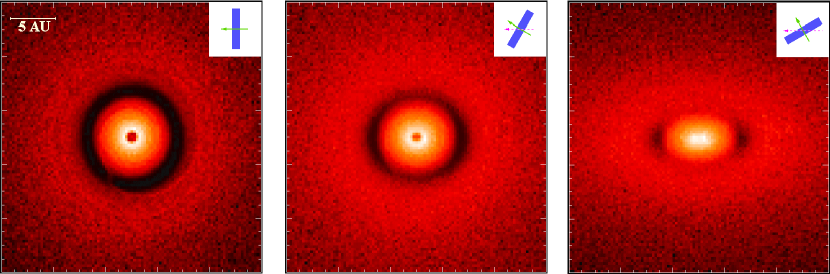
In Figure 2, the images of the inner region (diameter 28 AU) of the disk, seen under different inclination angles ( - face-on, , and ), at =700 m are shown. Assuming a distance of 140 pc of the object (which is the distance to the nearby star-forming region in Taurus), the pixel scale is 2 mas/pixel. The gap can be clearly seen – even in the case of large inclinations of the disk. The spiral density waves – which are also caused by the motion of the planet – are difficult to trace.
Due to the huge intensity peak caused by warm/hot dust located very close to the star (12 AU), the outer regions of the disk remain dark at near/mid-infrared wavelengths. The gap located at 5 AU can be hardly seen. In contrast to this, in the sub-millimetre/millimetre wavelength range the brightness distribution is much smoother. This can be explained by the behaviour of the Planck function . The ratio () strongly decreases with increasing wavelength. Thus, the flux ratio and the brightness contrast between regions characterized by different dust temperatures ( and ) decreases with increasing wavelength .
5 Simulations of observations with MIDI (VLTI) and ALMA

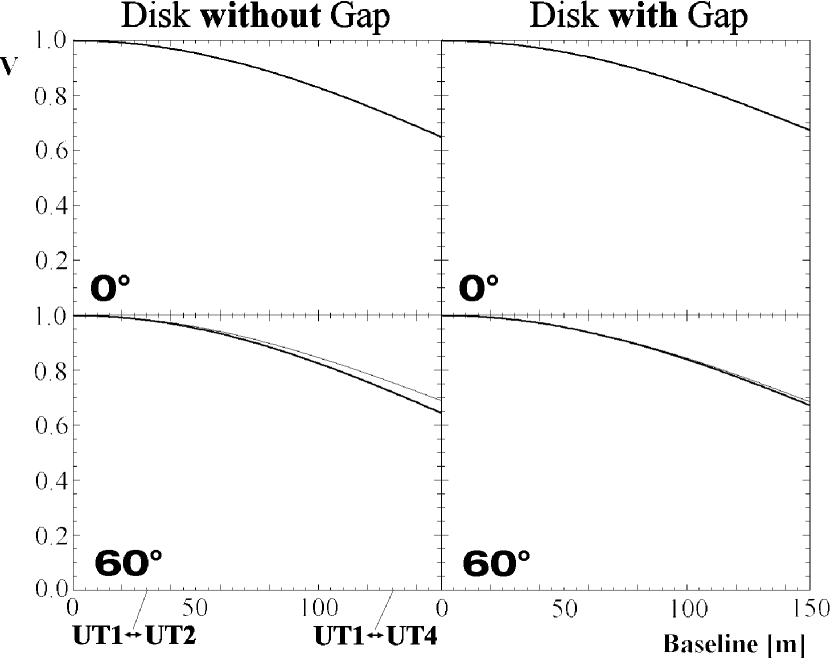
In Figure 3 visibility curves at =10 m for two different inclinations of the disk are shown (with/without gap). The goal of these simulations is to check whether MIDI at the VLTI can be used to detect gaps. In order to avoid sampling problems in the image plane which could affect the calculation of the visibilities, the resolution of the images had to be increased by a factor of 4 along each coordinate axis (compared to Figure 2). It was found that the visibilities at a given baseline differ by less than 5%. This is due to the fact that the density distribution in the innermost region – which dominates the 10 m flux – is only negligibly affected by the presence of the planet at a distance of 5.2 AU. Taking into account uncertainties of “real” measurements (e.g. with MIDI - the mid-infrared interferometric instrument for the VLTI), a distinction between different disk models (with/without gap) based on significant differences between the visibility profiles is not possible even by a beam combination of the most distant telescopes of the VLTI. To demonstrate the influence of the particular density profile of the disk, in Fig. 4 the visibilities of a disk, with the same parameters as described in § 2 but without accretion onto the central star, are shown (see Fig. 1[B] for the radial density profile). While again the presence of a gap has almost no influence on the visibility, the visibility profile is flatter compared to the visibilities shown in Fig. 3. Thus, one could clearly distinguish a disk with accretion from a disk without.
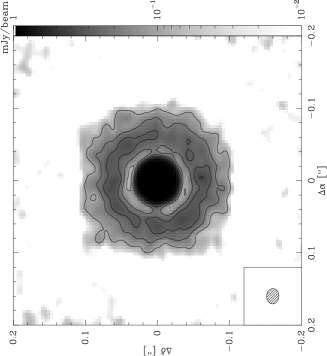
In contrast to a two-beam interferometer such as MIDI at the VLTI, ALMA (Atacama Large Millimeter Array) will combine signals of 64 antennas with an aspired maximum baseline of 12 to 14 km. It will cover the submm/mm wavelength range (=30900 GHz). Due to the large number of receivers and the resulting broad distribution of baselines, a sufficient u-v plane coverage can be achieved after a few hours of observation and image reconstruction will be possible. In addition, and in contrast to the first instruments at the VLTI, the visibility phase can be easily measured in the millimetre wavelength range. In Figure 5 a reconstructed image of the disk based on a simulation of ALMA observations is shown (disk seen face-on, =700 m). Even under consideration of the thermal noise caused by a system temperature of =500 K, the gap is clearly visible.
6 Conclusions
Based on hydrodynamical simulations and subsequent 3D continuum RT calculations we generated millimetre images of a circumstellar disk with an embedded planet surrounding a solar-type star. The gap can be seen very clearly in the simulated images but an extremely high angular resolution is required ( 10 mas). Because of the extreme brightness contrast in the innermost region of the disk in the near to mid-infrared, the gap can hardly be detected in this wavelength range with imaging/interferometric observations.
We found that it will be possible to distinguish between a disk with or without accretion onto the central star with MIDI, but the visibility at 10 m is almost insensitive to the presence of a gap. In contrast to this, the millimetre interferometer ALMA which will become available in the near future will achieve this goal: it will provide the basis for the reconstruction of an image of a gap. Thus, the search for massive protoplanets in circumstellar disks can be based on the indication of a gap. For this purpose, the longest possible baselines are required.
References
- Draine & Lee (1984) Draine, B.T., Lee, H.M., 1984, ApJ, 285, 89
- Kley (1999) Kley, W., 1999, MNRAS, 303, 696
- Kley et al. (2001) Kley, W., D’Angelo, G., Henning, Th., 2001, ApJ, 547, 457
- McCaughrean & O’Dell (1996) McCaughrean, M.J., O’Dell, C.R., 1996, ApJ, 111, 1977
- Wolf & Henning (2000) Wolf, S., Henning, Th., 2000, Comp. Phys. Comm. 132, 166
- Wolf et al. (2000) Wolf, S., Henning, Th., Stecklum, B., 1999, A&A, 349, 839