Variation of Spot-induced Anomalies in Caustic-crossing Binary Microlensing Event Light Curves
Abstract
We investigate the pattern of anomalies in the light curves of caustic-crossing binary microlensing events induced by spot(s) on the lensed source star. For this purpose, we perform simulations of events with various models of spots. From these simulations, we find that the spot-induced anomalies take various forms depending on the physical state of spots, which is characterized by the surface brightness contrast, the size, the number, the umbra/penumbra structure, the shape, and the orientation with respect to the sweeping caustic. We also examine the feasibility of distinguishing the two possibly degenerate types of anomalies caused by a spot and a transiting planet and find that the degeneracy in many cases can be broken from the characteristic multiple deviation feature in the spot-induced anomaly pattern caused by the multiplicity of spots.
keywords:
stars: activity – binaries: general – gravitational lensing1 Introduction
Microlensing experiments (MACHO: Alcock et al. 1993; EROS: Aubourg 1993) were originally proposed to search for Galactic dark matter in the form of massive compact halo objects by monitoring lensing-induced light variations of stars located in the Large Magellanic Cloud (Paczyński 1986). Besides this original goal, it was demonstrated that microlensing can also be applied to other fields of astronomy, especially stellar astrophysics (see the recent review of Gould 2001). Over the last decade, this aspect of microlensing achieved important progress thanks partially to the theoretical studies on various methods to extract additional information about lensed source stars and more importantly to the large number of event detections from additional experiments directed towards the Galactic bulge (OGLE: Udalski et al. 1993; DUO: Alard & Guibert 1997) and detailed light curves of events obtained from intensive followup observations (PLANET: Albrow et al. 1998; GMAN: Alcock et al. 1997; MPS: Rhie et al. 1999; MOA: Bond et al. 2001).
One of the lensing applications to stellar astrophysics is the detection and characterization of stellar spots. Spot detection via microlensing is possible for high magnification events produced by the source’s crossing of the lens caustic, which refers to the source position on which the magnification of a point source event becomes infinity. For these events, one can resolve the source star surface because different parts of the source is magnified by different amounts due to the large gradient of magnification over the source during the caustic crossing (Gould 1994; Nemiroff & Wickramasinghe 1994; Witt & Mao 1994). For a single lens, the location of the caustic is that of the lens itself (point caustic). For a binary lens, the set of caustics forms closed curves in which each curve is composed of three or more concave line segments (fold caustic) that meet at cusps. Heyrovský & Sasselov (2000) first investigated the possibility of lensing spot detections and showed that, for point-caustic-crossing single lens events, spots can cause fractional deviations in magnification larger than 2 %, which are detectable from followup observations. Han et al. (2000) further investigated the possibility of detecting stellar spots from the observations of fold-caustic-crossing binary lens events and showed that the fractional deviations are comparable to those of point-caustic-crossing events. However, these works were concentrated only on the possibility of spot detections, and thus no detailed investigation about the various forms of spot-induced anomalies in lensing light curves has been done. Bryce & Hendry (2000) mentioned some of the variations in their unpublished paper, but these analysis was only for point-caustic-crossing events, which are much less common than fold-caustic-crossing events. In addition, the previous studies are based on very simplified assumptions of spots and their host stars, e.g. a circular spot with a uniform surface brightness on also a uniform background stellar surface. Therefore, extensive study about the microlensing signature of stellar spots for caustic-crossing binary lens events based on realistic models of spots and host stars is required.
Another reason for the necessity of studying spot-induced light curve deviations was recently raised by Lewis (2001). He pointed out that if a source star possessing a planet is microlensed when the planet is transiting the source star surface, the resulting light curve will have similar deformation to those induced by a spot. Then, unless one can distinguish the two types of deviations, analyses based on one naively adopted assumption for the cause of the deviation might result in false information about the source star.
In this paper, by performing realistic simulations of microlensing light curves of events occurred on spotted source stars, we investigate how the pattern of the spot-induced anomalies in lensing light curves varies for different states of spots. Based on the results of this investigation, we also examine the feasibility of distinguishing the two types of anomalies caused by a spot and a transiting planet.
The paper is organized as follows. In § 2, we describe the basics of microlensing, which are required to describe the lensing behavior of caustic-crossing binary lens events occurred on spotted source stars. In § 3, by simulating lensing events occurred on source stars with various states of spots, we investigate the dependencies of the spot-induced anomaly pattern on various spot parameters, which characterize the physical state of spots. In § 4, we discuss the features of the spot-induced anomalies that can be used to distinguish the spot-induced anomalies from those caused by a transiting planet. We conclude in § 5.
2 Basics of Microlensing
If a point source located at on the projected plane of the sky is lensed by a binary lens system, where the individual lens components have masses of and projected locations of ( and 2), the positions of the resulting images, , are obtained by solving the lens equation, which is expressed by
| (1) |
where are the total mass of the lens system and represents the combined angular Einstein ring radius. The Einstein ring radius is related to the total mass and the geometry of the lens system by
| (2) |
where and are the distances to the lens and the source, respectively. The magnifications of the individual images are given by the inverse of the Jacobian of the lens equation evaluated at each image position ;
| (3) |
and the total magnification is obtained by the sum of the magnifications of the individual images, i.e. , where is the total number of images. The number of images is three when the source is outside the caustic curve. As the source crosses the caustic, two additional images appear and thus the number of images becomes five when the source is inside the caustic curve. Due to the infinite magnification during the source’s crossing of the lens caustic, the light curves of a caustic-crossing binary lens event is characterized by sharp spikes.
In reality, the lensed source star is not a perfect point source, and thus the lensing magnification does not become infinity even for a caustic-crossing event. For an event involved with an extended source, the magnification is given by the intensity-weighted magnification averaged over the source star surface, i.e.
| (4) |
where is the displacement vector of a point on the source surface with respect to the source center, is the surface brightness over the source star surface111Due to limb darkening, the surface brightness profile of a source star is not uniform but decreases with the increasing distance from the source center., is the point-source magnification at the point caused by a binary lens with masses located at , and the notations represents the surface integral over the source star surface. The existence of a spot (spots) causes further deviations in the lensing light curve. For an event involved with a spotted source star, the lensing light curve is represented by
| (5) |
where is the displacement vectors of a point on the spot with respect to the source center, represents the fractional decrement in the surface intensity due to the spot, and represents the surface integral over the spot region of the source star.
3 Simulations
In this section, we investigate the pattern of spot-induced anomalies in lensing light curves resulting from various physical states of spots. For this, we perform simulations of events by using the formalism described in the previous section. The details of the simulations are described below.
3.1 Common Factors
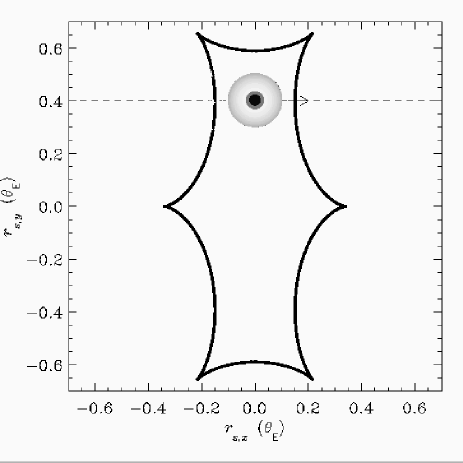
Since we are interested mainly in the dependency of the anomaly pattern on the spot parameters characterizing the physical states of spots, the tested events in the simulations are produced by a common binary lens system with a common source trajectory involved with also a common source star (unspotted background part). The lens system tested in the simulations has equal mass components separated by . The source trajectory of the tested events is presented in Figure 1 along with the locations of the lens caustics. The source star has an angular radius and its surface brightness profile is modeled by a linear form of
| (6) |
where is the limb-darkening coefficient whose value depends on the observed band. Assuming that events are observed both in and bands, the adopted values of the coefficients are and 222We consider multi-band observations because the color information might be useful to break the possible degeneracy between the anomalies caused by a spot and a transiting planet, as mentioned by Lewis (2001), but we note that the light curves to be presented in the following subsection are those measured in band., which corresponds to those of a K giant star with , , and a metallicity similar to the sun, i.e. (Van Hamme 1993). Since the spin rotation period of a giant star is much larger than the caustic sweeping time, we do not consider the effect of changing spot position during caustic crossings in our simulations.
3.2 Spot Models and Resulting Anomaly Patterns
The physical state of a spot is characterized by various factors. These factors include the size, the shape, and the surface brightness contrast with respect to the unspotted stellar region. In addition, spots are likely to appear in groups and may have umbra/penumbra structures. To investigate the individual effects of these factors on the pattern of spot-induced anomalies in lensing light curves, in each set of simulations, we produce a series of light curves by varying one spot parameter but fixing other parameters.
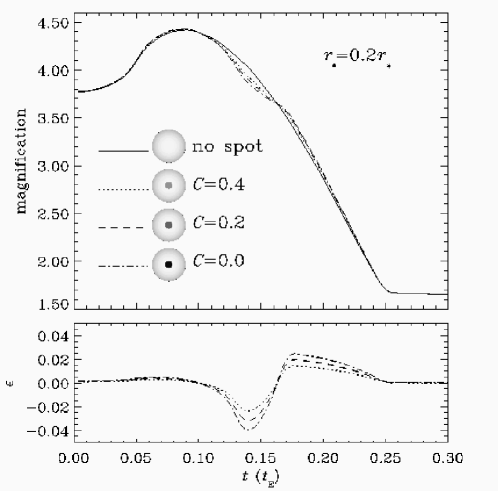
First, we investigate the dependency of the spot-induced anomaly pattern on the surface brightness contrasts of spots. In Figure 2, we present the light curves produced with spot models having different contrast parameters. The contrast parameter is defined by , where and are the surface brightnesses of the source star at the spot position with and without the presence of the spot and it is related to the decrement factor in eq. (5) by . With this definition of the contrast parameter, the anomaly pattern induced by a transiting planet is produced by setting , because the planet completely blocks the light from the source star. In the simulations, we assume that the spots are located at the center of the source star and have a common radius of (and thus covers 4% of the source star surface area). The time is expressed in units of the time scale that is required for the source to transit (Einstein time scale, ). To better show the deviation from the unspotted event light curve, we define a fractional magnification deviation by
| (7) |
and its change as a function of time (deviation curve) is presented in the lower panel. We test four different surface brightness contrast parameters of (no spot), 0.4, 0.2, and 0.0 (a completely dark spot or a transiting planet).333For comparison, we note that the contrast parameter of a typical solar spot (umbra part) is in band (Allen 1973). We note that the deviation curve is asymmetric with respect to the time of source center’s crossing of the caustic because not only the magnifications but also the gradients of the magnification on the left and right sides of the caustic are different each other. We also note that the value of is larger than zero for some parts of the light curve due to the decrease in the source baseline flux caused by the spot, and thus smaller value of the denominator in eq. (5). From the comparison of the light and deviation curves, one finds that darker spots, as expected, induce deeper hollows in the deviation curves.
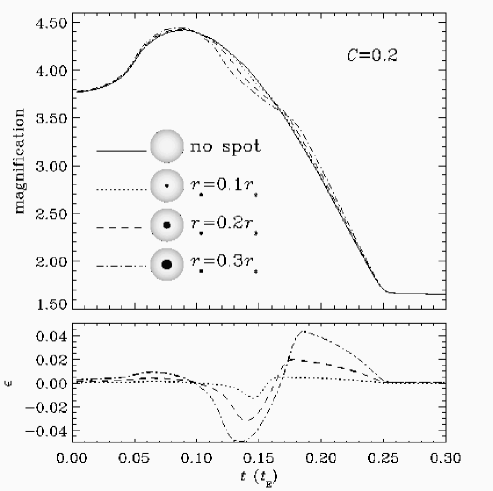
Second, we investigate the dependency of the anomalies on the spot size. Figure 3 shows the light curves produced with three different spot sizes of , , and . For all these events, we assume that the spots are located at the center of the source and have a common contrast parameter of . From the figure, one finds that as the spot size becomes bigger, the deviation curve becomes not only deeper but also broader.
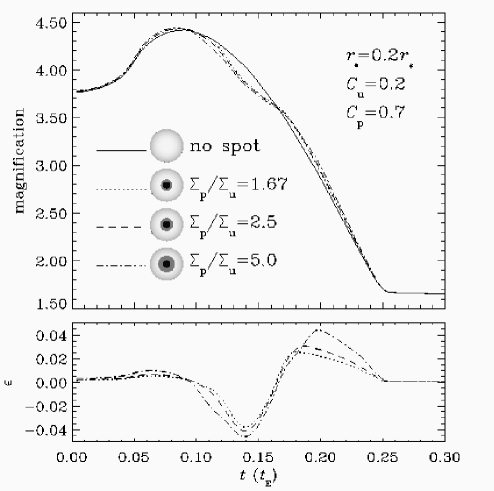
Third, we probe the dependency of the anomaly pattern on the umbra/penumbra structure of spots. We test three different spot structure models where the area of the umbra part, , is fixed while the area of the penumbra region has three different values of , , and . In each model, we assume that the umbra region covers of the total source surface area. The boundaries of the umbra and penumbra regions have a concentric circular shape centered at the center of the source star. The adopted values of the contrast parameters are and for the umbra and the penumbra parts, respectively. One finds that the existence of the penumbra causes the deviation curve to become broader, but the increase in depth is less important due to the small surface brightness contrast of the penumbra region. Although the curvature of the deviation curve changes when the caustic crosses the umbra/penumbra boundary (at around and 0.17 in the curve), the change is too small to be noticed.
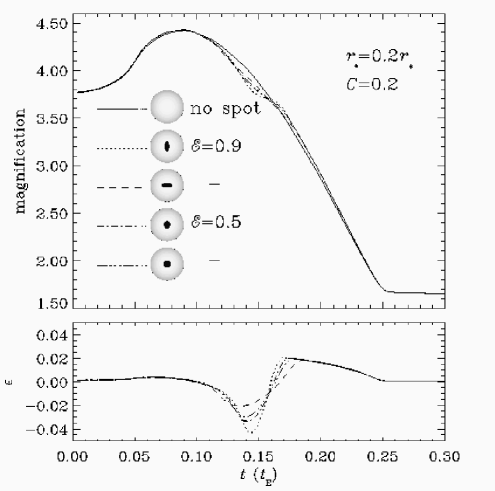
Fourth, we investigate the anomaly pattern dependency on the shape of spots. The shape of a spot can differ from a circle either due to the projection effect or because of its intrinsic shape. Moreover, spots tend to exist in a group and if small spots are closely located, the group as a whole will appear to be elongated. We test two elliptical spots with eccentricities of and 0.5, where and are the semi-major and semi-minor axes of the ellipse, respectively. We also investigate the effect of the spot orientation with respect to the sweeping caustic. For this, we test two cases for each spot shape where the major axis of the spot is parallel with and normal to the fold caustic, respectively (see the spots on the icons of Figure 5). The area of each elongated spot is normalized so that it is same as that of a circular spot with . We assume that the surface brightness contrast is . The resulting light curves are presented in Figure 5. From the figure, one finds that the deviation curve becomes deeper and narrower when the elongated direction of the spot is parallel with the sweeping caustic. This is because as the elongated direction of the spot aligns more with the caustic, larger part of the spot crosses the caustic, but during shorter period of time.
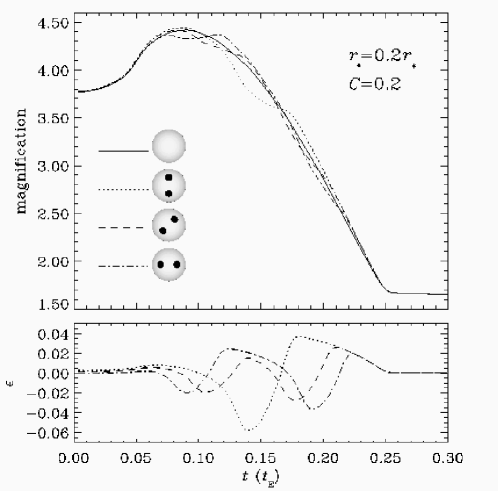
Finally, we investigate how the multiplicity of spots affects the anomaly pattern. We test dual spot model, where the two spots have the same size, surface brightness contrast, and shape. In Figure 6, we present the light curves resulting from three different sets of spot locations, which are marked on the corresponding icons. We assume that the spots are intrinsically circular, but they are off-centered and thus appear to be elliptical. The size of each spot is normalized such that the area is same as that of a circular spot with . We assume a surface contrast of . One finds that except for the case where the two spots are aligned with the caustic, the individual spots cause separate hollows in the deviation curve.
4 Transiting Planets Versus Spots
As mentioned, the lensing light curve anomalies induced by a transiting planet can mimic those induced by a spot. However, there are several characteristics of a spot that make the spot differentiated from a transiting planet. Then, for some of the spot-induced lensing light curve anomalies, it may be possible to isolate them from the anomalies induced by transiting planets. One may think of several such distinctive characteristics of spots. First, unlike transiting planets, spots have in general non-zero surface brightness contrasts. Second, spots normally have non-circular shapes, while the silhouettes of transiting planets are circular. Third, spots are likely to have complex umbra/penumbra structures unlike the uniform contrast of transiting planets. Fourth, spots would appear, by nature, in groups of two or more, while the chance for two planets simultaneously transit their host star is extremely low. Based on the patterns of spot-induced anomalies presented in the previous section, however, one finds that the spot characteristics of the non-zero surface brightness, the non-circular shape, and the umbra/penumbra structure do not produce distinctive features in the anomaly pattern. The major effects of these spot characteristics are making the width and the depth of the resulting deviation curve change, but these variations can be reproduced by modulating the planet size. On the contrary, the multiple deviation feature in the anomaly pattern caused by the multiplicity of spots is unique only for the spot-induced anomalies. Since the multiplicity is a general tendency for spots, we think that the spot-induced anomalies, in many cases, can be identified from this feature.
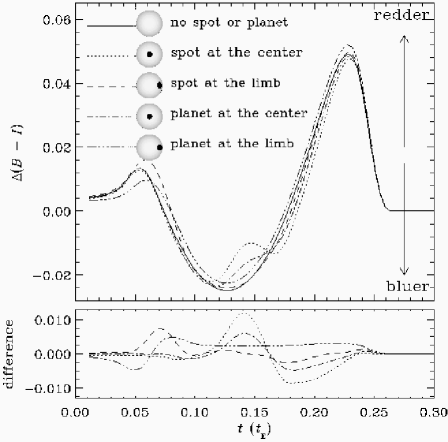
Besides the anomaly pattern in lensing light curves, we additionally check the possibility to distinguish the two types of anomalies by using the color information obtained from multi-band photometry. For this check, we simulate color changes of events occurred on source stars with a spot and a transiting planet. For each case, we test two models where the spot (planet) is located at the center and the limb of the source star during the caustic crossing (see the icons in Figure 7). We assume that both the spot and the planet covers 4% of the source star surface area. We also assume that observations are carried out in and bands. We note that while the contrast parameter for the transiting planet is zero regardless of the observed band, the spot contrast parameter is wavelength dependent. The spot contrast parameter have different values depending on the observed wavelength band not only because the spot region of the stellar surface has a different temperature from that of the background stellar surface but also because in different wavelengths one sees different layers of the stellar atmosphere (e.g. in longer wavelength, one sees cooler upper layer of the atmosphere). We assume that the spot contrast parameters are and 0.21 in and bands, respectively, by adopting those of a typical solar spot (Allen 1973). In Figure 7, we present the color change curves obtained from the simulations. In th lower panel, we also present the difference (in units of magnitude) from the color change curve of the event produced without the spot or the planet. We note that due to the limb darkening of the source star, color change occurs even without the presence of the spot or the planet on the source star.444For the description of the general color change patterns of both the point- and fold-caustic-crossing microlensing events occurred on limb-darkened source star, see Han & Park (2001). Therefore, the difference presented in the lower panel represents the additional color changes induced by the spot and the planet. From the figure, one finds that the pattern of the additionally induced color changes takes various forms. However, the amount of these additional color changes are expected to be very small ( mag), and thus we think that color information will be useful only when the the uncertainty in the measured color is very small.
5 Conclusion
We have investigated the patterns of spot-induced anomalies in caustic-crossing binary lens events. For this purpose, we performed simulations of events with various models of the physical state of spots which is characterized by the surface brightness contrast, the size, the number, the umbra/penumbra structure, the shape, and the orientation with respect to the sweeping caustic. From these simulations, we learned that the spot-induced anomalies take various forms depending on these factors. We also examined the feasibility of distinguishing the two possibly degenerate types of anomalies caused by a spot and a transiting planet and found that the degeneracy in many cases can be broken from the characteristic multiple deviation feature in the spot-induced anomaly pattern caused by the multiplicity of spots.
This work was supported by a grant (2001-DS0074) from Korea Research Foundation (KRF).
References
- [1] Alard C., Guibert J., 1997, A&A, 326, 1
- [2] Albrow, M., et al., 1998, 509, 687
- [3] Alcock C., et al., 1993, Nat, 365, 621
- [4] Alcock C., et al., 1997, 491, 436
- [5] Allen C. W., 1973, Astrophysical Quantities 3rd ed. (London: Athlone press), 184
- [6] Aubourg E., et al., 1993, Nat., 365, 623
- [7] Bond I., et al., 2001, MNRAS, 327, 868
- [8] Bryce H. M., Hendry M. A., 2000, preprint (astro-ph/0004250)
- [9] Gould A., 1994, ApJ, 421, L71
- [10] Han C., Park S.-H., 2001, MNRAS, 320, 41
- [11] Han C., Park S.-H., Kim H.-I., Chang K., 2000, MNRAS, 316, 665
- [12] Heyrovský D., Sasselov D., 2000, ApJ, 529, 69
- [13] Lewis G. F., 2001, preprint (astro-ph/0110410)
- [14] Nemiroff R. J., Wickramasinghe W. A. D. T., 1994, ApJ, 424, L21
- [15] Paczyński B., 1986, ApJ, 304, 1
- [16] Rhie, S. H., Becker A. C., Bennett D. P., Fragile P. C., Johnson P. R., King L. J., Peterson B. A., Quinn J., 1999, ApJ, 522, 1037
- [17] Udalski A., Szymański M., Kaluzny J., Kubiak M., Krzemiński W., Mateo M., Preston G. W., Paczyński B., 1993, Acta Astron., 43, 289
- [18] Van Hamme W., 1993, AJ, 106, 2096
- [19] Witt H. J., Mao S., 1994, ApJ, 430, 505