Spectroscopic Diagnostics for AGNs
Abstract
A review of the spectroscopic tools needed to characterize AGNs is presented. This review focusses on ultraviolet, optical and infrared emission-line diagnostics specifically designed to help differentiate AGNs from starburst-dominated galaxies. The strengths and weaknesses of these methods are discussed in the context of on-going and future AGN surveys.
Department of Astronomy, University of Maryland, College Park, MD 20742
1. Introduction
The first decade of the 21st Century promises to become the Golden Age of extragalactic astronomy. The 2dF and Sloan Digital Sky Surveys have already made significant contributions to our knowledge of the extragalactic universe. On-going and planned wide-field (pencil-beam) imaging and spectroscopic surveys with 4m (8m)-class telescopes from the ground and in space (e.g., SIRTF, SOFIA, Herschel, NGST) will nicely complement these large-scale surveys and should go a long way to answer some of the most fundamental questions in extragalactic astronomy: How do galaxies form? How do they evolve? How do supermassive black holes fit in this picture of galaxy formation? Which objects are the main contributors to the overall energy budget of the universe? To properly answer these questions, one will need to differentiate objects powered by nuclear fusion in stars (i.e. normal and starburst galaxies) from objects powered by mass accretion onto supermassive black holes (quasars and AGNs). A wide variety of diagnostic tools have been used in the past for this purpose with different degree of success.
Due to space limitations, the present discussion focusses on emission-line diagnostics. The fundamental principles behind these diagnostics are reviewed in §2. Next, the main diagnostic tools available in the ultraviolet, optical, and infrared domains are described in §3, §4, and §5, respectively. A table listing the main diagnostic lines is given in each of these sections. Additional factors which may complicate the use of these tools are discussed in §6. A summary is given in §7 along with an outlook on the future. Note that this review is not meant to be exhaustive; it is meant to emphasize the practical aspects of starburst/AGN spectral classification. Readers who are looking for a more detailed discussion of the physics behind these diagnostic tools should refer to the original papers listed in the text.
2. Basic Principles
Activity driven by mass accretion onto supermassive black holes differs in many ways from star-formation activity. The thermal and non-thermal processes associated with the accretion disk and its surroundings (e.g., corona) are at the origin of the “hard” ionizing continuum detected in quasars and AGNs (e.g., Krolik 1999). Material in the vicinity of the nucleus will bear the imprint of this strong radiation field. The deep gravitational potential at the center of these galaxies allows the presence of high-density ( 109 cm-3), high-velocity ( 2000 km s-1) gas clouds in the inner parsec of quasars and AGNs. This so-called broad-line region or BLR is a powerful diagnostic of nuclear activity in galaxies. The main signatures of the BLRs are broad recombination lines which are unaffected by the effects of collisional de-excitation at high densities. Two general methods have been used in the past to detect BLRs in galaxies: direct spectroscopy and spectropolarimetry. This last method relies on the presence of dust or electrons (“mirrors”) to scatter the BLR signature towards the line of sight (e.g., Antonucci 1993). Direct spectroscopy searches for the presence of the broad recombination lines at wavelengths where the effects of dust extinction are reduced. As shown in Table 1 for representative Galactic extinction (see, e.g., Cardelli, Clayton, & Mathis 1989; Draine & Lee 1984; Draine 1989; Lutz et al. 1996; Lutz 1999), great increase in sensitivity can in principle be obtained by observing at longer wavelengths.
| NH(cm-2) @ = 1 | ||
|---|---|---|
| Ly 1216 Å | 2.0 - 4.5 | 0.5 – 1.0 1021 |
| V band 5500 Å | 1.2 | 1.7 1021 |
| H 6563 Å | 1.0 | 2.2 1021 |
| J band 1.25 m | 1/3 | 6.1 1021 |
| H band 1.65 m | 1/4.5 | 9.8 1021 |
| K band 2.2 m | 1/7 | 1.6 1022 |
| L band 3.4 m | 1/15 | 3.4 1022 |
| M band 5.0 m | 1/30 | 6.4 1022 |
| N band 10 m | 1/15 | 3.2 1022 |
| 12 m | 1/30 | 6.2 1022 |
| 25 m | 1/60 | 1.3 1023 |
| 60 m | 1/400 | 8.6 1023 |
| 100 m | 1/700 | 1.5 1024 |
In highly obscured objects with NH 1024 cm-2, direct detection of the BLRs becomes very difficult and one has to rely on spectropolarimetry to search for the presence of a BLR. The obscuring screen may not be opaque in all directions, however. The ionizing radiation field may be able to escape in certain directions and ionize the surrounding material on scales beyond the obscuring material. Distributed in the shallower portion of the gravitational potential ( 0.1 – 1 kpc), this “narrow-line region” or NLR is another excellent probe of nuclear activity. The ionizing spectra of all but the hottest O stars cut off near the He II edge (54.4 eV; Dopita et al. 1995). In contrast, the ionizing spectrum of AGNs contains a relatively large fraction of high-energy photons (e.g., Elvis et al. 1994). Optically thick gas clouds ionized by the hard continuum of AGNs will present a stratified ionization structure with (1) a highly ionized inner face (closest to the AGN), (2) a large partially zone with characteristic fraction of ionized hydrogen H+/H 0.2 – 0.4 produced by the deposition of keV X-rays (recall that the absorption cross sections of H0, He0, and all other ions decrease rapidly with increasing energy; Osterbrock 1989), and (3) a neutral zone facing away from the AGN. The fast free electrons in the partly ionized zone will have a positive effect on the strengths of low-ionization lines produced by collisional effects, while the highly ionized conditions in the inner face will favor the production of emission lines from ions with high ionization potentials (e.g., Ferland & Netzer 1983; Ferland & Osterbrock 1986, 1987; Binette, Wilson, & Storchi-Bergmann 1996).
Based on these physical principles, one should choose narrow emission line diagnostics following ten basic rules or “Commandments” (a reminder of the 1700th anniversary of the adoption of Christianity as a national religion in Armenia):
-
1.
Thou shalt use lines which emphasize the differences between H II regions and AGNs; i.e., use high-ionization lines or low-ionization lines produced in the partially ionized zone.
-
2.
Thou shalt use strong lines which are easy to measure in typical spectra.
-
3.
Thou shalt avoid lines which are badly blended with other emission or absorption line features.
-
4.
Thou shalt use lines with small wavelength separation to minimize sensitivity to reddening.
-
5.
Thou shalt use line ratios from the same elements or involving hydrogen recombination lines to eliminate or reduce abundance dependence.
-
6.
Thou shalt avoid lines from Mg, Si, Ca, Fe – depleted onto dust grains.
-
7.
Thou shalt use lines easily accessible to current UV/optical/IR detectors.
-
8.
Thou shalt avoid lines affected by strong stellar absorption features.
-
9.
Thou shalt avoid lines affected by strong atmospheric features.
-
10.
Thou shalt use lines at long wavelengths to reduce the effects of dust extinction.
3. Ultraviolet Emission-Line Diagnostics
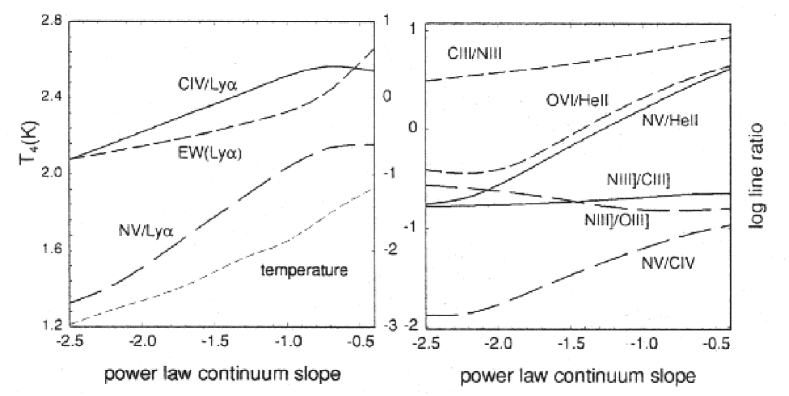
When possible, ultraviolet diagnostic tools should be avoided because of their sensitivity to dust extinctions (see the Tenth Commandment and Table 1). However, investigators of the high-redshift universe often have very little choice but to study this region of the electromagnetic spectrum. The ultraviolet domain is potentially a rich source of diagnostic lines. The main emission lines are listed in Table 2. Among the most useful diagnostics to discriminate between AGNs and starbursts are the N V 1240/He II 4686, N V 1240/C IV 1549, N V 1240/Ly, and C IV 1549/Ly emission-line ratios. As shown in Figure 1, these ratios are sensitive functions of the shape of the ionizing continuum (harder spectra provide more heating per photoionization, therefore increasing the temperature). These line ratios have been used extensively in studies of high- quasars (e.g., Hamann & Ferland 1999) and radio galaxies (e.g., Röttgering et al. 1997; Villar-Martin et al. 1996, 1999), and the analysis of low- AGNs/LINERs (e.g., Ho et al. 1996; Barth et al. 1996, 1997; Maoz et al. 1998; Nicholson et al. 1998) and starburst galaxies (e.g., Robert, Leitherer, & Heckman 1993).
| Low-to-Moderate Ionization Lines | High-Ionization Lines | ||
|---|---|---|---|
| Line | (eV) | Line | (eV) |
| C III 977 Å | 24.4 | O VI 1032, 1038 Å | 114 |
| N III 991, 1750 Å | 29.6 | N V 1240 Å | 77.4 |
| Ly 1026 Å, Ly 1216 Å | 13.6 | O IV] 1407 Å | 54.9 |
| Si IV 1394, 1403 Å | 33.5 | N IV] 1488 Å | 47.4 |
| O III] 1663 Å | 35.1 | C IV 1549 Å | 47.9 |
| N III] 1750 Å | 29.6 | He II 1085, 1640 Å | 54.4 |
| Si III 1895 Å | 16.3 | ||
| C III] 1909 Å | 24.4 | ||
| Fe II 2080, 2500, 3300 Å | 7.9 | ||
| O III] 2322 Å | 35.1 | ||
| C II] 2326 Å | 11.3 | ||
| Si II 2336 Å | 8.2 | ||
| Mg II 2798 Å | 7.6 | ||
4. Optical Emission-Line Diagnostics
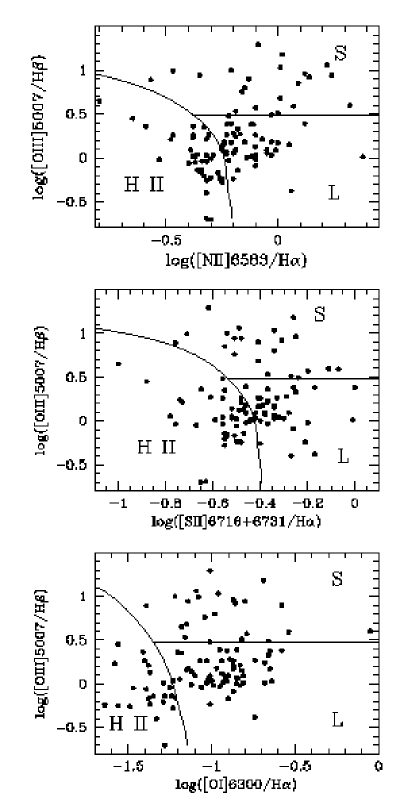
The excellent quantum efficiency of current CCDs combined with the high transparency and low emissivity of the Earth’s atmosphere at optical wavelengths make optical spectroscopy the easiest way to identify AGNs. Table 3 lists the strongest diagnostic lines between 3000 Å and 1 m. Classification schemes involving several line ratios which take full advantage of the physical distinction between the two types of objects and minimize the effects of reddening correction and errors in the flux calibration have proven very useful for the identification of galaxies as AGNs or starbursts (e.g., Phillips, Baldwin, & Terlevich 1981; Veilleux & Osterbrock 1987; Osterbrock, Tran, & Veilleux 1992; Dopita et al. 2000). Examples of emission-line diagrams are shown in Figure 2 for ultraluminous infrared galaxies from the 1-Jy sample (ULIGs; these are IRAS galaxies with infrared luminosities between 8 and 1000 m larger than or equal to 1012 L⊙; Kim 1995). The results from this classification indicates that the fraction of Seyfert nuclei increases from 5% at log[LIR/L⊙] = 10 – 11, to 50% at log[LIR/L⊙] 12.3 (Veilleux et al. 1995, Kim, Veilleux, & Sanders 1998; Veilleux, Kim, & Sanders 1999a).
| Low-to-Moderate Ionization Lines | High-Ionization Lines | ||
| Line | (eV) | Line | (eV) |
| O II] 3727, 7325 Å | 13.6 | Ne V] 3346, 3426 Å | 97.1 |
| Ne III] 3869, 3968 Å | 41.0 | Fe V] 3840, 3893, 4071 Å | 54.8 |
| O III] 4363, 5007 Å | 35.1 | Fe VII] 3588, 3760, 4071, 5721, 6087 Å | 99.0 |
| Fe II 4500, 5190, 5300 Å | 7.9 | He II 4686 Å | 54.4 |
| H 4861 Å, H 6563 Å | 13.6 | Fe XIV] 5303 Å | 344 |
| He I 5876, 7065 Å | 24.6 | Fe X] 6375 Å | 235 |
| O I] 6300, 6363 Å | 0.0 | Fe XI] 7892 Å | 262 |
| N II] 5755, 6548, 6583 Å | 14.5 | ||
| S II] 6716, 6731 Å | 10.4 | ||
| S III] 6312, 9069, 9531 Å | 23.3 | ||
5. Near-Infrared Emission-Line Diagnostics
Infrared-bright galaxies such as those discussed in the previous section are hosts to large quantities of molecular gas and dust (e.g., Solomon et al. 1997). The optical line ratios measured in these objects are undoubtedly affected by dust extinction. It is therefore important to also observe these objects at longer wavelengths to verify the results derived from the optical spectra. Near-infrared spectroscopy has had success finding obscured BLRs in several ULIGs (e.g., Hines 1991; Veilleux et al. 1997b, 1999b; spectropolarimetry has lent support to some of these findings: Hines 1991; Hough et al. 1991; Hines & Wills 1993; Hines et al. 1995; Young et al. 1993). This technique has also proven useful in the study of highly reddened BLRs in intermediate Seyferts (1.8’s and 1.9’s; Goodrich 1990; Rix et al. 1990) and in optically classified Seyfert 2 and radio galaxies (e.g., Blanco, Ward, & Wright 1990; Goodrich, Veilleux, & Hill 1994; Ruiz, Rieke, & Schmidt 1994; Hill, Goodrich, DePoy 1996; Veilleux, Goodrich, & Hill 1997a).
The line of choice for ground-based near-infrared searches of obscured BLRs in nearby galaxies is Pa at 1.8751 m (Table 4). Under Case B recombination (Osterbrock 1989), this line is one-third the strength of H and is twelve times stronger than Br 2.1655, the next best diagnostic line (e.g., Goldader et al. 1995). This huge gain in intensity more than compensates the slightly larger optical depth due to extinction at the shorter wavelength of Pa (see 4th column in Table 4).
Another important AGN diagnostic line in the K band is [Si VI] 1.962. The existence of five-times ionized silicon ions requires energies larger than 167 eV (Table 4). This forbidden line has been detected in a number of optically selected Seyfert 2 galaxies with a strength comparable to that of [Fe VII] 6087 (roughly a tenth the strength of H), as expected from photoionization by a AGN power-law continuum (Oliva & Moorwood 1990; Greenhouse et al. 1993; Marconi et al. 1994; Oliva et al. 1994; Thompson 1995, 1996). Near-infrared spectroscopic surveys of ULIGs have confirmed the optical results: the fraction of objects with genuine AGNs (with a BLR or strong [Si VI] 1.962 feature) is at least 20 – 25%, but reaches 35 – 50% for those objects with log[Lir/L⊙] 12.3. Nevertheless, the presence of an AGN in ULIGs does not necessarily imply that AGN activity is the dominant source of energy in these objects. A more detailed look at the AGNs in these ULIGs is needed to answer this question.
| Hydrogen Recombination Lines | High-Ionization Lines | ||||
|---|---|---|---|---|---|
| Line | (m) | F/FHα | Aλ/AHα | Line | (eV) |
| H | 0.4861 | 1.00 | 1.48 | S IX] 1.252 m | 328 |
| H | 0.6563 | 2.85 | 1.00 | Si X] 1.430 m | 351 |
| Pa | 1.0938 | 0.090 | 0.45 | Si XI] 1.932 m | 401 |
| Pa | 1.2818 | 0.162 | 0.34 | Si VI] 1.962 m | 167 |
| Pa | 1.8751 | 0.332 | 0.18 | Ca VIII] 2.321 m | 128 |
| Br | 2.1655 | 0.0275 | 0.14 | Si VII] 2.483 m | 205 |
| Br | 4.0512 | 0.0779 | 0.05 | Si IX] 3.935 m | 303 |
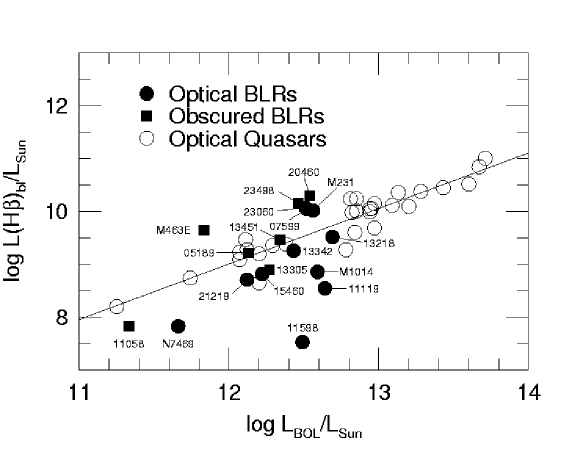
A strong linear correlation has long been known to exist between the continuum (or, equivalently, bolometric) luminosities of broad-line AGN and their emission-line luminosities (e.g., Yee 1980; Shuder 1981; Osterbrock 1989). This correlation has often been used to argue that the broad-line regions in AGNs are photoionized by the nuclear continuum. If this is the case, the broad-line–to–bolometric luminosity ratio is a measure of the covering factor of the BLR (e.g., Osterbrock 1989). This correlation can be used to estimate the importance of the AGN in powering ultraluminous infrared galaxies (Veilleux et al. 1997b, 1999b). In ULIGs powered uniquely by an AGN, we expect the broad-line luminosities to fall along the correlation for AGNs. Any contribution from a starburst will increase the bolometric luminosity of the ULIG without a corresponding increase in the broad-line luminosity. Starburst-dominated ULIGs are therefore expected to fall below the “pure-AGN” correlation traced by the optical quasars in a diagram of (BLR) plotted as a function of . The data of ULIGs with optical and obscured BLRs are shown in Figure 3. A discussion of the methods and assumptions which were used to create this figure is presented in Veilleux et al. (1999a). Figure 3 strongly suggests that most ( 80%) of the ULIGs with optical or near-infrared BLRs in the 1-Jy sample are powered predominantly by the quasar rather than by a powerful starburst. In other words, the detection of an optical or near-infrared BLR in a ULIG (about 20% of the total 1-Jy sample) appears to be an excellent sign that the AGN is the dominant energy source in that ULIG.
6. Mid-to-Far Infrared Emission-Line Diagnostics
The mid-to-far infrared region has long been known to be a rich source of emission-line diagnostics in active and starburst galaxies (e.g., Watson et al. 1984; Roche et al. 1984; Aitken & Roche 1985; Crawford et al. 1985; Lugten et al. 1986; Duffy et al. 1987; Roche et al. 1984, 1991, Spinoglio & Malkan 1992; Voit 1992). With the Infrared Space Observatory (ISO) much progress has been made in this area of research in recent years (see review by Genzel & Cesarsky 2000). One of the most important applications of ISO spectroscopy has been its use as a tool to distinguish between star formation and AGN activity in obscured environments. High ionization fine structure lines are strong in the NLR of AGNs but very weak in starbursts (Table 5). Fine-structure lines have smaller excitation energies than their optical counterparts, so they are less temperature sensitive and less model dependent. Unfortunately, they are also fainter than their optical counterparts, and are therefore difficult to detect even in genuine, optically-selected AGNs (e.g., Genzel et al. 1998).
| Line | (eV) |
|---|---|
| Ar III] 9 m | 27.6 |
| S IV] 10.5 m | 34.8 |
| Ne II] 12.8 m | 21.6 |
| Ne V] 14.3, 24.2 m | 97.1 |
| Ne III] 15.6, 36.0 m | 41.0 |
| S III] 18, 34 m | 23.3 |
| O IV] 26 m | 54.9 |
| Si II] 35 m | 8.2 |
| O III] 52, 88 m | 35.1 |
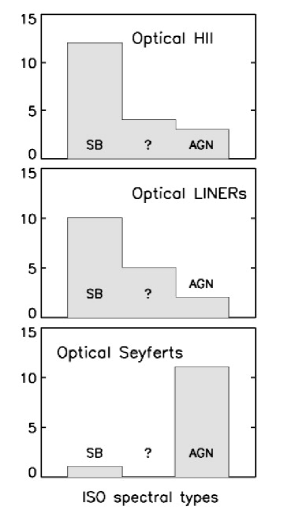
This work has since been extended to larger samples, using the polycyclic aromatic hydrocarbon (PAH) diagnostic to reach fainter sources (e.g., Lutz et al. 1998; Rigopoulou et al. 1999; Tran et al. 2001). The PAH features at 3.3, 6.2, 7.7, 8.7, and 11.2 m are ubiquitous in normal galaxies and starbursts but absent near an AGN (e.g., Roche et al. 1991). Obscured regions also show absorption features, the strongest ones at 9.7 and 18 m being due to silicate dust, which complicate the placement of the continuum near the PAH features. An object-by-object comparison of the optical and ISO spectral types for ULIGs in the 1-Jy sample reveals a remarkably good agreement between the two classification schemes if optically classified LINERs are assigned to the starburst group (Fig. 4). These results indicate that strong AGN activity, once triggered, quickly breaks the obscuring screen at least in certain directions, thus becoming detectable over a wide wavelength range.
7. Complications
7.1. Contribution from Shocks
Violent gas motions associated with AGN-driven or starburst-driven outflows or galaxy mergers may cause shock waves with velocities of 100 – 500 km s-1 in the ISM of the host galaxies. The shocks may produce a strong flux of EUV and soft X-ray radiation which may be absorbed in the shock precursor H II region (e.g., Sutherland, Bicknell, & Dopita 1995). The combination of the low-ionization emission-line spectrum from the post-shock material and the high-ionization emission-line spectrum from the precursor H II region can reproduce many of the spectroscopic signatures of LINERs and narrow-line AGNs (e.g., Dopita & Sutherland 1995). Fortunately, there are important physical differences between shock ionization and photoionization by an AGN (e.g., Morse, Raymond, & Wilson 1996). First, the line ratios produced in photoionized objects should be independent of the gas kinematics, while they are expected to correlate with the kinematics of the shock-ionized material. This effect is seen in a few optically and infrared-selected LINERs (Veilleux et al. 1994, 1995). The ionizing ultraviolet and soft X-ray continuum in shock-ionized objects should be extended on the same scale as the shock structure, while it is expected to be a point source in the case of pure AGN photoionization. Finally, the electron temperature in shock ionized objects is expected to be considerably higher. Temperature-sensitive line ratios such as C III 1909/977 and N III 1750/991 in the ultraviolet and [O III] 5007/4363 and [N II] 5755/6583 in the optical range are the prime diagnostics of shock excitation. This method was used by Kriss et al. (1992) to deduce that shock excitation is likely to be important in the NLR of NGC 1068.
7.2. Aperture Effects
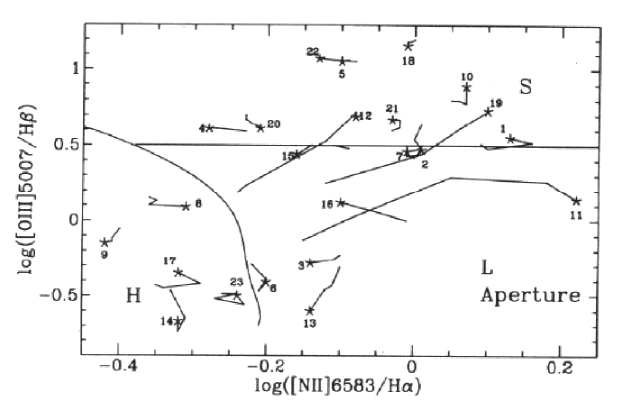
Circumnuclear starbursts often accompany AGNs (see, e.g., recent reviews by Veilleux 2000 and Gonzales Delgado 2001). The strength of the AGN signature is therefore a function of the size of the extraction aperture. This effect is particularly evident among infrared-selected galaxies where circumnuclear starbursts are nearly always present. Figure 5 shows the line ratios of luminous infrared galaxies as function of aperture size. The line ratios in some of these objects are seen to drift towards the H II region locus with increasing aperture size; large apertures dilute the AGN signature. Aperture effects will be particularly important in samples which cover a broad redshift range where a constant angular aperture corresponds to a wide range in linear scale. For a meaningful statistical analysis of the spectral classification one should use a fixed linear aperture for all objects in the sample (regardless of redshifts).
7.3. Morphological Biases
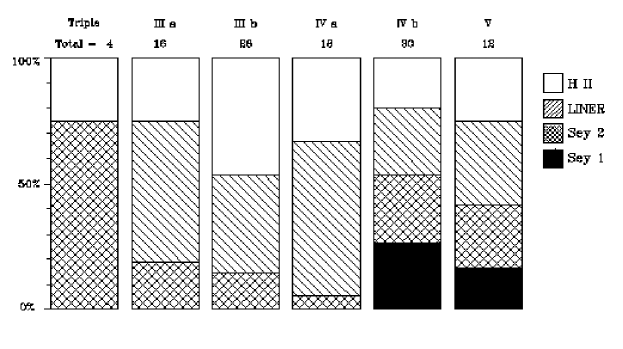
Strong trends exist between the presence of an AGN, the mid-to-far infrared colors, and the host morphology. Objects with “warm” infrared colors (e.g., IRAS 0.2) often harbor an AGN at optical or near-infrared wavelengths or in polarized light (de Grijp et al. 1985; Veilleux et al. 1995, 1997b, 1999ab; Heisler, Lumsden, & Bailey 1997). Infrared-selected samples are often biased towards or against the presence of AGNs (but this is not the case for the 1-Jy sample; Kim & Sanders 1998). The same thing can be said about galaxy morphology. ULIGs often show signs of galaxy interactions. Most ULIGs are involved in the merger of two relatively large galaxies. Optically-classified Seyferts (especially those of type 1) are generally found in advanced mergers, while H II galaxies and LINERs are found in all merger phases (Fig. 6; see also Veilleux 2001). This means that surveys which specifically look for compact objects will be biased against starburst galaxies and are not statistically reliable for spectral classification purposes.
7.4. Metallicity Effects
The line ratio diagnostics discussed in this review often are a sensitive function of the metal contents in the ionized gas (see, e.g., Ferland & Netzer 1983; Veilleux & Osterbrock 1987 for early papers describing the effects of metallicity). The metallicity is well known to be correlated positively with the mass of the host galaxies (e.g., Bender, Burnstein, & Faber 1993), although this result has only been proven at low redshifts. In the early universe, one would expect declining metal abundances with increasing redshifts. The redshift dependence of the relative abundances of the elements involved in the emission-line ratios is a complex function of the star formation history and chemical evolution (including the effects of gas accretion and outflows) of the host galaxy environment (see, e.g., Hamann & Ferland 1999 for a discussion of QSO hosts). The usefulness of emission-line diagnostics at high redshifts will directly depend on the availability of accurate metallicity measurements and diagnostic tools properly calibrated in terms of metallicity.
8. Summary
UV–Optical–IR emission-line ratios are powerful diagnostics tools to discriminate between starbursts and AGNs. The following ratios have been shown to be the most reliable tools for this purpose.
-
1.
Ultraviolet: N V 1240/Ly, N V 1240/He II 1640, C IV 1548/Ly.
-
2.
Optical: [O III] 5007//H, [N II] 6583/H, [S II] 6724/H, [O I] 6300/H, [O II] 7324/H, [Fe VII] 6087/H, [Ne V] 3426/H, He II 4686/H.
-
3.
Near-infrared: Obscured broad Pa 1.875 m, [Si VI] 1.962 m/Pa.
-
4.
Mid-Infrared: [Ne V] 14 m/[Ne II] 12.8 m, [O IV] 26 m/[Ne II] 12.8 m, EW(PAH 7.7 m), overall SEDs especially 25 m/60 m colors.
A number of issues complicate the use of line ratios as discriminants between starburst and active galaxies, but additional measures can be used to clarify the situation:
-
1.
Shock ionization: If shocks are important, one would generally expect correlations between the line ratios and gas kinematics, a UV continuum extended on the same scale as the shock structure, and high gas temperatures.
-
2.
Aperture effects: One should use a constant linear aperture to avoid variations in the contributions from circumnuclear starbursts.
-
3.
Morphological bias: The spectral classification is likely to depend on the morphology of the host, especially the merger phase. Selection methods based on morphology will bias the sample.
-
4.
Metallicity: Massive host galaxies in the local universe have larger metallicity, but high-redshift galaxies should be less dusty and less metal rich. One needs to use emission-line diagnostics which are properly calibrated as a function of metallicity and reddening.
Several new instruments will help refine the diagnostic tools discussed in this paper. The Cosmic Origins Spectrograph (COS), to be installed in 2003 on HST, will provide the high ultraviolet throughput needed to calibrate the UV diagnostic tools as a function of metallicity, evaluate the importance of shock ionization with the use of the C III and NIII temperature-sensitive line ratios, and to help resolve the circumnuclear starbursts and shock-excited winds around AGNs. The advent of SIRTF will help in the calibration of the infrared diagnostic tools as a function of metallicity and dust extinction. This spacecraft will also be a powerful instrument to search for infrared-bright AGNs. Ground-based work with adaptive optics and integral-field units will improve the sensitivity of searches for obscured AGNs by focussing on the inner regions of galaxies and avoiding the circumnuclear material associated with other phenomena. Spectroscopic follow-ups from the ground will help identify and classify AGN candidates in space-based and submm-selected samples.
Acknowledgments.
The ground-based study on ultraluminous infrared galaxies discussed in this paper is done in collaboration with Drs. D. B. Sanders and D.-C. Kim. The author gratefully acknowledges the financial support of NASA through LTSA grant number NAG 56547.
References
Aitken, D. K., & Roche, P. F. 1985, MNRAS, 213, 777
Antonucci, R. 1993, ARA&A, 31, 473
Baldwin, J. A., Phillips, M. M., & Terlevich, R. 1981, PASP, 93, 5
Barth, A. J., et al. 1996, AJ, 112, 1829
Barth, A. J., et al. 1997, AJ, 114, 2313
Bender, R., Burstein, D., & Faber, S. M. 1993, ApJ, 411, 153
Binette, L., Wilson, A. S., & Storchi-Bergmann, T. 1996, A&A, 312, 365
Blanco, P. R., Ward, M. J., & Wright, G. S. 1990, MNRAS, 242, 4P
Cardelli, J. A., Clayton, G. C., & Mathis, J. S. 1989, ApJ, 345, 245
Crawford, M. K., et al. 1985, ApJ, 291, 755
De Grijp, M. H. K. Miley, G. K., Lub, J., & de Jong, T. 1985, Nature, 314, 240
Draine, B. T., & Lee, H. M. 1984, ApJ, 285, 89
Draine, B. T. 1989, in Infrared Spectroscopy in Astronomy, ed. B. H. Kaldeich (ESA-SP290; Noordwijk: ESA), 93
Dopita, M. A. & Sutherland, R. S. 1995, ApJ, 455, 468
Dopita, M. A., et al. 2000, ApJ, 542, 224
Duffy, P. B., et al. 1987, ApJ, 315, 68
Elvis, M., et al. 1994, ApJS, 95, 1
Ferland, G. J., & Netzer, H. 1983, ApJ, 264, 105
Ferland, G. J., & Osterbrock, D. E. 1986, ApJ, 300, 658
Ferland, G. J., & Osterbrock, D. E. 1987, ApJ, 318, 145
Genzel, R., & Cesarsky, C. J. 2000, ARA&A, 38, 761
Genzel, R., et al. 1998, ApJ, 498, 579
Goldader, J. D., et al. 1995, ApJ, 444, 97
Gonzales Delgado, R. M. 2001, in Issues in Unification of AGNs, in press (astro-ph/0109505)
Goodrich, R. W. 1990, ApJ, 355, 88
Goodrich, R. W., Veilleux, S., & Hill, G. J. 1994, ApJ, 422, 521
Greenhouse, M. A., et al. 1993, ApJS, 88, 23
Hamann, F., & Ferland, G. 1999, ARA&A, 37, 487
Heisler, C. A., Lumsden, S. L., & Bailey, J. A. 1997, Nature, 385, 700
Hill, G. J., Goodrich, R. W., & de Poy, D. L. 1996, ApJ, 462, 163
Hines, D. C. 1991, ApJ, 374, L9
Hines, D. C., et al. 1995, ApJ, 450, L1
Hines, D. C., & Wills, B. J. 1993, ApJ, 415, 82
Ho, L. C., Filippenko, A. V., & Sargent, W. L. W. 1996, ApJ, 462, 183
Hough, J. H., et al. 1991, ApJ, 372, 478
Kim, D.-C. 1995, Ph.D. Thesis, University of Hawaii
Kim, D.-C., & Sanders, D. B. 1998, ApJS, 119, 41
Kim, D.-C., Veilleux, S., & Sanders, D. B. 1998, ApJ, 508, 627
Kim, D.-C., et al. 1995, ApJS, 98, 129
Kriss, G. A., et al. 1992, ApJ, 394, L37
Krolik, J. H. 1999, Active Galactic Nuclei, Princeton University Press.
Lugten, J. B., et al. 1986, ApJ, 311, L51
Lutz, D. 1999, in The Universe as seen by ISO, ed. P. Cox and M. F. Kessler (ESA SP-427; Noordwijk: ESA, 623
Lutz, D., et al. 1996, A&A, 315, L269
Lutz, D., et al. 1998, ApJ, 505, L103
Lutz, D., Veilleux, S., & Genzel, R. 1999, ApJ, 517, L13
Maoz, D., et al. 1998, AJ, 116, 55
Marconi, A., et al. 1994, A&A, 291, 18
Morse, J. A., Raymond, J. C., & Wilson, A. S. 1996, PASP, 108, 426
Nicholson, K. L., et al. 1998, MNRAS, 300, 893
Oliva, E., & Moorwood, A. F. M. 1990, ApJ, 348, L5
Oliva, E., et al. 1994, A&A, 288, 457
Osterbrock, D. E. 1989, Astrophysics of Gaseous Nebulae and Active Galactic Nuclei, University Science Books
Osterbrock, D. E., Tran, H. D., & Veilleux, S. 1992, ApJ, 389, 196
Rigopoulou, D., et al. 1999, AJ, 118, 262
Rix, H.-W., et al. 1990, ApJ, 363, 480
Robert, C., Leitherer, C., & Heckman, T. M. 1993, ApJ, 418, 749
Roche, P. F., et al. 1984, MNRAS, 207, 35
Roche, P. F., et al. 1991, MNRAS, 248, 606
Röttgering, H.J.A., et al. 1997, A&A, 326, 505
Ruiz, M., Rieke, G. H., & Schmidt, G. D. 1994, ApJ, 423, 608
Shuder, J. M. 1981, ApJ, 244, 12
Solomon, P. M., Downes, D., Radford, S. J. E., Barrett, J. W. 1997, ApJ, 478, 144
Spinoglio, L., & Malkan, M. A. 1992, ApJ, 399, 504
Sutherland, R. S., Bicknell, G. V., & Dopita, M. A. 1993, ApJ, 414, 510
Thompson, R. I. 1995, ApJ, 445, 700
——. 1996, ApJ, 459, L61
Tran, Q. D., et al. 2001, ApJ, 552, 527
Veilleux, S. 2000, in the proceedings of the Ringberg meeting “Starbursts – Near and Far”, September 2000, in press (astro-ph/0012121)
Veilleux, S. 2001, in the proceedings of the Granada meeting “QSO Hosts and their Environments”, January 2001, in press (astro-ph/0104401)
Veilleux, S., et al. 1994, ApJ, 433, 48
Veilleux, S., Goodrich, R. W., & Hill, G. J. 1997a, ApJ, 477, 631
Veilleux, S., et al. 1995, ApJS, 98, 171
Veilleux, S., Kim, D.-C., & Sanders, D. B. 1999a, ApJ, 522, 113
Veilleux, S., et al. 2002, ApJ, in press
Veilleux, S., & Osterbrock, D. E. 1987, ApJS, 63, 295
Veilleux, S., Sanders, D. B., Kim, D.-C. 1997b, ApJ, 484, 92
Veilleux, S., Sanders, D. B., Kim, D.-C. 1999b, ApJ, 522, 139
Villar-Martin, M., Binette, L., & Fosbury, R. A. E. 1996, A&A, 312, 751
Villar-Martin, M., et al. 1999, A&A, 351, 47
Voit, G. M. 1992, ApJ, 399, 495
Watson, D. M., et al. 1984, ApJ, 279, L1
Yee, H. K. C. 1980, ApJ, 241, 894
Young, S., et al. 1993, MNRAS, 260, L1