CHANDRA Discovery of a 300 kpc X-ray Jet
in the GPS Quasar PKS 1127-145
Abstract
We have discovered an X-ray jet with Chandra imaging of the =1.187 radio-loud quasar PKS 1127-145. In this paper we present the Chandra X-ray data, follow-up VLA observations, and optical imaging using the HST WFPC2. The X-ray jet contains 273 net counts in 27 ksec and extends from the quasar core, corresponding to a minimum projected linear size of kpc. The evaluation of the X-ray emission processes is complicated by the observed offsets between X-ray and radio brightness peaks. We discuss the problems posed by these observations to jet models. In addition, PKS 1127-145 is a Giga-Hertz Peaked Spectrum radio source, a member of the class of radio sources suspected to be young or “frustrated” versions of FRI radio galaxies. However the discovery of an X-ray and radio jet extending well outside the host galaxy of PKS 1127-145 suggests that activity in this and other GPS sources may be long-lived and complex.
1 Introduction
The unprecedented sub-arcsecond resolution (Van Speybroeck et al, 1997) of the Chandra X-ray Observatory (Weisskopf & O’Dell 1997) gives us, for the first time, the opportunity to study details of the X-ray structures associated with distant galaxies and quasars. Jets observed in Galactic and extragalactic sources are still not well understood and before the Chandra launch only a handful of nearby sources were known to have X-ray emission associated with their radio jets (e.g. Harris 2001). Chandra has uncovered many X-ray jets with complex structure on arcsec scales (e.g. Marshall et al 2001a,b, Chartas et al 2000, Schwartz et al 2000) in sources up to =0.6.
PKS 1127-145 is a higher redshift quasar (=1.187) with a GigaHertz peaked radio spectrum (GPS, Stanghellini et al., 1998), intervening damped Lyman- (Bergeron & Boisse, 1991) and HI 21-cm absorption, both at redshift z=0.312 (Lane et al., 1998). We observed PKS 1127-145 with the Chandra X-ray Observatory, in order to study in detail the quasar X-ray spectrum and the nature of the absorber (Bechtold et al. 2001), but were immediately struck by the presence of a 30 long, one-sided X-ray jet. At the quasar redshift a 30 separation implies that the X-ray emitting jet material is at least kpc from the central engine which creates the jet. If the jet is not in the plane of the sky the physical distance will be even larger, quite possibly a Megaparsec or more.
The radio spectrum of the core of PKS 1127-145 places it in the GPS class of radio sources (O’Dea 1998) and the extended radio structure in PKS 1127-145 is weak, only 0.1-0.4 of the core emission (Sec.3.2). This is much less than a typical large scale emission of FRI or FRII galaxies, where the lobes can dominate or be comparable to the core brightness (Kellerman & Owen 1988). Because GPS sources generally show very compact radio morphology ( 1kpc), they have been interpreted as either young counterparts of FRI radio galaxies (Phillips & Mutel 1982), or as “frustrated” AGN (van Breugel 1984, O’Dea 1998), in which the radio jets are not able to penetrate the host galaxy’s gas and dust. There are just a few examples of the GPS galaxies with a very faint Mpc scale radio structures (Schoenmakers 1999), which are interpreted as relics of the source past activity. PKS 1127-145 is the first example of a GPS quasar with large scale X-ray emission associated with the faint radio structure.
In this paper we present the Chandra X-ray imaging data, as well as the results of our follow-up VLA and HST/WFPC2 observations of PKS 1127-145. We then discuss the jet morphology and possible emission processes, and conclude by considering implications of the large scale X-ray jet on the origin and evolution of GPS sources.
The main results of our observations are (1) the discovery of the large scale X-ray jet in a GPS quasar; (2) improved morphology and frequency coverage of the weak radio jet; and (3) the detection of displacements of the peak brightnesses between the radio and X-ray emission in the knots, such that the X-ray precedes the radio emission moving outward along the jet.
We assume H0=50 km s-1 Mpc-1, q0=0 throughout the paper, so 1 corresponds to 11.5 kpc at the quasar redshift.
2 The Observations
2.1 Chandra X-ray Data
We observed PKS 1127-145 for 27,358 seconds with the spectroscopic array of the Advanced CCD Imaging Spectrometer (ACIS-S, Garmire et al, in preparation; Weisskopf et al. 1996) on 2000 May 28 (ObsID 866) without any transmission grating in place. The source was located on the back illuminated chip (S3) and offset by from the default aim point position to avoid the node boundary (Chandra Proposers’ Observatory Guide, POG, 2000). The 1/8 subarray mode with a 0.43 second frame time was chosen to mitigate pile-up, leading to a 1x8 image. The X-ray position of the quasar (J2000: 11:30:07.03, -14:49:27.32) agrees with the optical position (Johnston et al 1995) to better than 1, as expected given the quality of the Chandra aspect solution (Aldcroft et al 2000). We used CIAO (version 2.1; http://asc.harvard.edu/ciao/) software to analyze the data.
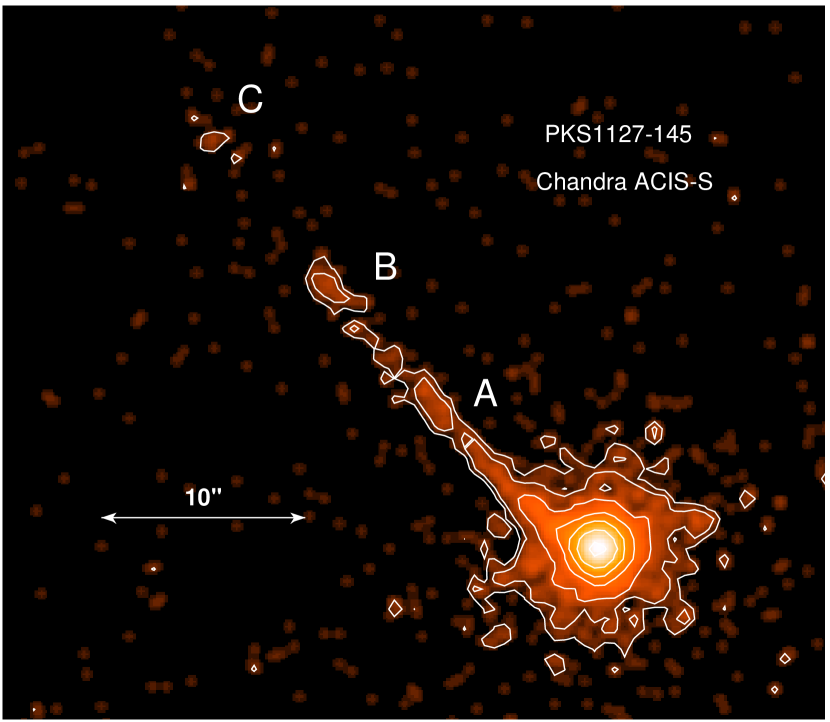
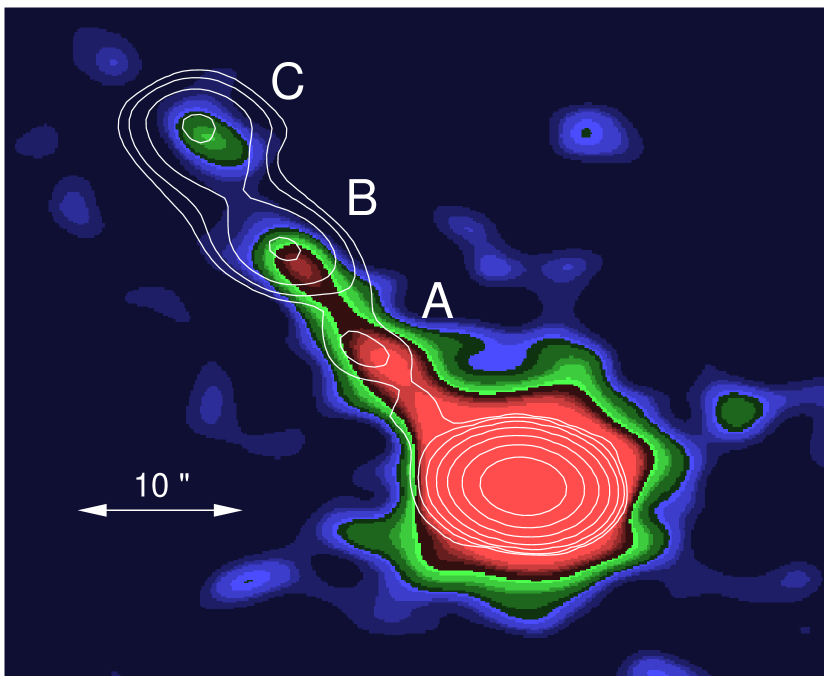
A smoothed image of PKS 1127-145 and its associated jet is shown in Figure 1. The intensity has been scaled logarithmically to emphasize the faint jet emission. The small Chandra Point Spread Function (PSF), especially the low power in the scattering wings (), allows for a high dynamic range image, which is essential to the detection of the jet (Figure 1). A total of 16,573 counts was detected in the quasar core, so the total jet emission is times fainter than the core (see Section 3.1.3) and the individual components are as weak as times the core. The details of the spectral analysis of the central source are reported elsewhere (Bechtold et al. 2001). Chandra ACIS-S3 data were reprocessed with the pipeline version R4CU5UPD13.3 on Jan.24, 2001. We have used the reprocessed data and calibration files available in CALDB v.2.1. We note that the aspect uncertainty on the absolute position is less than and the uncertainty on the image reconstruction is less than (Aldcroft et al 2001). The PSF FWHM at the quasar core is about .
In addition to the standard CXC processing we have corrected the events in the ACIS readout streak (Chandra POG, 2000) using the CIAO acisreadcor tool assuming a uniform background over the entire chip. This correction moves the events in the readout streak into the core region and does not affect the jet analysis. The corrected image was used only to create a smoothed version of the image. We used the original event file for the analysis of the jet emission and morphology.
We have used the readout streak photons to estimate the pile-up fraction in the data. We have extracted readout streak photons assuming two box regions 4 pixels wide along the streak, excluding the circular region with 6.5 radius centered on the core. The count rate in the readout streak is 0.073 cts/frame which gives a pile-up fraction of 2-3 in this observation (Chandra POG, 2000).
2.2 VLA Radio Data
At the time of the Chandra discovery of the X-ray jet in PKS 1127-145, the only reported radio detection of the weak kpc jet was that in the thesis of Rusk (1988). Archival VLA data consisted mainly of short observations (PKS1127-145 is a standard VLA calibrator source) and maps from these data did not have sufficient dynamic range to detect the kiloparsec jet. VLBI results for the core have been published by Wehrle et al. (1992) and further monitoring data have been accumulated at 2 cm by Kellermann et al. (http://www.cv.nrao.edu/2cmsurvey/). The Brandeis group has also recently obtained VLBA polarization maps at 8.4 GHz (Homan and Wardle, private communication). All these data show a quasi equal E-W double separated by about 4 mas plus weaker structure in a jet bending off to the NW with a total extent of about 20 mas.
Our new data were obtained at 1.4 and 8.4 GHz at the VLA111The National Radio Astronomy Observatory is a facility of the National Science Foundation operated under cooperative agreement by Associated Universities, Inc. on 2001 Feb 6-7 (program AH730). The observations were made in the BnA configuration for 8 hours with on source times of 2.1 hr at 1.4 GHz and 3.7 hr at 8.4 GHz, and 50 MHz bandwidth. The source is strong and residual baseline errors may degrade performance. Two scans of 3C286 were obtained for the flux density scale (S(1.4)=5.46 Jy and S(8.4)=3.426 Jy) and polarization position angle calibration and 3C138 was observed once to check the polarization solution: position angles were within 6∘ of the expected value. The rms errors in our reported measurements are equal to 0.12 mJy, which is higher than the theoretical errors for each band.
Although we observed a secondary phase calibrator for backup, our reductions relied on self calibration since the unresolved core is of order 100 times brighter than peak intensities of the kpc jet. The final pass of selfcal included clean components from the knots as well as the core and reached dynamic ranges (except for the regions directly north and south of the core) of 20,000 (1.4 GHz) and 65,000 (8.4 GHz).
2.3 HST/WFPC2 Observations and Data Reduction
We observed PKS 1127-145 and its environs with the HST WFPC2 for a total of 8800 seconds. The first half of the data were obtained on 2001 May 23, and the other half of the data on 2001 August 1. The F814W filter, which approximates the Johnson-Cousins I-band filter, was selected to optimally detect galaxies in the vicinity of the bright quasar. PKS 1127-145 was placed near the center of the WF3 camera. The images were calibrated by the HST standard processing pipeline, including the standard reduction steps of bias subtraction, dark current subtraction, and flat-fielding (Holtzman et al. 1995).
The eight raw images were combined into a final clean image using standard tasks within IRAF. First, the images were aligned to a common roll angle using the task MSCIMAGE in the MSCRED package. This is necessary because the observations were taken at two different epochs with substantially different roll angles. Next, the images were combined and cleaned of cosmic rays using IMCOMBINE.
3 Analysis
3.1 X-ray Jet
3.1.1 X-ray jet Morphology
The jet-like emission at PA extends up to away from the core. The outer jet does not point directly at the core, but instead the X-ray jet changes its position angle starting at 64∘ 2 from the core and ending with PA=43∘ at the outermost knot 27 from the core.
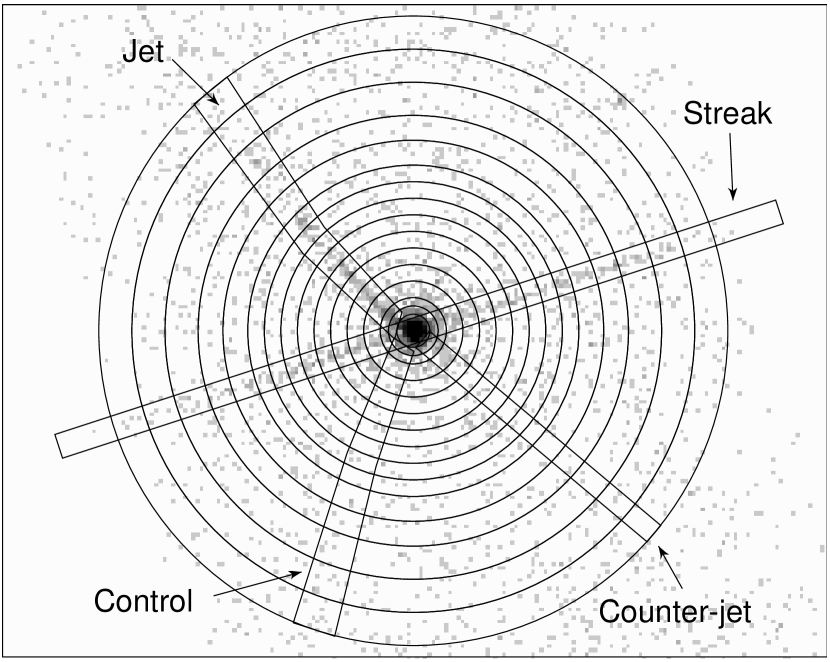
Figure 2 shows the central (80x80) of the event file with 2 prominent readout streaks in position angles PA110/290 degrees. We extracted radial profiles for the jet and possible counter-jet using the regions shown in Figure 2. For test purposes we also extracted a control profile with the same geometry as the jet, but at a position angle expected to be free of jet emission and instrumental features. The profiles are shown in Figure 3. Continuous jet emission is detected to about 22 from the core, where it drops and then reappears at distance. Three knots can be distinguished in the jet: A(), B() and C( from the core). The jet is resolved transversely with a size of order 1.5-2 and the size of the knots along the jet 2.5-3.5. The knots correspond roughly to the VLA radio knots, but the peak brightnesses of the radio and X-ray emission do not match exactly (Sec.3.4).
The physical distance from the nucleus to the end of knot B is about 255 (sin kpc, where is the jet angle to the line of sight. The physical distance from the nucleus to the outer knot C is (sin kpc.
There is no detection of a counter-jet. Using the observed counts in the jet, counter-jet and background regions we derive a lower limit of 5:1 (90 confidence) on the flux ratio between jet and counter-jet. This indicates that we see the jet at an angle smaller than 11∘ (assuming normal relativistic beaming, Rybicki & Lightman 1979). This corresponds to a jet of 1.5 Mpc. This estimate is based on the assumption that the jet is straight, however, PKS 1127-145 jet curves and the above number should be treated as an order of magnitude estimate. If the angle is larger at large distances then the jet overall length is smaller.
It should be noted that the counter-jet profile between 2 from the core shows evidence for a non-zero flux, in contrast to the central region. The likely explanation is a presence of a weak extended component on this scale (see Sec.3.3).


3.1.2 X-ray Jet Intensity & Spectrum
We have extracted 368 total counts (with dmextract) from the Chandra event file (evt2) using the polygonal region which starts 2 from the central core and contains the jet as shown in Fig.2. The background was extracted using the largest annulus (with inner and outer radii equal to 3 and 37 respectively) excluding the core, the readout streaks and the jet polygon. Instrument response files were calculated using mkrmf and mkarf tools and CALDB 2.1. We fit the jet spectral data in Sherpa (CIAO2.1) including only the energy range within 0.3-7 keV. We excluded the energies above 7 keV where the ACIS background rises (see calibration information on the CXC Web page http://asc.harvard.edu/cal/). We assumed a simple power law model with fixed Galactic absorption (cm-2, Murphy et al 1996) to fit the data. The best fit photon index was with a total flux over 2-10 keV range of erg cm-2 sec-1. We fit the data and the background simultaneously using the C statistic (Cash 1979), giving a statistic of C=1123.1 for the best fit model. This corresponds to of 62.2(48 d.o.f.) for binned data.
The corresponding isotropic luminosity within the 2-10 keV band is equal to erg sec-1.
We have also extracted counts for the three individual knots assuming elliptical regions. The ellipse sizes increase outwards as the knot emission becomes more extended: knot A:1.5x2.6, B: 1.7x3.3, C: 2.x3.8. The total and net counts as well as hardness ratios for each knot are presented in Table 1. We also calculated the 2-10 keV flux for each knot assuming a fixed power law index of 1.5 and fit for normalization (Fig.4). The flux for each knot decreases with the distance from the core.
3.2 Radio Emission.
3.2.1 Radio Morphology
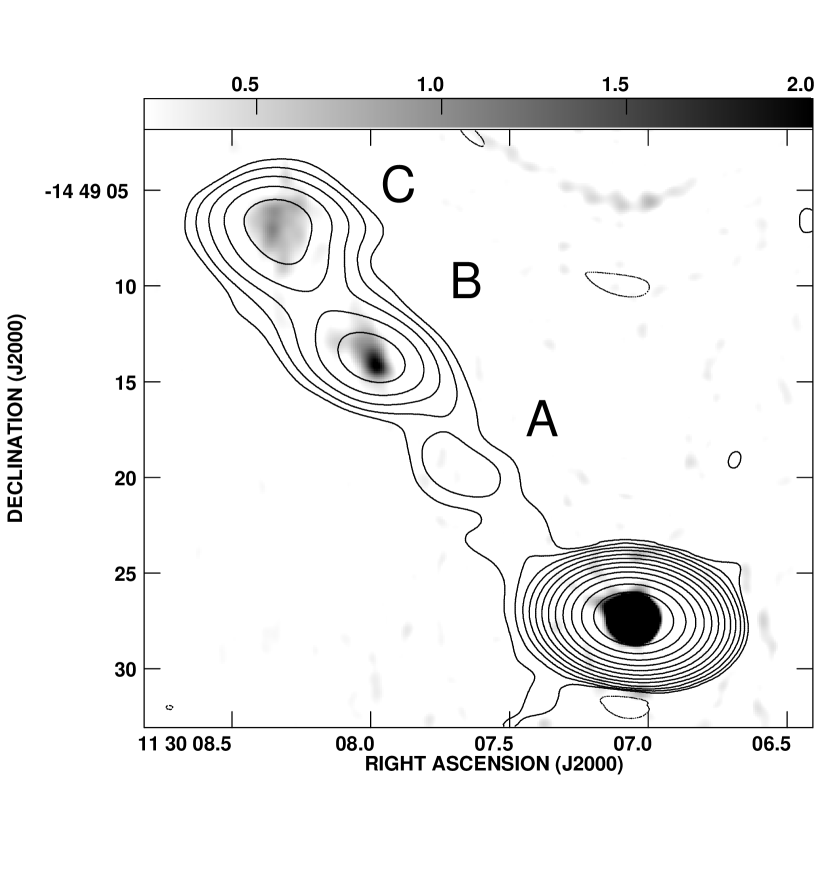
The basic structure of the radio emission is shown in Figure 5, which is a grey scale image of the 8.4 GHz map together with superimposed contours from the 1.4 GHz data. At our resolution, we distinguish 3 brightness enhancements (‘knots’) in the jet-like structure. As in the X-ray data, we denote the well separated knots as A, B and the outer one as C. At 8.4 GHz we also detect a short section of the inner jet which can be traced from 1′′ to 2′′ from the core (see Section 3.3).
At 1.4 GHz, all three knots are resolved and typical deconvolved dimensions from 2D Gaussian fitting in AIPS are of order 3′′ to 5′′ along the jet and 1′′ to 2′′ in the transverse direction. Knot A is the weakest of the three knots. Knots B and C are much stronger and more diffuse. Overall, it is evident that the radio jet is curved (PA changes from 64∘ at the core to 43∘ at knot C), in a way closely similar to the X-ray jet.
At 8.4 GHz the structures of knots B and C are well resolved and show complex morphology, but knot A is not detected at this frequency. The two outer knots are well separated from one another and there is no detected emission connecting the knots with the core. Because the physical size of the resolved knots is of order 20-30 kpc they could be lobes rather than jet knots. Deeper observations at this frequency or higher resolution data at lower frequency are needed to discriminate these possibilities. Note also that usually two lobes are observed on opposite sides of the core, but we do not see any radio structures on the other side. In the following analysis we assume that the observed radio structures are features of the jet.
3.2.2 Radio Intensities
Flux densities were measured by fitting the peak intensities of features, by integrating in a box around each feature, and by performing a 2D Gaussian fit. The values presented in Table 1 are integrated flux densities primarily based on the box measurements as the best measure of the actual integrated intensity. The box sizes are given in Table 1.

The values in Table 1 show that the radio intensities of the knots increase outward, in contrast to the X-ray intensities which decrease outward (see also Figure 4). This behavior was also observed in the 3C 273 jet (Marshall et al. 2001).
3.3 X-ray structure in the Central 3 region
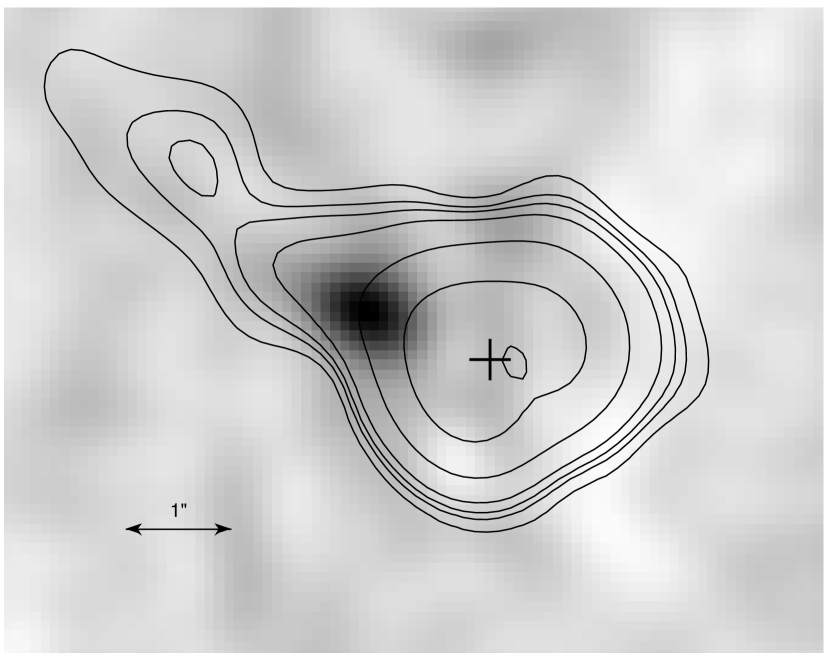
We have analyzed the central region of PKS 1127-145 and searched for emission from the inner jet corresponding to that seen in the radio. We constructed the PSF at the source location using the PSF library (F1 in CALDB 2.1). We also extracted a calibration source from the archive, the quasar PG 1634+706 (ObsID 69), with similar X-ray spectral properties, but without obvious extended emission. We scaled and subtracted the PSF and the quasar profiles from PKS 1127-145 core (using both CIAO and AIPS) and analyzed the residuals for any significant excess.
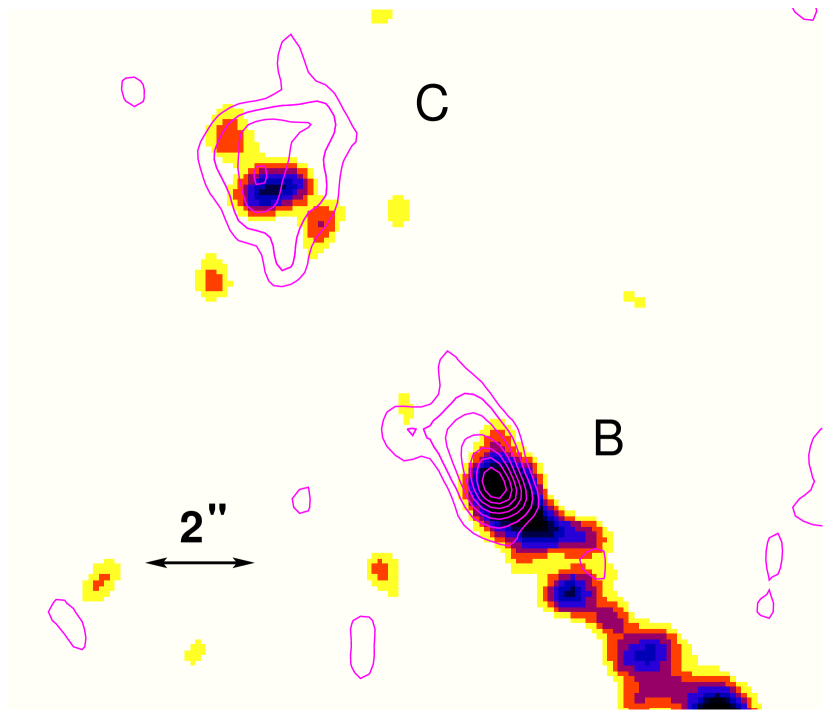
Figure 6 shows the contours of the X-rays residuals, after subtracting the PSF from the core, overlayed on the grey scale of the radio (8.4 GHz) residuals. The excess of the X-ray emission, located from the core at PA=64∘, corresponds to the excess of the radio emission. The PA is consistent with the jet emission seen on the VLBI scale (Jorstad et al 2001a, 2001b). The X-ray excess contains 56 net counts, after subtracting a background extracted from an annulus with radii between 1-2.2 and excluding a circular region at the inner knot. The inner knot spectrum is soft compared to the outer knots (although the uncertainties are larger) with a best fit photon index corresponding to a 2-10 keV flux of 5.26 ergs cm-2 s-1 (fixing NH at the Galactic value, 3.89atoms cm-2). The photon index of the inner jet knot is affected by the core background radiation, since the photon index of the core emission is much harder with and is absorbed (Bechtold et al 2001).
3.4 Comparison of X-ray and Radio Jets
Figure 7a shows the Chandra X-ray image (color scale) smoothed to resolution in order to match the 1.4 GHz beam size overlayed with the contours from the 1.4 GHz VLA radio map. The X-ray and radio jet emission are co-extensive. There is also a general correspondence in the sense of alignment of the jet features, but it is obvious that we do not have detailed agreement. The peak brightness of the X-ray emission precedes the peak of the 1.4 GHz emission for each knot by about (see Table 2) corresponding to 8-20 kpc at the quasar redshift.
These 2.6 offsets are not due to astrometric differences between the X-ray and radio images. The peaks of the X-ray and radio core emissions have been aligned, and the aspect uncertainty in the X-ray image is in any case of order .
The offsets can be critical in constraining jet emission models (see Sec. 4). However, the analysis of the emission processes are complicated, because there is no detailed correspondence between the radio and X-ray emitting regions. Table 1 contains the total flux densities for each knot measured in radio and X-rays independently. In Table 3 we included only the flux densities which were obtained for the same regions in radio and X-rays. We first defined the X-ray regions and then measured the corresponding (to that region) radio flux density. We used these flux densities in calculating the model parameters.
Figure 7b presents the smoothed X-ray and 8.4 GHz data at 0.8 resolution. This higher resolution radio emission shows more complex structure than the X-ray emission at this resolution. There is no radio emission at this frequency associated with the continuous X-ray jet emission coming directly from the core nor is knot A detected at this frequency, while it is the strongest X-ray knot. The two outer knots, B and C, dominate the radio emission. The X-ray emission in knot C is more compact and narrow along the jet direction than the radio. Also for knot B and C the strongest X-ray emission is upstream of the bulk of the radio emission.
Overall the X-ray emission declines with the distance from the core and is strongest for knot A, which is weak and barely detected in radio (see Figure 4).
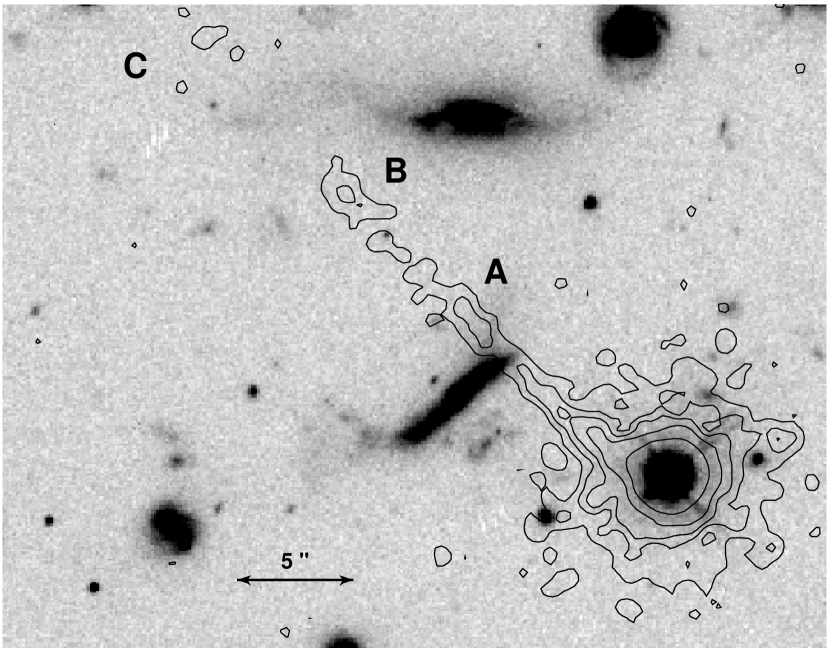


3.5 Search for optical jet counterparts
Figure 8 contains the HST/WFPC2 image with X-ray contours overlayed, showing that there is no obvious optical counterpart to the X-ray/radio jet in PKS 1127-145. This image also shows that the field surrounding PKS 1127-145 is rich with galaxies. Nestor et al. (2001) obtained Keck spectroscopy of the nearby galaxies and found a redshift of 0.312 for several of them, indicating the presence of a foreground galaxy group or cluster at this redshift, although there is no obvious optical group or cluster present in our data.
As seen in Figure 8, detection of an optical counterpart to the X-ray jet (and knot A in particular) is hampered by structure in the foreground galaxies. Nevertheless, we can calculate useful upper limits to optical emission for knots B and C. This was done by summing the counts in precisely the same source regions used to extract the radio and X-ray fluxes (see Table 3). The regions for background subtraction were boxes surrounding the knot regions, with the source and any point sources excluded. For both knots, the net counts are consistent with zero, and we report 3- upper limits. For knot B, erg cm-2 s-1 Hz-1, and for knot C, erg cm-2 s-1 Hz-1. The limits in instrument counts were converted to fluxes using the formulas and tables Chapter 6 of the WFPC2 Instrument Handbook Version 6.0 (Biretta et al. 2001)
4 Jet X-ray Emission Processes
Several emission processes are potentially responsible for the jet X-ray emission: synchrotron, synchrotron self-compton (SSC), external inverse compton (EIC) models, and thermal. In this section we attempt to reconcile the observed data with each of these model processes and discuss the results.
Table 3 summarizes the input parameters used in the modeling of the jet emission. Because the X-ray and radio emission regions of PKS 1127-145 are not quite the same we chose the regions based on the X-ray emission first and then measured the radio flux densities for those regions. Table 3 defines the regions for each knot. We also included a 10.2 box region to measure the continuous emission along the jet in the vicinity of knot A.
4.1 Thermal radiation
We can rule out the possibility of the jet X-ray emission arising from hot thermal plasma associated with the knots, since the required particle densities (0.1-0.3 atoms cm-3) and total mass (2-20M⊙) required to generate the observed X-ray luminosities are very unlikely to be found at great distances from the quasar core (see Table 3).
4.2 Synchrotron Emission
Synchrotron X-ray emission requires moderate magnetic fields (BG) and highly relativistic particles (, where is the Lorentz factor of the relativistic electrons) to be present at the emission site. Such highly relativistic electrons have short timescales for energy losses due to synchrotron or Compton radiation ( years depending on the magnetic field) implying that the electron acceleration and synchrotron emission must occur in the same region. Therefore the radio and X-ray emission regions should be coincident to l-yr, if synchrotron or SSC emission is responsible for the X-rays. However, the radio and X-ray peak brightnesses in PKS 1127-145 are shifted by large distances ( kpc) and the regions of the strong X-ray emission do not exactly coincide with the radio emitting regions. There are also regions of X-ray emission with no corresponding radio emission (see Figure 7). This argues against a simple synchrotron model and would require that the electron spectrum is flat with the index (where nd, , and ).
Synchrotron emission results in a continuous spectrum between radio and X-ray bands, therefore a second critical constraint for this model comes from the deep optical imaging. Our HST/WFPC data give upper limits for the emission from knots B and C (see Figure 9). This limit is in agreement with a simple extrapolation between the radio and X-ray emission consistent with the synchrotron emission for knot C, but requires a clear spectral break in the optical band for knot B (Fig. 9). A presence of this break suggests that a simple synchrotron model cannot explain the X-ray emission. A flatter spectral component is required if X-rays were to be a result of synchrotron emission for knot B. Also more complex synchrotron models are possible.
4.3 SSC emission
In the SSC process the synchrotron photons generated by the relativistic jet electrons are Compton scattered by the same electrons, gaining a factor of in energy. If the mean electron energy is of order then photon energies (frequency) are increased by a factor of 108, so radio photons (109-1011Hz) become X-ray photons (10Hz). The observed energy density of the synchrotron photons in large scale jets is usually much too small to produce the observed X-rays for magnetic field strengths calculated for equipartition except in a few terminal hot spots (e.g. Cygnus A, Harris et al. 1994, Wilson et al 2001; 3C123, Hardcastle, Birkinshaw & Worrall 2001). The SSC model for X-ray jet emission in PKS 1127-145 can be ruled out because it predicts much lower (by factors of hundreds or more) X-ray luminosities than we observe (see in Table 3).
4.4 EIC/CMB model
The remaining possibility is external inverse Compton emission. In EIC models, the external photons are Compton scattered off the relativistic particles in the jet.
The source of external photons could be provided by the AGN itself, scattered light of the host galaxy or the Cosmic Microwave Background (CMB). If the jet extends over hundreds of kiloparsec from the nucleus, the external photons related to the AGN become less important than the background photons. Similarly, far from the optical galaxy (150-300(sin kpc) ambient starlight will have lower energy density than the Cosmic Microwave Background (CMB) radiation
We therefore considered CMB photons scattered off the radio emitting relativistic electrons for the source of the X-ray emission, as suggested by Cellotti et al (2001) and Tavecchio et al (2001) for the PKS 0637-752 jet (Schwartz et al 2000). If the jet was moving with significant bulk velocity, then in the jet frame the electrons experience an enhanced photon energy density (by a factor , where is the bulk Lorentz factor of the jet). IC losses then dominate over synchrotron losses. The photon energy density of the CMB at the redshift of PKS 1127-145 is 9.75erg cm-3 and the observed radio and X-ray flux ratios do not require high bulk velocities. Relatively low Lorentz factors, are then needed to obtain the observed X-ray flux (see Table 3, the model parameters were calculated using the formalism of Harris & Krawczynski 2002).
Note that the jet beaming model does not require the presence of highly relativistic synchrotron electrons, since electrons can scatter the CMB photons to the X-ray band. As a result the X-ray jet emission can be generated from an aged electron population resulting in much less radio emission than in the case of a stationary source. For PKS 1127-145 electrons which scatter CMB photons to keV produce 1 MHz radio emission (). This model allows then for the presence of the observed X-ray emission without detectable radio emission.
Both outer knots (B and C) have 8.4 GHz emission, while the jet continuous radio structure is not very prominent. The EIC/CMB X-ray jet emission indicates a presence of low energy electrons along the jet, but their energy is too low for synchrotron emission at the observed frequency. The 8.4 GHz structure suggests a production of higher energy electrons at the emission sites, thus a presence of a shock.
The observed radio emission could well be lobe emission rather than jet emission (see Sec.3.2). Although we used only radio flux from the observed areas emitting X-rays in our beaming calculations, if all of the radio emission associated with the outer features (A, B, and C) arises from a lobe or cocoon around the (X-ray) jet, the actual beaming parameters reported in Table 3 would not be accurate since we would have no information on the synchrotron component of the jet emission. With our failure to detect any counter jet (or counter lobe), we would have a source with much the same problem as that encountered in explaining the larger radio structures of the 3C 273 jet: if the predominant radio structure is a cocoon around the optical/X-ray jet, why is the lobe on the other side not detected? can one sided lobe be due to the voids or filaments in the IGM?
5 Discussion.
5.1 Jet models.
We can consider the morphology of X-ray jets in terms of brightness contrast along the jet. At one extreme is the inner X-ray jet of Pictor A which appears essentially continuous and smooth (Wilson, Young & Shopbell 2001, Marshall et al 2001); and at the other extreme is the jet of M87 for which knot A dominates to such an extent that its emission rivals that of the core (Biretta, Stern & Harris 1991). While it is true that the Chandra physical resolution of the PKS 1127-145 jet is only 8-10 kpc (cf. 1 kpc for Pictor A, Wilson et al 2001, and 100 pc for M87 jet, Marshall et al 2001), the X-ray jet emission of PKS 1127-145 has only modest brightness enhancements (factor , Fig.3), perhaps not really sufficient to define discrete knots. Some of the X-ray knot structure may be due to patchy foreground absorption. The foreground galaxy (Fig.8) may absorb X-rays sufficiently to artificially separate knot A from the inner jet. A column density of 1022 atoms cm-2 would depress the observed flux by the necessary factor of 2 (for an assumed photon index of ), although this column seems too large for such an extended region, where column densities of atoms cm-2 are more likely (e.g. in damped Lyman alpha systems, Wolfe 1988). For a steeper photon index () a column density of atoms cm-2 is enough to obtain the required reduction in flux. Note that PKS 1127-145 has damped Lyman alpha system in the optical spectrum (Lane et al 1998).
For knots A and B, the brightest parts of the radio emission occur downstream of the peak X-ray brightness and the brightest radio region of knot C appears to form an outer cocoon around the X-ray knot C (Figure 6b). In both outer knots (B and C) the radio emission extends further out along the jet in a manner reminiscent of the end of the 3C 273 jet (Marshall et al 2001). Knot B lies at the end of a continuous region of X-ray emission.
Knot A is not detected at 8.4 GHz. The steep implied radio spectrum suggests that it has a different electron energy distribution than the other two knots, B and C. This could be a result of a weaker shock acceleration than in the other two knots. Also it is possible that this is a location of past shock activity and we now see only low energy particles with the longer lifetime than the higher energy particles. The energy losses are mostly due to the synchrotron and Inverse Compton process and for electrons with these timescales are longer than 10 years.
We concluded in Sec.4 that thermal and SSC models are unlikely. While a synchrotron model is possible for knot C, a simple synchrotron emission cannot explain knot B emission. Instead EIC beaming models using the CMB as a source of photons can easily accommodate the observations. The modest beaming parameters are a result of the fact that even for stationary sources, the energy density of the microwave background increases with redshift as and so is 22.8 times greater at the PKS 1127-145 redshift than locally. If EIC is responsible for the X-ray emission, then the average ratio of X-ray to radio luminosities for jets should increase with redshift. Such statistical studies will be possible in the future when more X-ray jets become available from Chandra observations.
PKS 1127-145 jet is the longest X-ray jet detected at high redshift. It is difficult to compare its structure and emission properties to the nearby jets discovered recently with Chandra. Note that typical physical sizes of the resolved X-ray structures in our source are of the order of 10-15 kpc (projected on the sky), much larger than the structures seen in 3C 273 or M87 (Marshall et al 2001a, 2001b). Synchrotron emission is most likely responsible for the jet X-ray emission in these two nearby sources, but their projected X-ray jets are rather small in comparison to PKS 1127-145 (0.1-70 kpc vs. 330 kpc). Knot A in PKS 1127-145 is at kpc from the nucleus, while the entire 3C 273 jet is well within that distance. It is not surprising that emission processes might be different.
At high redshift the energy density of the CMB increases and enhances IC losses relative to synchrotron losses. This allows for X-ray emission even if there is no steady supply of highly relativistic synchrotron electrons. Thus at high redshift X-ray emission at large distance from the nucleus can be easily dominated by EIC, while at lower redshift synchrotron or SSC dominate. At intermediate redshift of PKS 0637-752 (z=0.653) the dominant process is not clear, although equipartition argument suggests that EIC/CMB wins (Tavecchio et al 2000, Celotti et al 2001). PKS 1127-145 is probably the most promising example of the X-ray emission arising from the interaction between CMB photons and the jet plasma.
5.2 GPS Sources.
The detection of a large scale (300 kpc) X-ray jet in PKS 1127-145 has some interesting implications for our understanding of the nature of Giga-Hertz Peaked Spectrum (GPS) sources. These powerful radio emitters ( W Hz-1) are characterized by convex radio spectra which peak around GHz. They have a similar morphology to the large (100 kpc – 1 Mpc) FRI/FRII radio galaxies but are much more compact with projected total sizes of less than kpc). Some GPS sources exhibit very faint extended radio emission on scales larger than the size of the host galaxy (Baum et al 1990, Stanghellini et al 1990, O’Dea 1998, Fanti et al 2001), but only a few GPS galaxies show faint radio structures on Mpc scales (Schoenmakers et al 1999).
There are three different explanations of the nature of GPS sources. In one scenario the jet cannot escape the dense environment and the radio source is confined to a small central region (“frustrated” radio sources e.g. van Breugel, Miley & Heckman et al 1984, O’Dea, Baum & Stanghellini, 1991). This is supported by X-ray observations which show associated absorption in several GPS quasars (Elvis et al 1994). Also Marr, Taylor and Crawford (2001) argue that the turn-over in the spectrum in 0108+388 can be due to free-free absorption if the gas is non-uniform within the central tens of parsecs.
In the second scenario the compact morphology of GPS sources is a result of their small age: GPS sources may be young versions of the large scale radio galaxies, so we observe them at an earlier stage of their expansion (Phillips & Mutel 1982). Supportive evidence for the young age of the GPS sources comes from the propagation velocities of the hot spots measured for several GPS sources (Owsianik & Conway 1998, Owsianik, Conway & Polatidis 1999, Tschager et al 2000). The average expansion velocities are typically of order 0.2 indicating kinematic age of years. In this model the large scale extended emission is usually interpreted as a relic of much older previous activity (0108+388 Baum et al 1990, Owsianik, Conway & Polatidis 1998, Marr et al 2001; Stanghellini et al 1990, Schoenmakers et al 1999), while the GPS “core” is young, maybe rejuvenated by the inflow of new matter from a recent merger or accretion disk instability (Siemiginowska, Czerny & Kostyunin 1996, Mineshige & Shields 1990).
The simple evolution scenario in which GPS sources evolve with constant luminosity and advance speed into large radio sources fails because of their large relative number (O’Dea 1998). They form at least 10 of the bright radio source population, while based on their lifetime they should be much less numerous (only 0.1). To explain the large number of GPS sources Reynolds & Begelman (1997) (also O’Dea & Baum 1997) suggested that extragalactic radio sources undergo intermittent periods of activity (with a duty cycle of 107 years): the radio jets and core are bright when the AGN is “on”, but when it turns off, the jet radio emission fades rapidly, although the jet structure remains intact and the matter keeps expanding. The large scale (100 kpc–1 Mpc) radio emission is a factor of weaker than at the time when the source was “on”, and so is hard to detect. Instead, the large scale X-ray emission reported here highlights the fact that if there are enough relativistic particles in the expanding plasma then the interaction between the particles and CMB photons results in the detectable X-ray emission. The X-rays can then be used for studying large scale “fossil” jet structure at high redshifts.
If GPS radio sources are young, with a short repetition timescale, we can use them to test models of quasar evolution. The most common scenario is one in which the quasar activity is linked to a merger event (e.g. Mihos & Hernquist 1996). This scenario could be tested by studying the rates of merging galaxies required by the number of newly rejuvenated GPS sources. Alternative physical models which link quasar activity with instabilities in the accretion disk (Hatziminaoglou, Siemiginowska & Elvis 2001, Siemiginowska & Elvis 1997) give a repetition timescale which scales roughly with the black hole mass (a timescale of 106 years corresponds to 108M⊙ for L erg s-1). A third option (Ciotti & Ostriker 2001) is a feedback mechanism in which the accreting source heats the ambient gas to the point at which the accretion stops (when the Compton temperature of the emitted radiation exceeds the virial temperature of the galactic gas). Accretion restarts after the gas has cooled. The outburst phase is short in comparison to the cooling phase. Studying the extended structures of the GPS sources can provide constraints on the length of the outburst phase and potential test for this model.
5.3 PKS 1127-145 as a GPS source.
GPS classification is based on the radio spectral properties, which results in a heterogeneous sample. GPS quasars often have a core-jet VLBI (milliarcsec) morphology, different from GPS radio galaxies, which have double components and a core (Stanghellini et al 2001). The core-jet morphology in the GPS quasars may suggest that the convex radio spectrum is due to beamed jet emission. Thus, often GPS quasars can be identified with blazars or core-dominated quasars, in contrast to GPS radio galaxies.
PKS 1127-145 has the properties of a GPS quasar (Stanghellini et al 1996), with low optical polarization (Impey & Tapia 1990), and it is not an optically violently variable source (Pica et al. 1988; Bozyan, Hemenway, & Argue 1990). VLBI observations show the presence of a double component with the parsec scale jet on one side (Wehrle et al 1992, Stanghellini et al. 1998). The core emission also dominates in X-rays and the X-ray knot emission is only of the order of 0.1-0.2% of the core emission. Although it has been tentatively identified as an EGRET source, suggesting a blazar nature, the radio source lies outside the 99 EGRET error region (Hartmann et al 1999). The optical spectrum does not provide any signatures of a blazar nature, rather it has a typical quasar continuum shape with broad emission lines and absorption features (Bechtold et al 2001).
The classification of PKS 1127-145 as a GPS source, although the source has been included in the O’Dea (1998) sample, is still not certain. The age of the GPS source can only be determined through propagation velocities of the hot spots within the core, as has been done for several nearby sources (Owsianik et al 1999, Fanti 2000). Unfortunately this technique is impractical for high redshift sources. VLBI measurements could monitor variability of the central components and characteristic timescales within the central region. If the source is a blazar, then the jet indicates beaming of the central core. Improved high energy X-ray (E keV) and -ray observations could provide clues to a possible blazar nature of the source.
6 Summary
Our results can be summarized as follows:
-
•
We have observed PKS 1127-145 for 27 ksec with Chandra and detect an X-ray jet with a minimum length of 330 kpc.
-
•
Comparison of X-ray, optical and radio data of the PKS 1127-145 jet rules out thermal emission, SSC and a simple direct synchrotron emission as primary source of the X-ray jet emission.
-
•
Inverse Compton scattering off CMB photons with moderate jet bulk velocities can readily accommodate the observations and so is the most probable emission mechanism.
-
•
The EIC/CMB process is especially effective at high redshift because of the scaling of the CMB. X-rays from EIC can trace low energy () population of particles which are not detectable in the radio band and also delineate the “fossil jet” structure.
References
- (1) Aldcroft, T.L., Karovska, M., Cresitello-Dittmar, M. L., Cameron, R.A., Markevitch, M.L., 2000, in Proc. SPIE Vol. 4012, p. 650-657, X-Ray Optics, Instruments, and Missions III, Joachim E. Truemper; Bernd Aschenbach, Eds.
- (2)
- (3) Baum, S. A.; O’Dea, C. P.; de Bruyn, A. G.; Murphy, D. W., 1990, A&A, 232, 19
- (4)
- (5) Bechtold, J., Siemiginowska, A., Aldcroft, T.L, Elvis, M., Dobrzycki, A., 2001, ApJ,562,133
- (6)
- (7) Bergeron, J. & Boisse,P. 1991, A&A, 243, 344
- (8)
- (9) Biretta,J.A., Sparks,W.B. & Macchetto, F. 1999, Ap.J.520, 621
- (10)
- (11) Biretta, J.A., Stern, C.P., and Harris, D.E. 1991 A.J., 101, 1632.
- (12)
- (13) Biretta et al. 2001, WFPC2 Instrument Handbook Version 6.0
- (14)
- (15) Bozyan,E.,P, Hemenway,P.D., & Argue, A.N., 1990, AJ, 99,1421
- (16)
- (17) van Breugel, W., Miley, G. & Heckman, T., 1984, AJ 89, 5
- (18)
- (19) Cash, W., 1976, A&A 52, 307
- (20)
- (21) Celotti,A., Ghisellini, G. & Chiaberge, M. 2001, MNRAS,321,1
- (22)
- (23) Chartas, G., Worrall, D. M., Birkinshaw, M.; Cresitello-Dittmar, M.; Cui, W.; Ghosh, K. K.; Harris, D. E.; Hooper, E. J.; Jauncey, D. L.; Kim, D.-W.; Lovell, J.; Mathur, S.; Schwartz, D. A.; Tingay, S. J.; Virani, S. N.; Wilkes, B. J., 2000, Ap.J., 542, 655
- (24)
- (25) Ciotti, L. & Ostriker, J.P., 2001, ApJ, 551, 131
- (26)
- (27) Elvis, M., Fiore,F., Wilkes, B., McDowell, J., Bechtold, J., 1994, Ap.J. 422, 60
- (28)
- (29) Harris, D.E., Krawczynski, H 2002, Ap.J in press (astro-ph/0109523)
- (30)
- (31) Harris, D. 2001, “Current Problems for X-ray Emission from Radio Jets”, in ’Particles and Fields in Radio Galaxies’, R. A. Laing and K. M. Blundell, editors. ASP Conference Series, in press.
- (32)
- (33) Harris, D. E.; Carilli, C. L.; Perley, R. A., 1994, Nature, 367,713
- (34)
- (35) Hardcastle, M.J., Birkinshaw, M. & Worrall,D.M., 2001, MNRAS in press (astro-ph/0101240)
- (36)
- (37) Hartman, R.C., et al 1999, ApJS, 123, 79
- (38)
- (39) Hatziminaoglou, Siemiginowska & Elvis 2001, ApJ, 547, 90
- (40)
- (41) Holtzman, J. A. et al. 1995, PASP, 107, 156
- (42)
- (43) Impey, C.D., & Tapia, S. 1990, ApJ.354,124
- (44)
- (45) Jorstad, S.G., Marscher, A.P., Mattox, J.R., Aller, M.F, Aller,H.D, Wehrle A.E., Bloom, S.D. 2001a, Ap.J.submitted (astro-ph/0102012)
- (46)
- (47) Jorstad, S.G., Marscher, A.P., Mattox, J.R., Wehrle A.E., Bloom, S.D., Yurchenko, A.V., 2001b, Ap.J.S in press (astro-ph/0101570)
- (48)
- (49) Johnston, K.J. et al 1995, AJ, 110,880
- (50)
- (51) Kallerman,K.I. & Owen, F.N., 1988, in “Galactic and Extragalactic Radio Astronomy” , Eds. Verschuur, G.L and Kallerman, K.I., Springer-Verlag, p.563
- (52)
- (53) Lane, W., Smette, A., Briggs, F., Rao, S., Turnshek, D., Meylan, G., 1998, AJ, 116, 26
- (54)
- (55) Marr. J.M, Taylor, G.B. & Crawford III, F., 2001, Ap.J. 550.160
- (56)
- (57) Marshall, H. L.; Harris, D. E.; Grimes, J. P.; Drake, J. J.; Fruscione, A.; Juda, M.; Kraft, R. P.; Mathur, S.; Murray, S. S.; Ogle, P. M.; Pease, D. O.; Schwartz, D. A.; Siemiginowska, A. L.; Vrtilek, S. D.; Wargelin, B. J, 2001a,ApJ., 549, L167
- (58)
- (59) H. L. Marshall, H. L., Miller, B. P., Davis, D. S., E. S. Perlman, E. S., Wise, M. Canizares, C.R., Harris, D.E., 2001b, Ap.J.Lett. in press (astro-ph/0109160).
- (60)
- (61) Murphy, E.M., Lockman, F.J., Laor, A. & Elvis,M., 1996, ApJS. 105,369
- (62)
- (63) Nestor, D.B., Rao, S.M., Turnshek, D.A, Monier, E., Lane, W., Bergeron, J., to appear in ASP Conference Series ”Extragalactic Gas at Low Redshift”, eds. J. Mulchaey and J. Stocke. (astro-ph/0108146)
- (64)
- (65) Mihos, J.C. & Hernquist, L., 1996, ApJ, 464,641
- (66)
- (67) Mineshige & Shields, G., 1990, Ap.J, 351,47
- (68)
- (69) O’Dea, C.P. 1998, PASP, 110, 493
- (70)
- (71) O’Dea, C.P., Baum, S.A., & Stanghellini,C., 1991, ApJ, 380,66
- (72)
- (73) Owsianik, I., & Conway, J.E. 1998, A&A, 337, 69
- (74)
- (75) Owsianik, I., Conway, J.E., & Polatidis, A.G.,1998, A&A, 336, 37
- (76)
- (77) Owsianik, I., Conway, J.E., & Polatidis, A.G., 1999, NewAR, 43, 669
- (78)
- (79) Tavecchio, F., Maraschi, L., Sambruna, R. M., Urry, C. M., 2000, Ap.J., 544, L23
- (80)
- (81) Tschager, W.; Schilizzi, R. T.; R ttgering, H. J. A.; Snellen, I. A. G.; Miley, G. K. et al 2000, A&A 360, 887
- (82)
- (83) Phillips, R.B., & Mutel, R.L. 1982, A&A, 106, 21
- (84)
- (85) Pica, Andrew J.; Smith, Alex G.; Webb, James R.; Leacock, Robert J.; Clements, Sandra; Gombola, Paul P., 1988AJ, 96, 1215
- (86)
- (87) Readhead, A.C., 1994, Ap.J., 426, 51
- (88)
- (89) Reynolds, C. & Begelman, M.,1997, Ap.J., 487, L135
- (90)
- (91) Rusk, R, 1988, PhD Thesis, University of Toronto
- (92)
- (93) Rybicki, G.B. & Lightman, A.P., “Radiative Processes in Astrophysics”, Wiley and Sons. Inc, 1979
- (94)
- (95) Schwartz, D.A, Marshall, H. L.; Lovell, J. E. J.; Piner, B. G.; Tingay, S. J.; Birkinshaw, M.; Chartas, G.; Elvis, M.; Feigelson, E. D.; Ghosh, K. K.; Harris, D. E.; Hirabayashi, H.; Hooper, E. J.; Jauncey, D. L.; Lanzetta, K. M.; Mathur, S.; Preston, R. A.; Tucker, W. H.; Virani, S.; Wilkes, B.; Worrall, D. M.,2000 ApJ, 540, 69
- (96)
- (97) Schoenmakers, A.P., de Bruyn A.G., Rottgering, H.J.A. & H.van der Laan, 1999, A&A 341, 44
- (98)
- (99) Siemiginowska, A., Czerny, B., & Kostyunin, V. 1996, ApJ, 458, 491
- (100)
- (101) Siemiginowska, A. & Elvis M., 1997, Ap.J.L.,482,9
- (102)
- (103) Snellen, I. A. G., Schilizzi, R. T., Miley, G. K., de Bruyn, A. G., Bremer, M. N., R ttgering, H. J. A. 2000, MNRAS, 319, 445
- (104)
- (105) Stanghellini, C., Dallacasa, D., O’Dea, C. P., Baum, S. A., Fanti, R., Fanti, C., 2001, A&A 377, 377
- (106)
- (107) Stanghellini, C., O’Dea, C. P., Dallacasa, D., Baum, S. A., Fanti, R., Fanti, C., 1998, A&A, 31, 303
- (108)
- (109) Stanghellini, C., Dallacasa, D., O’Dea, C. P., Baum, S. A., Fanti, R., & Fanti, C. 1996, in Proc. Second Workshop on Gigahertz Peaked-Spectrum and Compact Steep-Spectrum Radio Sources, ed. I. A. G. Snellen, R. T. Schilizzi, H. J. A. R ttgering, & M. N. Bremer (Leiden: Leiden Obs.), 4
- (110)
- (111) Stanghellini, C., Baum, S.A., O’Dea, C.P., Morris, G.B. 1990, A&A, 233,379
- (112)
- (113) Phillips, R.B. & Mutel, R.L., 1982, A&A, 106,21
- (114)
- (115) Tavecchio, F., Maraschi, L., Sambruna, R.M., Urry, M.C., 2000, ApJ, 544, L23
- (116)
- (117) Tingay,S.J., Murphy D.W. & Edwards,P.G., 1998, Ap.J.,500, 673
- (118)
- (119) Van Speybroeck, L.P, Jeriu, D.,Edgar, R.J., Gaetz, T.J., Zhao, P., Reid, P.B., 1997, in Proc. SPIE Vol. 3113, Grazing Incidence and Multilayer X-Ray Optical Systems, Richard B. Hoover; Arthur B. Walker; Eds. p. 89-104
- (120)
- (121) Weisskopf, M.C & O’Dell, S.L., 1997 Proc. SPIE Vol. 3113, Grazing Incidence and Multilayer X-Ray Optical Systems, Richard B. Hoover; Arthur B. Walker; Eds., p. 2-17
- (122)
- (123) Wilson, A.S., Young, A.J. & Shopbell, P.L. 2001, Ap.J., 546,
- (124)
- (125) Wehrle, A.E., Cohen, M.H., Unwin, S. C., Aller, H.D.; Aller, M.F., Nicolson, G., 1992. Ap.J., 391, 589
- (126)
- (127) Wolfe, A.M., 1988, in “QSO Absorption Lines. Probing the Universe”. Proceedings of the QSO Absorption Line Meeting, Baltimore, MD, May 19-21, 1987, Ed. Blades, J.C., Turnshek, D., Norman, C.A., p.297
- (128)
| X-rays | RADIO | ||||||||
|---|---|---|---|---|---|---|---|---|---|
| Total | Net (0.3-7) | S(0.1-2)a | H(2-10)a | HRb | Fc,d | ||||
| Cts | Cts | Total(Net) | Total(Net) | 2-10 keV | 1.4 GHz | 8.4 GHz | |||
| Coref | 16,573 | 16,339.6 | 10,722(10,719.1) | 5,777(5,774.3) | -0.30 | 241.3 | 5463 | 3427 | 0.26 |
| Jet total | 368 | 273.7 | 250(231.1) | 71(55.1) | -0.61 | 5.19 | |||
| Inner knot | 546 | 56 | 348(43.7) | 195(11.3) | -0.59 | 1.27 | 4.6 | ||
| A | 50 | 41.8 | 37(35.8) | 11(10.2) | -0.56 | 0.93 | 6 | 1.2 | |
| B | 46 | 34.4 | 29(27.5) | 9(7.7) | -0.56 | 0.75 | 44 | 7.7 | 0.82 |
| C | 34 | 21.0 | 17(15.3) | 9(7.1) | -0.37 | 0.51 | 52 | 10.7 | 0.86 |
a Net counts are shown in the brackets.
b Hardness ratio HR=H-S/H+S; 1 errors equal to =0.17,0.20,0.25 for knots A,B,C and =0.53 for the inner knot.
c Galactic absorbing column assumed in all models: ;
d 2-10 keV flux in units of erg s-1 cm-2, assuming a photon index = 1.5 for all components.
e Radio flux density in mJy (ergs cm-2s-1Hz-1) with estimated errors; the error for the core arises solely from the absolute flux density scale which should be good to 2%.
g The size of the region box used to measure the radio flux density for each knot at 1.4 GHz: A: 6x6, B:9x7 C:10.5x7.5; and at 8.4 GHz: A: 5x5, B:4.0x4.6 C: 5x6, and inner knot: 1.9x1.3.
h radio spectral index; S; 1 errors equal to 0.5, 0.15, 0.12 for knots A,B,C respectively. Spectral index measurements were made using the new set of data obtained at 4.86 GHz. We used the similar UV coverage in the measurements of the spectral index. The detailed analysis of the new radio data will be reported elsewhere.
| Knot | r(X) | r(1.4) | |
|---|---|---|---|
| A | 10.2 | 12.3 | 2.1 |
| B | 17.9 | 19.3 | 1.4 |
| C | 27.0 | 27.8 | 0.8 |
a Distance measured from core to peak brightness in knot. X-ray distance uncertainty is 0.3 and 1.4 GHz uncertainty is 1
| ITEM | INNERJET | 10.2”BOXa | A | B | C | units | |
|---|---|---|---|---|---|---|---|
| INPUT | |||||||
| Region Size | 0.65x1.3 | 1.2x10.2 | 0.7x2.6 | 0.9x2.8 | 0.9x2.4 | arcsec | |
| Distancec | 2. | 0.6 | 9.5 | 17.3 | 25.9 | arcsec | |
| log Volume | 66.4 | 69.3 | 68.2 | 68.5 | 68.425 | cm3 | |
| 1 | 1.33 | 0.76 | 0.92 | 0.94 | |||
| S(8.4 GHz) | 4.6 | 0.5 | 4.5 | 3.2 | mJy | ||
| S(1.4 GHz) | 6 | 2 | 13 | 8 | mJy | ||
| Fx(2-10 keV) | 5.26 | 14.6 | 5.0 | 4.0 | 2.0 | 10-15 ergs cm-2s-1 | |
| Sx(2 keV) | 0.65 | 9.5 | 7.8 | 2.9 | 10-16 ergs cm-2s-1keV-1 | ||
| THERMAL BREMSd | |||||||
| log Lx | 43.9 | 44.3 | 43.9 | 43.8 | 43.5 | erg s-1 | |
| n(e) | 2.12 | 0.12 | 0.23 | 0.15 | 0.12 | cm-3 | |
| M | 0.38 | 19 | 3.4 | 4.0 | 2.6 | 1010M⊙ | |
| P | 26 | 1.4 | 2.8 | 1.9 | 1.4 | 10-9dyne cm-2 | |
| SYNCHROTRONf | |||||||
| B(eq) | 75 | 5 | 13.5 | 16.4 | 15.4 | G | |
| log Ls | 44.1 | 44.5 | 42.95 | 43.8 | 44.43 | erg/s | |
| 0.84 | 3 | 2 | 1.8 | 1.8 | 108 | ||
| 37 | 310 | 270 | 237 | 249 | years | ||
| SSC | |||||||
| log Ls | 43.6 | 43.0 | 42.8 | 43.5 | 43.4 | erg s-1 | |
| B(eq) | 74 | 8 | 13.5 | 16.3 | 15.0 | G | |
| u() | 52 | 0.12 | 0.48 | 0.91 | 1.5 | 10-13erg cm-3 | |
| R=u()/u(B) | 0.024 | 0.004 | 0.007 | 0.009 | 0.016 | ||
| S(obs)/S(ssc)e | 708 | 65,504 | 14,400 | 740 | 313 | ||
| EICj | |||||||
| log L | 43.26 | 43.65 | 43.49 | erg s-1 | |||
| B(IC)g | 3 | 1.9 | 1.9 | 2.4 | 2.8 | G | |
| 3.7 | 1.7 | 3.3 | 2.4 | 2.2 | |||
| Rh | 8.4 | 31 | 28 | 11 | 8 | ||
| 15 | 20 | 17 | 24 | 27 | degrees |
a the 10.2”box includes knot A and all regions are defined based on the X-ray emission regions.
b Synchrotron frequency range assumed for a given : Hz.
c Distance of the beginning of the region from the core measured along the jet.
d A typical X-ray temperature of the gas emitting in Chandra band assumed to calculate the thermal gas pressure: 4.4K
e S(obs)/S(ssc) is the ’failure factor’ (observed/predicted flux densities).
f Synchrotron frequency range covers the entire radio to X-ray band: Hz; is the electron energy responsible for 1018 Hz emission; is the half-life time .
g B(IC) is the magnetic field required for IC/3k (no beaming).
h R is the ratio of IC to synchrotron losses in the jet frame.
i is the characteristic angle between the observer and the jet. This is the maximum allowed angle in the model.
j Synchrotron frequency range assumed in the EIC model:Hz.