Chandra ACIS-S observations of Abell 4059: signs of dramatic interaction between a radio galaxy and a galaxy cluster.
Abstract
We present Chandra observations of the galaxy cluster A4059. We find strong evidence that the FR-I radio galaxy PKS 2354–35 at the center of A4059 is inflating cavities with radii in the intracluster medium (ICM), similar to the situation seen in Perseus A and Hydra A. We also find evidence for interaction between the ICM and PKS 2354–35 on small scales in the very center of the cluster. Arguments are presented suggesting that this radio galaxy has faded significantly in radio power (possibly from an FR-II state) over the past .
Subject headings:
galaxies:jets, galaxies:clusters:individual (Abell 4059), hydrodynamics, X-rays: galaxies: clusters1. introduction
Clusters of galaxies are complex dynamical structures and their cores are subject to an array of interesting physical processes. Constraints from imaging X-ray observations suggest that the hot X-ray emitting intracluster medium (ICM) in the core regions of rich clusters is radiatively cooling on timescales shorter than the life of the cluster, giving rise to cooling flows (Fabian, 1994, and references therein). The central dominant galaxy present in many clusters often hosts a radio loud active galactic nucleus (AGN). It has been suggested (e.g., Binney & Tabor, 1995) that cooling flows and central cluster radio galaxies are intimately related via complex feedback processes. It is easy to see how radio galaxy activity resulting from black hole accretion can be associated with a cooling flow. However, the impact of a radio galaxy on its environment is much less clear.
Theoretically, we expect radio jets to inflate cocoons of relativistic plasma that expand into the surrounding ICM (e.g. Begelman & Cioffi, 1989; Kaiser & Alexander, 1997; Reynolds et al., 2001b, , hereafter RHB). The energy input by this process has recently come under investigation for its potential role in heating cluster cores (Brüggen et al., 2001; Quilis et al., 2001; Reynolds et al., 2001a). However, while our simulations suggest that about half of the energy injected by the jets can be thermalized in the cluster center, numerical simulations of this process still carry a large degree of uncertainty, since limited computational resources require significant simplications. In order to verify the validity of the assumptions and to design future models, we require guidance from observations of radio-galaxy/cluster interactions.
Imaging X-ray observatories, such as the Chandra X-ray Observatory (CXO), provide a direct probe of this interaction. Both ROSAT and CXO observations of Perseus A have found X-ray cavities coincident with the radio lobes (Boehringer et al., 1993; Fabian et al., 2000), surrounded by X-ray shells which appear to be slightly cooler than the unperturbed ICM (see, for example, RHB for a possible explanation). Similar features are seen in CXO observations of Hydra A (McNamara et al., 2000; David et al., 2001) and Abell 2052 (Blanton et al., 2001).
In this Letter, we present CXO observations of the rich galaxy cluster Abell 4059 (). The cD galaxy of A4059 hosts the FR-I radio galaxy PKS 2354–35. A short ROSAT High Resolution Imager (HRI) observation of this source suggested the presence of two ICM cavities at the same position angle as the radio lobes (Huang & Sarazin, 1998, , hereafter HS). In § 2 we discuss our observations, confirming the presence of these cavities, and show that A4059 displays significant additional morphological complexity. Constraints on models for this source are discussed in § 3, § 4 presents our conclusions. We assume a Hubble constant of and , giving a linear scale of .
2. Observations
2.1. Data Reduction
The galaxy cluster Abell 4059 was observed with the Advanced CCD Imaging Spectrometer (ACIS) on 24-Sept-2000 (22.3 ksec exposure) and on 4-Jan-2001 (18.4 ksec exposure). The radio nucleus of PKS 2354-35 was placed 1 arcmin from the nominal aim point of the back-illuminated S3 chip, placing the bulk of the emission on chip-S3. In this Letter, we only use data collected on this chip. The data was read out at the standard 3.2 sec frame rate, telemetered using faint mode, and filtered on ASCA event grades. The energy range was restricted to the 0.3-10 keV band and corrected for exposure and vignetting, spectral fitting was restricted to 0.3-8.0 keV.
Some of the Sept-2000 data were affected by a period of relatively high background, with up to 10 counts per second per chip for the back-illuminated chips. However, most of the cluster emission is well above this rate and we decided to use the entire data set for imaging. For the spectral analysis, we filtered the data on the counts from chip-S1 to fall within a factor of 1.2 of the quiescent background rate, which rejected 33% of the observing window. We then used the quiescent background files by Markevitch111See http://asc.harvard.edu/cal/Links/Acis/acis/Cal_prods/bkgrnd/current for background subtraction. The background subtracted total count rate on chip-S3 is 5.1 counts/second.
2.2. Morphological Appearance
Figure 1a shows an adaptively smoothed image of the central 3 arcmin of A4059. Overlayed is the 8 GHz image by (Taylor et al., 1994, , hereafter T94). While the large scale emission appears smooth (probably due to the larger smoothing length used by the csmooth algorithm), the core of A4059 is not relaxed: it is double peaked with one peak at the cluster center and the other 15 arcsec south-west of the center. The smoothed image reveals a distorted hour-glass like structure (yellow regions in Fig. 1a), centered on the nucleus and oriented perpendicular to the radio axis.
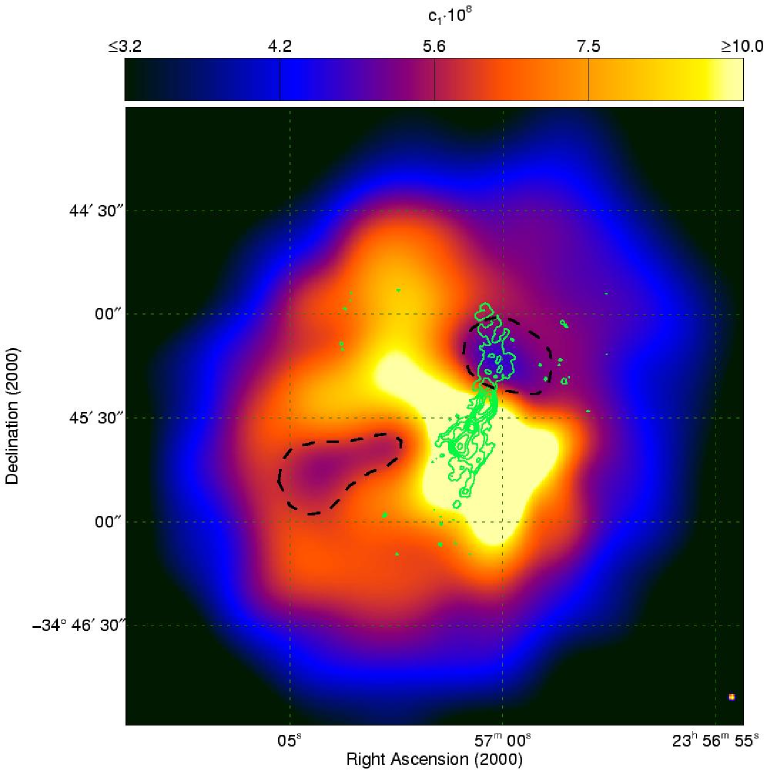
The most interesting detail of the X-ray image are the two X-ray holes already noticed by HS, clearly visible in the 5-sigma smoothed image. The higher quality CXO image confirms that these are real local brightness minima, not just a visual effect caused by a bright central bar perpendicular to the cluster elongation. A noticeable offset exists between the nucleus and the axis between the cavity centers, with the nucleus being shifted to the south-west by from this axis. The cavity centers are roughly apart.
To assess the significance of the cavities we extracted an azimuthally averaged radial surface brightness profile of the central region, excluding the cavity regions shown in Fig. 1a (a by-eye approximation) and calculated the expected surface brightness in the two cavities. Based on this estimate, the NW and SE cavities are significant to 26 and 5.3 sigma, respectively. However, because the central region of A4059 is strongly perturbed (roughly inward of 1 arcmin from the center), it is difficult to make a rigorous statement concerning the significance of the cavities this way.
However, the outer regions of the cluster appear relaxed. As an alternative method, we took radial surface brightness profiles from the combined SE- and NW quadrants and the combined SW-NE quadrants. As a first order correction for cluster ellipticity we shifted the radial SW-NE profile outward by a factor of 1.13, producing a good match at large radii with the SE-NW profile. Because the temperature at large is relatively uniform, we used an isothermal -model to fit the surface brightness, which represents the outer cluster very well. Because the inner cluster regions are not well represented by a -model, we only used points further than 60 arcsec from the center for the fit (, , ).
We then compared the flux measured inside the cavity contours in Fig. 1a to that expected from the -model. The NW cavity has 33 sigma significance compared to the best fit -model, while the less pronounced SE cavity has 13 sigma significance. Forcing the -model normalization to be consistent with the observed cavity flux increases the reduced chisquare of the fit by a factor of 2.7 (NW cavity) and 1.9 (SE cavity), corresponding to a significance of 8.5 and 6 respectively.
The radio overlay in Fig. 1a shows that the 8GHz radio lobes are only partly coincident with the cavities. The NW lobe covers a good fraction of the NW cavity. The SE lobe is much smaller than the northern lobe and not spatially coincident with the SE cavity. We note, however, that low-frequency radio observations sensitive to spatial scales of arcmin, which might reveal the full extent of the radio lobes, do not yet exist.
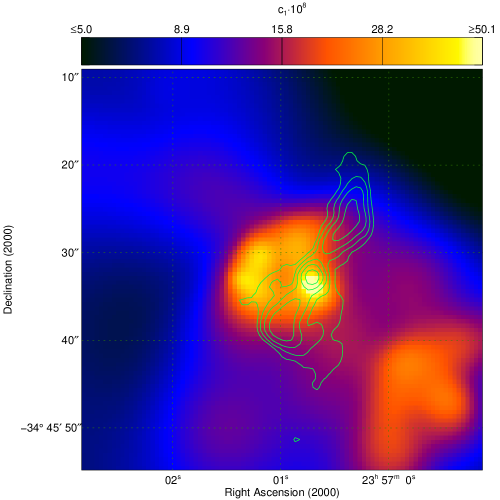
The central peak contains interesting sub-structure (Fig. 1b., smoothed to a S/N of 3-4). The brightest sub peak, which is well resolved by CXO and has a diameter of 3–4″ 3–4 kpc, is coincident with the core of PKS 2354–35 (within the CXO pointing accuracy) and could be emission from the hot interstellar medium of the central galaxy. The three sub-peaks are located around a local brightness minimum. Our hardness ratio analysis (§2.3) suggests that this minimum is due to lack of emission rather than intervening absorption. The close correspondence between these peaks and the SE radio lobe suggests that this substructure might be caused by on-going interaction.
2.3. Spectroscopic Properties
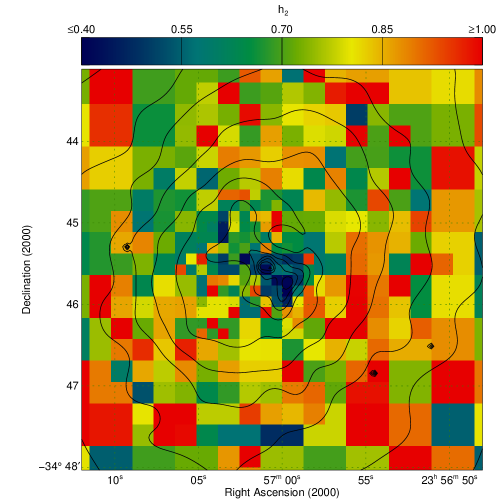
We used the adaptive binning routine of Sanders & Fabian (2001) to produce hardness ratio maps. We define the hardness ratios and as the ratio of the counts in the respective energy bands and as the surface brightness in the 0.3-10 keV band in . For ICM observations, is mainly sensitive to absorption variations, whereas is a temperature diagnostic. While there is no sign of varying absorption across the field (as seen in ), the map clearly shows a radial temperature gradient, as would be expected in a cooling flow cluster (Fig. 2). It also shows a global temperature gradient, with the SW half of the image appearing hotter than the NE half.
We have extracted a global spectrum of A4059 from the central 90 arcsec. Fitting this spectrum with a two temperature wabs*zwabs*(mekal+mekal) thermal plasma model (Galactic neutral hydrogen column fixed to ) results in the best fit parameters , , , , (3 sigma error bars). A wabs*zwabs*(mkcflow + mekal) cooling flow model provides a similarly reasonable fit (, , , , , ).
3. Discussion
Like Perseus A and Hydra A, A4059 shows clear signs of interaction between the radio galaxy and the ICM. However, unlike in these systems, there is no one-to-one correspondence between the radio lobes and the X-ray holes. We argue below that the cavities were indeed created by the radio activity (given the similarity in position angle and the fact that there are no other viable models for producing large ICM cavities), but that the radio galaxy has faded since they were formed. This is particularly interesting since CXO has recently found clusters with cavities but without a radio source (e.g., McNamara et al., 2001): A4059 could be a ‘missing link’ between cavities with and without detectable radio lobes, supporting the notion that cluster cavities can be created by radio galaxies without having to show current radio activity.
3.1. Evolutionary state
In the hydrodynamic simulations of RHB, we identified three evolutionary phases. Early on, the cocoon is highly overpressured, driving a strong shock into the ICM. Simulated X-ray maps show a cavity surrounded by a thin, hot shell. Once the cocoon comes into pressure equilibrium with the ICM, the sideways expansion of the cocoon becomes sub-sonic and the shock becomes a compression wave, though active jets can keep the advance speed of the jet heads supersonic for much longer, driving “sonic booms” into the ICM. For roughly a sound crossing time, the well defined cavity created during the supersonic phase will survive and be observable. Then, hydrodynamic instabilities will destroy the cavity altogether.
A strong shock would show up as a sharp feature in our X-ray images, which have an effective resolution222After adaptive smoothing to a signal to noise of 5. of 4–5 arcsec at the edges of the cavities. The absence of such a shock indicates that the source expansion is no longer highly supersonic. We identify the hourglass-like feature in the core with the compression wave (“sonic boom”) found in our hydrodynamic simulations (Fig. 1, RHB; in our simulated X-ray maps the brightest emission also tends to be in the equatorial plane).
3.2. Source Power
We can estimate the radio source parameters based on the presence of the X-ray cavities (Heinz et al. 1998, RHB, Churazov et al. 2000). We use the two-temperature fit of § 2 to estimate the physical parameters of the ICM. Taking the hot emission to arise uniformly in a sphere of 90″ radius yields an electron density of . Assuming the cold gas is in pressure equilibrium with the hot gas gives an electron density of and a volume filling factor of .
We assume that both X-ray cavities are completely evacuated by the lobes and estimate their size from the smoothed images by approximating them as spheres. While this is clearly a simplification, it will be sufficient for this order of magnitude estimate. A ‘by eye’ fit of the cavities gives bubble radii of (20 kpc). The pressure in the hot phase is , relatively close to the minimum energy pressure in the lobes of (T94). At a minimum, the radio galaxy has to perform “p dV” work against the ICM. Including the internal energy of the plasma within the cavities, this gives an integrated energy output of .
The radio galaxy had to inject this energy into the bubbles before they floated out of the cluster core. This buoyancy timescale is approximately twice the sound crossing time of the relevant region of the cluster, , where we have used the sound speed for a gas, . The time-averaged source power needed to produce the cavities is then .
Alternatively, we can estimate the source age from the “sonic boom” arguments of RHB. The hour-glass structure through the cluster center is roughly 50″ long (i.e., on either side of the center). Following RHB, we equate this to the distance traveled by a shock/compression wave which moves at least at the sound speed of the hot ICM. This gives a source age of and a time-averaged power of .
A third, X-ray independent way to estimate the source power is based on the radio flux. The flux densities at 5 GHz and 8 GHz are given by T94 as 76 mJy and 34 mJy, while the 1.4 GHz NVSS flux Condon et al. (1998) is 1.3 Jy. The NVSS flux lies a factor of 2 above the extrapolation of the 5–8 GHz flux, and the NVSS image suggests spatial extension on arcmin scales (a factor of larger than seen at 5–8 GHz). This suggests that NVSS is detecting low frequency emission from plasma that is emitting a steep radio spectrum, possibly indicating that it has suffered synchrotron aging. A reasonable upper limit on the current radio power can be derived by taking the 1.4 GHz luminosity, and using the arguments of Bicknell et al. (1998) to convert it into a kinetic luminosity. Taking the smallest reasonable value of their conversion parameter, , we estimate an upper limit on the current kinetic power of .
Comparing the time-averaged source power (derived the X-ray cavities) to that derived from the radio luminosity (which is equivalent to the source power averaged over the synchrotron cooling time of the 1.4 GHz electrons, ), one infers that either this source has faded in kinetic luminosity by an order of magnitude or more, or that the magnetic field in the lobes is considerably out of equipartition. Since the thermal pressure is close to the equipartition pressure estimated by T94, we favor the first possibility. Given the uncertainties in these arguments (especially in , for which we chose a conservative value), the source could easily have faded by more than an order of magnitude. Indeed, the fact that the average power is in the realm of FR-II radio galaxies, while morphology and current radio luminosity qualify it as an FR-I, leads us to speculate that PKS2354–35 is an example of an FR-II source that has faded into an FR-I source on a timescale of less than .
The apparent offset between the cluster center and the center of the cavities and the asymmetric brightness distribution through the equatorial regions of the hour-glass structure may be evidence for bulk ICM motions. In particular, the morphology suggests a bulk flow in a NE direction which might further squeeze the outward moving compression wave from the radio galaxy, and sweep back the cavity structure. We note that the SW ridge is rather cool and thus cannot be a strong shock resulting from the interaction of a bulk flow with the radio galaxy. Hydrodynamic simulations are required to investigate this system further.
4. Conclusions
We have presented CXO observations of Abell 4059. While the ICM appears smooth and relaxed on large scales, it shows complex morphology in the core region which is likely the result of interaction between the ICM and the central FR-I radio galaxy PKS2354–35. As was suggested by HS, PKS 2354–35 appears to have inflated two large cavities in the ICM. Together with a central bar-like structure, these cavities produce an hour-glass like morphology which can be readily understood as being due to a radio cocoon expanding into the ICM. While clear correspondence exists between the NW cavity and the NW radio lobe, the SE cavity is much larger than the SE lobe, suggesting that this could be a ‘missing link’ between cavities with and without visible radio lobes.
The absence of sharp edges in the brightness images and of large temperature jumps implies that PKS2354–35 is not driving a strong shock into the ICM. We suggest that it is in the weak-shock/compression-wave phase identified in the hydrodynamic simulations of RHB. Dynamical estimates give a time averaged kinetic source power of at least , while estimates based on the current radio luminosity indicate a source power of . We suggest that this source has faded by a significant amount (and possibly from an FR-II phase) during the past .
Acknowledgments
We thank Eugene Churazov and Torsten Ensslin for helpful discussions. We acknowledge support from SAO grant GO0-1129X, the National Science Foundation grants AST 9529170 and AST 9876887, and NASA under grant NAG5-6337. YC wishes to thank support from the MOST through the National R & D program for women’s universities. CSR thanks support from Hubble Fellowship Grant HF 01113.01-98A.
References
- Begelman & Cioffi (1989) Begelman, M. C. & Cioffi, D. F. 1989, ApJ, 345, L21
- Bicknell et al. (1998) Bicknell, G. V., Dopita, M. A., Tsvetanov, Z. I., & Sutherland, R. S. 1998, ApJ, 495, 680
- Binney & Tabor (1995) Binney, J. & Tabor, G. 1995, MNRAS, 276, 663
- Blanton et al. (2001) Blanton, E. L., Sarazin, C. L., McNamara, B. R., & Wise, M. W. 2001, ApJ, 558, L15
- Boehringer et al. (1993) Boehringer, H., Voges, W., Fabian, A. C., Edge, A. C., & Neumann, D. M. 1993, MNRAS, 264, L25
- Brüggen et al. (2001) Brüggen, M., Kaiser, C. R., Churazov, E., & Ensslin, T. A. 2001, MNRAS, astro-ph/0108486
- Churazov et al. (2000) Churazov, E., Forman, W., Jones, C., & Böhringer, H. 2000, A&A, 356, 788
- Condon et al. (1998) Condon, J. J., Cotton, W. D., Greisen, E. W., Yin, Q. F., Perley, R. A., Taylor, G. B., & Broderick, J. J. 1998, AJ, 115, 1693
- David et al. (2001) David, L. P., Nulsen, P. E. J., McNamara, B. R., Forman, W., Jones, C., Ponman, T., Robertson, B., & Wise, M. 2001, ApJ, 557, 546
- Fabian (1994) Fabian, A. C. 1994, ARA&A, 32, 277
- Fabian et al. (2000) Fabian, A. C., Sanders, J. S., Ettori, S., Taylor, G. B., Allen, S. W., Crawford, C. S., Iwasawa, K., Johnstone, R. M., & Ogle, P. M. 2000, MNRAS, 318, L65
- Heinz et al. (1998) Heinz, S., Reynolds, C. S., & Begelman, M. C. 1998, ApJ, 501, 126
- Huang & Sarazin (1998) Huang, Z. & Sarazin, C. L. 1998, ApJ, 496, 728, HS
- Kaiser & Alexander (1997) Kaiser, C. R. & Alexander, P. 1997, MNRAS, 286, 215
- McNamara et al. (2000) McNamara, B. R., Wise, M., Nulsen, P. E. J., David, L. P., Sarazin, C. L., Bautz, M., Markevitch, M., Vikhlinin, A., Forman, W. R., Jones, C., & Harris, D. E. 2000, ApJ, 534, L135
- McNamara et al. (2001) McNamara, B. R., Wise, M. W., Nulsen, P. E. J., David, L. P., Carilli, C. L., Sarazin, C. L., O’Dea, C. P., Houck, J., Donahue, M., Baum, S., Voit, M., O’Connell, R. W., & Koekemoer, A. 2001, ApJ, 562, L149
- Quilis et al. (2001) Quilis, V., Bower, R. G., & Balogh, M. L. 2001, MNRAS, 328, 1091
- Reynolds et al. (2001a) Reynolds, C. S., Heinz, S., & Begelman, M. C. 2001a, MNRAS, in preparation
- Reynolds et al. (2001b) —. 2001b, ApJ, 549, L179, RHB
- Sanders & Fabian (2001) Sanders, J. S. & Fabian, A. C. 2001, MNRAS, 325, 178
- Taylor et al. (1994) Taylor, G. B., Barton, E. J., & Ge, J. 1994, AJ, 107, 1942, T94