submitted to The Astrophysical Journal Letters
Do the Infrared Emission Features Need Ultraviolet Excitation?
The PAH Model in UV-poor Reflection Nebulae
Abstract
One of the major challenges to identification of the 3.3, 6.2, 7.7, 8.6, and 11.3 interstellar infrared (IR) emission bands with polycyclic aromatic hydrocarbon (PAH) molecules has been the recent detection of these bands in regions with little ultraviolet (UV) illumination, since small, neutral PAH molecules have little or no absorption at visible wavelengths and therefore require UV photons for excitation.
We show here that our “astronomical” PAH model, incorporating the experimental result that the visual absorption edge shifts to longer wavelength upon ionization and/or as the PAH size increases, can closely reproduce the observed infrared emission bands of vdB 133, a UV-poor reflection nebula.
It is also shown that single-photon heating of “astronomical” PAHs in reflection nebulae near stars as cool as can result in observable emission at 6.2, 7.7, 8.6, and 11.3. Illustrative mid-IR emission spectra are also calculated for reflection nebulae illuminated by cool stars with . These will allow comparison with future Space Infrared Telescope Facility (SIRTF) observations of vdB 135 (), vdB 47 (), and vdB 101 ().
It is also shown that the dependence of the 12 IRAS emission relative to the total far-IR emission on the effective temperature of the exciting star is consistent with the PAH model expectation for .
1 Introduction
Since their first detection in the planetary nebulae NGC 7027 and BD+30o3639 (Gillett, Forrest, & Merrill 1973), the distinctive set of infrared (IR) emission features at 3.3, 6.2, 7.7, 8.6, and 11.3 have been observed in a variety of objects with a wide range of physical conditions, including planetary nebulae, protoplanetary nebulae, reflection nebulae, HII and ultracompact HII regions, circumstellar envelopes, the diffuse interstellar medium (ISM) of the Milky Way Galaxy, and external galaxies (see Tielens et al. 1999 and Sellgren 2001 for recent reviews). Although the exact nature of their carriers remains unidentified – they remain known as “the Unidentified Infrared (UIR) bands” – it is now widely thought that they originate from some sorts of aromatic hydrocarbons. Various carbonaceous materials have been proposed as the UIR band carriers. In general, they can be categorized into two classes: (1) pure, free-flying aromatic molecules – polycyclic aromatic hydrocarbon molecules (PAHs; Léger & Puget 1984; Allamandola, Tielens, & Barker 1985); (2) carbonaceous grains with a partly aromatic character – hydrogenated amorphous carbon (HAC; Duley & Williams 1981; Jones, Duley, & Williams 1990), quenched carbonaceous composite (QCC; Sakata et al. 1990), coal (Papoular et al. 1993), fullerenes (Webster 1993), and surface-graphitized nanodiamonds (Jones & d’Hendecourt 2000).
In most current models, the UIR band emission involves three sequential steps: (1) excitation by absorption of an energetic starlight photon (usually ultraviolet [UV]); (2) rapid () redistribution of all or part of the absorbed photon energy over all available vibrational modes; (3) radiative relaxation via IR fluorescence.
Among the existing proposed carriers, the PAH model is gaining increasing acceptance because of (1) the close resemblance of the UIR spectra (frequencies and relative intensities) to the vibrational spectra of PAH molecules (e.g. see Allamandola, Hudgins, & Sandford 1999) and (2) the ability of a PAH molecule to emit efficiently in the UIR wavelength range following single photon heating (Greenberg 1968; Léger & Puget 1984; Allamandola, Tielens, & Barker 1985; Draine & Li 2001). In contrast, larger carbonaceous grains are unlikely to be efficient UIR emitters since the timescale for the absorbed photon energy to diffuse () is much shorter than the IR vibrational emission timescale (; see Tielens et al. 1999).
Early observations of the UIR emission bands were made in regions with strong UV irradiation, and PAH excitation was expected since all PAH species are strongly absorbing in the vacuum ultraviolet (Å). The PAH UV excitation model has recently been challenged by the ISO (Infrared Space Observatory) detection of the UIR bands in , a reflection nebula illuminated by a binary system with little UV radiation (see Uchida, Sellgren, & Werner 1998). The UIR spectrum of this UV-poor region closely resembles those observed in sources with much harsher UV environments (Uchida et al. 2000). This appears to be in conflict with the view that PAHs are primarily excited by UV photons, as would be expected based on laboratory studies showing that the absorption by small, neutral PAHs has a sharp cut-off in the UV, with little or no absorption in the visible (see Sellgren 2001 for a review). Uchida et al. (2000) obtained 5–15 ISOCAM spectra of 6 reflection nebulae and found no systematic spectroscopic differences despite values of ranging from 6800 to 19000.
The PAH electronic absorption edge is known to shift to longer wavelength with increasing size and/or upon ionization (see Allamandola et al. 1989, Salama et al. 1996 and references therein). While the largest experimentally studied PAH molecule to date is dicoronylene C48H20 (Allamandola, Hudgins, & Sandford 1999), astronomical PAHs are believed to be larger (e.g., the mean size for the Milky Way PAHs is Å, corresponding to [Li & Draine 2001a]). The astronomical PAH model – with the size/ionization dependence of the PAH absorption edge taken into account (see §A2 in Li & Draine 2001a) – is successful in explaining the observed mid-IR spectra of the Milky Way diffuse ISM (Li & Draine 2001a), the quiescent molecular cloud SMC B1#1 in the Small Magellanic Cloud (Li & Draine 2001b), and the UIR band ratios for a wide range of environments ranging from reflection nebulae, HII regions, photodissociation regions (PDRs), molecular clouds in the Milky Galaxy to normal galaxies, starburst galaxies, and a Seyfert 2 galaxy (Draine & Li 2001).
In this Letter we show that the astronomical PAH model is consistent with the observed UIR emission from UV-poor environments. In §2 we verify that the astronomical PAH model can quantitatively reproduce the vdB 133 UIR spectrum. We further demonstrate in §3 that the UIR bands are also expected for reflection nebulae which are even more UV-poor than vdB 133, and we provide model spectra for comparison with future Space Infrared Telescope Facility (SIRTF) observations of reflection nebulae near cool stars. In §4 we show that the predicted dependence of the ratio of the IRAS 12 emission to the total far-IR emission is also consistent with observations. Our results are discussed in §5, and our conclusions are summarized in §6.
2 vdB 133
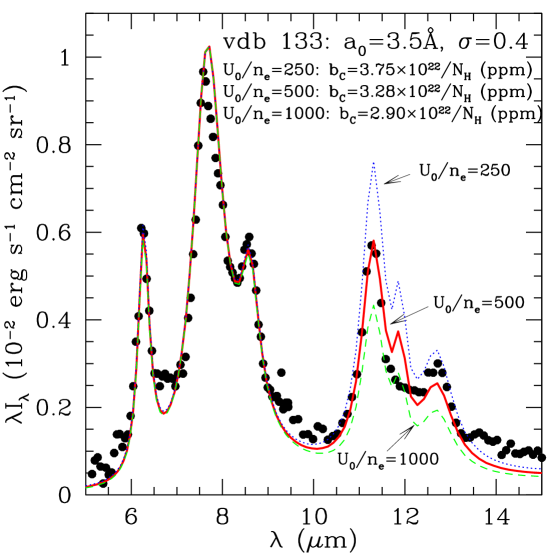
The reflection nebula vdB 133, located in the Cyg OB1 association at a distance , is illuminated by a binary system consisting of HD 195593A (spectral type F5Iab; effective temperature ; absolute magnitude ) and HD 195593B (spectral type B7II; ; ) (see Uchida et al. 2000 and references therein). Following Uchida et al. (1998), we approximate the vdB 133 radiation field by a linear combination of two Kurucz model atmosphere spectra (Kurucz 1979). The starlight intensity incident on the reflection nebula is assumed to have , where is the ratio of the 912Å–1 energy density relative to the value for the MMP interstellar radiation field ().
Let be the fraction of the nonionizing stellar luminosity radiated at wavelength :
| (1) |
This binary system,111HD 195593B, with , contributes of the total flux shortward of 0.2; HD 195593A, with , contributes of the total flux shortward of 1. with , has the lowest value of for reflection nebulae with detected UIR emission bands.222 For comparison, NGC 2023 is illuminated by HD 37903, with and ; the average interstellar starlight background (Mathis, Mezger, & Panagia 1983) has . Despite this, the vdB 133 UIR features are very similar to those observed in regions with much harder radiation fields (Uchida et al. 2000).
We model the vdB 133 UIR features as emitted from a mixture of neutral and ionized PAH molecules. We use the PAH absorption cross sections estimated by Li & Draine (2001a) which take into account the size/charge dependence of the PAH long wavelength absorption edge (see Figure 1). We adopt a log-normal size distribution for the PAHs, characterized by three parameters: , , and ; and respectively determine the peak location and the width of the log-normal distribution, and is the total amount of C atoms (relative to total H) locked up in PAHs. As always, the term “PAH size” refers to the radius of a hypothetical spherical grain with the same carbon density as graphite () and containing the same number of carbon atoms : .

The PAH ionization fraction depends on the radiation intensity, the electron density , and the gas temperature . Assuming , we estimate the PAH ionization fractions in vdB 133 using the rates for photoelectric emission and electron capture recently discussed by Weingartner & Draine (2001).
We employ the “thermal-discrete” method (Draine & Li 2001) to calculate the temperature distribution functions for PAHs subject to single-photon heating. Our model assumes a single radiation field: attenuation of the illuminating starlight in the dust layer is neglected. If the dust layer is optically-thick to the exciting radiation, we may approximate this by an optically-thin layer with a column density such that the optical depth to the exciting radiation would be unity. For a standard dust mixture and (say), this would correspond to .
Figure 2 plots the theoretical spectra calculated from models with Å, , and abundances for respectively. We see that the model () closely reproduces the observed UIR spectrum using the standard Milky Way PAH size distribution (Å, ), a realistic radiation field, and PAH abundances ( if ) comparable to the Milky Way abundances ().
3 Cool Reflection Nebulae
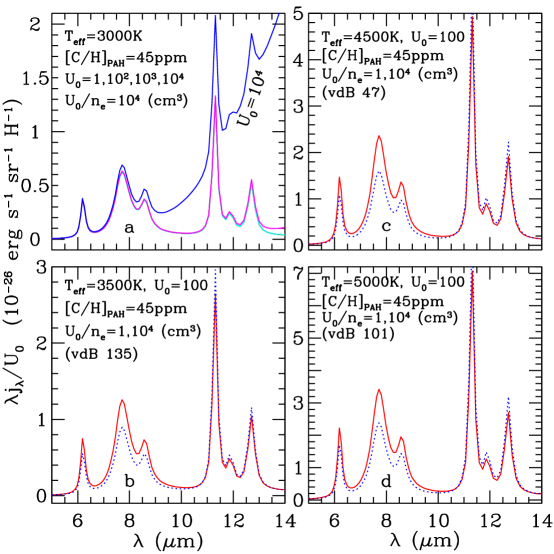
We have seen in §2 that the astronomical PAH model is successful in explaining the UIR spectrum observed in vdB 133. In this section we will show that reflection nebulae illuminated by cooler stars are also capable of exciting PAHs sufficiently to emit at the 6.2, 7.7, 8.6 and 11.3 UIR bands. For illustrative purpose, we consider reflection nebulae illuminated by stars with . The latter 3 cases will serve as a direct comparison basis for SIRTF observations of vdB 135 (), vdB 47 (), and vdB 101 () (Houck 2001).333Attempts by Uchida et al. (2000) to search for UIR bands in vdB 101 and vdB 135 using ISOCAM spectroscopy were unsuccessful due to the faintness of these nebulae.
Lacking prior knowledge of the PAH size distribution and the physical environmental parameters such as , , and the starlight intensity , we adopt the Milky Way PAH size distribution (i.e., a log-normal distribution with Å and [Li & Draine 2001]) and we take . We take as a representative number since for typical reflection nebulae (see Sellgren et al. 1990); the calculated UIR emission is essentially proportional to for (see Figure 3a). In all models we take the number of carbon atoms relative to hydrogen in PAHs to be , the same as in the Milky Way diffuse ISM (Li & Draine 2001).
For stars with we take the Kurucz atmospheric model spectra to approximate the radiation fields. Since the Kurucz model is not available for stars cooler than 3500, we take the model spectrum of Allard et al. (1997) for .
In Figure 3a we plot the mid-IR spectra calculated for PAHs heated by a star with and . The predicted PAH IR bands are prominent, with a much stronger 11.3 C-H out-of-plane band in comparison with those in regions illuminated by much hotter stars (e.g., NGC 2023 [], Orion Bar [], M17 []; Verstraete et al. 2001). This is due to the lack of UV photons capable of causing photoelectric ejection of electrons and thus PAHs in such a cool region mainly remain neutral even for . As expected from the single-photon heating scenario, the PAH IR features are almost indistinguishable for except the model has a rising wing for . This is because for the dust grains already attain an equilibrium temperature .
In Figure 3b,c,d we plot the model spectra for , , and , respectively. It is seen that all spectral shapes are almost the same except the absolute emissivity level (at fixed ) increases with increasing of . This is because hotter stars radiate a larger fraction of their power at short wavelengths where PAHs are strongly absorbing. It is also seen from the enhanced 11.3 band relative to the 7.7 C-C stretching band that a large fraction of PAHs in those regions are neutral.444The probability for a small PAH molecule being neutral is larger for than that for . This is because in regions devoid of UV photons the charging of a neutral PAH is dominated by electron capture and thus PAHs are more likely to be negatively charged when is small. This is the major difference between the UIR features excited by cool stars with those excited by hot stars.555The vdB 133 nebula is not lack of photoelectron-ejecting photons. The hot companion HD 195593B () of the exciting binary system contributes of the total 6–13.6 photons. This is why the vdB 133 UIR spectrum resembles those excited by hot stars. It is hoped that SIRTF observations of these reflection nebulae will provide both spectra of the UIR bands and a full spectral energy distributions to allow the illuminating intensity to be well-determined, thereby allowing comparison with the model spectra in Figure 3.
In Table 1 we give the PAH mid-IR emission convolved with the 5.8 and 8.0 SIRTF Infrared Array Camera (IRAC) bands calculated for the Milky Way PAH mixture excited by cool stars with . Figure 3 and Table 1 may provide guidance for the coming SIRTF observation of cool reflection nebulae (Houck 2001). We stress, however, that the actual mid-IR spectra may differ from those in Figure 3 and Table 1 since the PAH size distribution, the PAH abundance, and the environmental parameters , and may differ from those adopted here.
| () | ||||
|---|---|---|---|---|
| () | ||||
| 5.8 | 0.64 (0.49) | 1.34 (1.02) | 2.66 (2.01) | 4.05 (3.17) |
| 8.0 | 2.69 (2.04) | 5.41 (3.93) | 10.1 (7.05) | 14.7 (10.5) |
4 The 12 Emission vs. Radiation Hardness
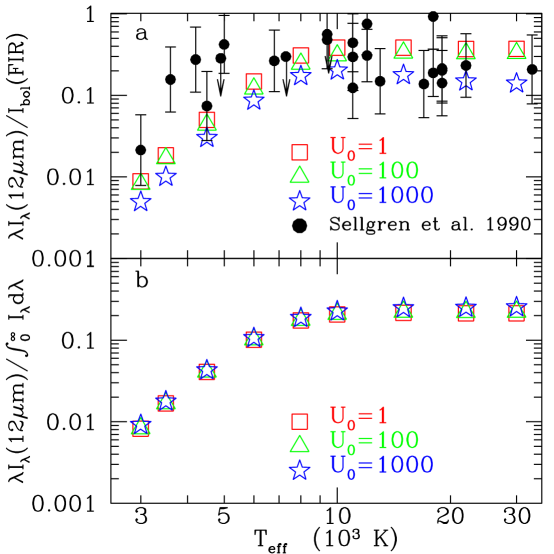
To study the carrier of the 12 emission and its excitation mechanism, Sellgren et al. (1990) investigated how the ratio depended on the effective temperature of the exciting stars for 24 reflection nebulae, where is estimated from the IRAS 12 filter, and the total far-IR surface brightness was estimated by fitting a blackbody multiplied by a emissivity to the IRAS 60 and 100 surface brightnesses. They found that is basically independent of for . If PAHs are the 12 carrier and excited only by UV photons, one would expect to show a sharp drop for cool stars () which are relatively devoid of UV radiation (Sellgren et al. 1990). Therefore, one can conclude that either PAHs are not responsible for the 12 emission or PAHs are excited by photons of a wide range of wavelengths. Since it has been well established that the UIR features are the dominant contributor to the 12 emission, the former hypothesis can be ruled out. Therefore, it must be possible for photons longward of the UV to excite the UIR carrier. Is this consistent with our understanding of PAHs?
To test the astronomical PAH model, we calculate for reflection nebulae illuminated by stars with =3000, 3500, 4500, 6000, 8000, 10000, 15000, 22000 and 30000 and starlight intensity , assuming and using the Milky Way dust mixture. As shown in Figure 4a the model results are in good agreement with observational data except four nebulae: vdB 135 (), vdB 42 (), vdB 47 (), vdB 35 (). It is worth noting that these nebulae are the four faintest among Sellgren et al.’s sample of 24. It is possible that was underestimated for these cool, faint nebulae as a consequence of the method of obtaining because the 60 and 100 emission preferentially account the warm grain component while the bulk of the far-IR emission is probably longward of 100 for cool reflection nebulae.
A better way to characterize the fraction of total IR emission emitted at 12 is to replace by . In Figure 4b we show the model predicted as a function of .
5 Discussion
It is not surprising that the astronomical PAH model is able to reproduce the vdB 133 UIR spectrum. It is also not unexpected that the PAH mid-IR emission spectra in regions devoid of UV radiation resemble those in UV-rich regions. This can be readily seen from Figure 7 of Draine & Li (2001) which shows that a 0.5 photon will excite a (mean size for the Milky Way mixture) PAH molecule to a vibrational temperature of , resulting in strong emission in the 6.2–11.3 UIR bands. For smaller PAHs, softer photons are able to fulfill this excitation task. Therefore, the detection of UIR bands in UV-poor regions does not contradict PAHs as the UIR band carrier. The lack of a precipitous drop for cool stars () in simply indicates that interstellar PAHs have absorption extending into the visible, presumably as the combined result of somewhat larger sizes than those currently studied in laboratory, plus modification of the absorption properties by ionization.
Papoular (2000) proposed that PAH excitation could result from energy released during PAH-catalyzed H2 formation. While this excitation mechanism may be present, it does not appear able to provide sufficient excitation to account for the observed UIR emission (Pagani et al. 1999). In any case, our model calculations show that excitation by starlight can account for the observed UIR intensities.
We note that our approach to estimating the absorption properties of astronomical PAHs was simplified (Li & Draine 2001) in that we did not distinguish negatively-charged anions (PAH-) and multiply-charged cations (PAHn+) and anions (PAHn-) from singly-charged cations (PAH+). For example, laboratory studies of the electronic absorption spectra of coronene (C24H12) in solution have shown that its di-anion (C24H) has markedly enhanced visual/near-IR continuum absorption than its mono-anion (C24H) and neutral counterpart (Hoijtink 1959). However, the fact that our simplified PAH model can successfully reproduce the vdB 133 UIR spectrum and the dependence of suggests that the model provides a fairly good approximation to the real absorption properties of astronomical PAH mixtures.
6 Conclusion
We have modeled the excitation of PAH molecules in UV-poor regions. It is shown that the astronomical PAH model provides a satisfactory fit to the UIR spectrum of vdB 133, a reflection nebulae with the lowest ratio of UV to total radiation among reflection nebulae with UIR bands detected. It is also shown that astronomical PAHs can be pumped by cool stars with even less UV radiation. It is further shown that the PAH model predicts a dependence of for reflection nebulae which is consistent with observations for . We conclude that PAHs appear able to account for the UIR band emission observed in reflection nebulae.
References
- (1) Allamandola, L.J., Tielens, A.G.G.M., & Barker, J.R. 1985, ApJ, 290, L25
- (2) Allamandola, L.J., Hudgins, D.M., & Sandford, S.A. 1999, ApJ, 511, L115
- (3) Allard, F. Hauschildt, P.H., Alexander, D.R., & Starrfield, S. 1997, ARA&A, 35, 137
- (4) Draine, B.T., & Li, A. 2001, ApJ, 551, 807
- (5) Duley, W.W., & Williams, D.A. 1981, MNRAS, 196, 269
- (6) Gillett, F.C., Forrest, W.J., & Merrill, K.M. 1973, ApJ, 183, 87
- (7) Greenberg, J.M. 1968, in Stars and Stellar Systems, Vol. VII, ed. B.M. Middlehurst & L.H. Aller (Chicago: Univ. of Chicago Press), 221
- (8) Hoijtink, G.J. 1959, Mole. Phys., 2, 85
- (9) Houck, J.R. 2001, SIRTF Observations of the Mid IR Features in Reflection Nebulae, http://sirtf.caltech.edu/ROC/pid19
- (10) Jones, A.P., Duley, W.W., & Williams, D.A. 1990, QJRAS, 31, 567
- (11) Jones, A.P., & d’Hendecourt, L. 2000, A&A, 355, 1191
- (12) Kurucz, R.L. 1979, ApJS, 40, 1
- (13) Léger, A., & Puget, J.L. 1984, A&A, 137, L5
- (14) Li, A., & Draine, B.T. 2001a, ApJ, 554, 778
- (15) Li, A., & Draine, B.T. 2001b, ApJ, submitted (astro-ph/0112110)
- (16) Mathis, J.S., Mezger, P.G., & Panagia, N. 1983, A&A, 128, 212
- (17) Pagani, L., Lequeux, J., Cesarsky, D., Donas, J., Milliard, B., Loinard, L., & Sauvage, M. 1999, A&A, 351, 447
- (18) Papoular, R. 2000, A&A, 359, 397
- (19) Papoular, R., Ellis, K., Guillois, O., Reynaud, C., & Nenner, I. 1993, J. Chem. Soc. Farady Trans., 89, 2289
- (20) Sakata, A., Wada, S., Onaka, T., & Tokunaga, A.T. 1990, ApJ, 353, 543
- (21) Salama, F., Bakes, E.L.O., Allamandola, L.J., & Tielens, A.G.G.M. 1996, ApJ, 458, 621
- (22) Sellgren, K. 2001, Spectrochim Acta A 57, 627
- (23) Sellgren, K., Luan, L., & Werner, M.W. 1990, ApJ, 359, 384
- (24) Tielens, A.G.G.M., Hony, S., van Kerckhoven, C., & Peeters, E. 1999, in Proc. ESA Symp., The Universe as Seen by ISO, ed. P. Cox & M.F. Kessler (ESA SP-427), 579
- (25) Uchida, K.I., Sellgren, K., & Werner, M.W. 1998, ApJ, 493, L109
- (26) Uchida, K.I., Sellgren, K., Werner, M.W., & Houdashelt, M.L. 2000, ApJ, 530, 817
- (27) Verstraete, L., et al. 2001, A&A, 372, 981
- (28) Webster, A. 1993, MNRAS, 264, 121
- (29) Weingartner, J.C., & Draine, B.T. 2001, ApJS, 134, 263