e-mail: celine@obs-besancon.f,annie.robin@obs-besancon.f
Search for star clusters close to the Galactic plane with DENIS
An automated search for star clusters close to the Galactic plane () was carried out on the Point Source Catalogue of the DENIS survey. 44% of the Galactic plane have been observed and calibrated. The method allowed to retrieve 22 known star clusters and to identify two new ones, not published yet although previously presented in the 2MASS web site as embedded clusters in HII regions. Extinction in the field and in front of the clusters are estimated using a model of population synthesis. We present the method and give the properties of these clusters.
Key Words.:
Galaxy: open clusters and associations: general – Galaxy: globular clusters: general1 Introduction
The highly concentrated dust in the plane of the Milky Way makes difficult the observation in the visible range of embedded objects and most distant objects hidden behind the Galactic plane. However, the extinction decreases at longer wavelengths: in the K-band, it is about ten times smaller than in the visible. Thus the recent Near-Infrared surveys provide suitable data for systematic search for new objects projected on the Galactic plane. Using the Two Micron All Sky Survey (hereafter 2MASS, Skrutskie et al., 1997) in the J (1.25 ), H (1.65 ) and Ks (2.17 ) bands, Dutra & Bica (2000) carried out a systematic search for new star clusters in a 5 field centered close to the Galactic plane and listed 58 IR star clusters or candidates. They also investigated selected regions with evidence of star formation and found 42 star clusters or candidates (Dutra & Bica, 2001). Hurt et al. (2000) serendipitously discovered two globular clusters near the Galactic plane. Vauglin et al. (2001) undertook a search for galaxies by eye on J and Ks-band images from the Deep-Near Infrared Survey of the Southern Sky (hereafter DENIS, Epchtein et al., 1997, 1999) and found 13 star clusters (Rousseau, private communication).
2 Method
DENIS observations are strips 12′ wide in right ascension, and 30o spanned in declination. A strip is made of 180 individual 12 images, with 2′ overlaps between consecutive images. The images are processed at the Paris Data Analysis Center, and point source catalogues are extracted. Over the 3317 strips calibrated at that time, we selected the strips which contain sources with Galactic latitude , that is 1219 strips. They all together cover 44% of the entire Galactic plane, with Galactic longitudes ranging between and (82% of the strips are calibrated within this range).
The two criteria used to search for star clusters are based on the density of stars and the integrated flux in the Ks band. This band allows to probe more extinguished regions than the and bands. Each image of the strip is divided in 2 frames. The number of stars and total flux in the Ks band are computed in each frame, using the corresponding calibrated catalogue. The mean and , and the dispersion around the mean and of these two parameters are computed for the entire image. A 2 window is then displaced with 0.4′ steps in declination and right ascension on the image. If the density of stars and the total flux in the window are 4 and 4 above the mean and , the program indicates the eventuality of a detection. The threshold has been defined with the faintest globular cluster discovered with 2MASS, GC01.
However, the star cluster GC01 is not easily distinguishable only from the catalogue, and these two criteria only are not sufficient to perform an automatic detection. Most of the stars in the cluster have J-Ks 3.5, which is not surprising for a globular cluster dominated by red giants in a high extinction region. With the condition J-Ks 3.5, the cluster can now be detected in an automatic way. A difficulty remains in the determination of the J-Ks limit due to the unknown color of an eventual cluster and to the variable extinction from frame to frame. We chose to consider the middle of the color range of the stars, , in the 12 image as a tentative limit. The efficiency of the detection being very dependent on the selection of the limit J-K considered, we performed the 4 and 4 test 3 times, over stars redder than J-K - 0.5, J-K, and J-K + 0.5. In the case of GC01, the determined limit is J-K = 3. The detection program fails with the condition J-K 2.5 or 3, but is successful for J-K 3.5. The variation of the J-Ks limit increases the efficiency of detection, but also allows to detect younger star clusters than this globular cluster.
Wilson (1991) and Battinelli (1991) described automatic procedures for identification of star associations. They are based on agglomerative algorithms. Whereas Wilson (1991) determined a search radius, Battinelli (1991) algorithm, called Path-Linkage-Criterion technique, assigns two stars to the same group if it is possible to go from one to the other jumping from star to star in steps smaller than a determined scale-length. It allows to detect compact and filamentary groups. Our method is not optimized to identify associations of young stars. It uses a color criterion in order to enhance the contrast with background stars, combined together with a density criterion and a total luminosity criterion. Applied to Near-Infrared data, our technique allows to retrieve either old globular clusters or young star clusters embedded in HII regions.
3 Results
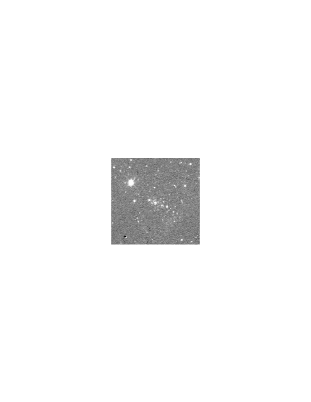
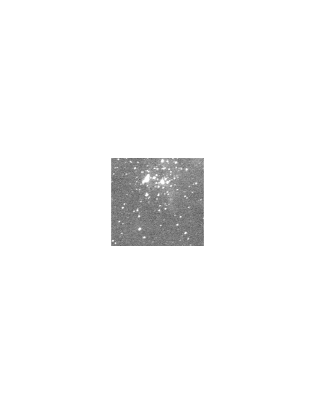
Already known star clusters in the studied region detected with this method are listed in Table 1. Most of the non-detected clusters are faint and do not appear clearly in the DENIS images. NGC 6544 and NGC 6553 were not detected whereas they are bright globular clusters. The first one is effectively not revealed in the catalogue probably because the bright part in the center has been extracted as a single bright source. The second one is in between two strips and only partially visible in one strip, whereas the adjacent strip is not available. Two star clusters not yet published have been identified. However, these clusters have been previously presented in the “Picture of the week” 2MASS web site, as embedded clusters in HII regions Gum 25 and W40. Properties of these clusters, hereafter Gum 25 cluster and W40 cluster, are given in Table 2. Images in the Ks-band are shown in Fig. 1. (Ks,J-Ks) color-magnitude diagrams are plotted in Figs. 2a and 3a for Gum 25 cluster and W40 cluster respectively. Field stars are plotted with dots, cluster stars with pluses.
| name | (J2000) | l(o) | b(o) | |
|---|---|---|---|---|
| LDN1654 a | 06 59 42 07 46 29 | 220.79 | 1.71 | *C |
| Pismis 2 | 08 17 55 41 40 18 | 258.86 | 3.34 | *C |
| NGC 2660 | 08 42 18 47 09 00 | 265.85 | 3.03 | OC |
| Pismis 12 | 09 19 54 45 08 00 | 268.64 | +3.19 | *C |
| Westerlund 2 | 10 24 02 57 45 30 | 284.27 | 0.33 | OC |
| NGC 4337 | 12 23 54 58 08 00 | 299.29 | +4.54 | *C |
| NGC 5927 | 15 28 44 50 40 22 | 326.70 | +4.79 | GC |
| NGC 5946 | 15 35 29 50 39 35 | 327.58 | +4.19 | GC |
| Lyngå 7 | 16 11 03 55 18 52 | 328.77 | 2.79 | GC |
| NGC 6256 | 16 59 33 37 07 17 | 347.79 | +3.30 | GC |
| Tonantzintla 2 | 17 36 11 38 33 13 | 350.80 | 3.42 | GC |
| Terzan 5 | 17 48 05 24 46 48 | 3.84 | +1.69 | GC |
| NGC 6440 | 17 48 53 20 21 34 | 7.73 | +3.80 | GC |
| NGC 6441 | 17 50 13 37 03 04 | 353.53 | 5.01 | GC |
| 2MASS GC01 | 18 08 22 19 49 47 | 10.47 | +0.10 | GC |
| 2MASS GC02 | 18 09 36 20 26 44 | 10.07 | 0.45 | GC |
| Terzan 12 b | 18 12 16 22 44 31 | 8.36 | 2.10 | GC |
| NGC 6712 | 18 53 04 08 42 21 | 25.35 | 4.30 | GC |
| NGC 6749 | 19 05 15 +01 54 03 | 36.20 | 2.20 | GC |
| NGC 6760 | 19 11 12 +01 01 50 | 36.10 | 3.92 | GC |
| NGC 6530 | 18 04 48 24 20 00 | 6.14 | 1.38 | *C |
Hodapp (1994)
also designed as ESO522SC1
| Gum 25 cluster | W40 cluster | |
|---|---|---|
| , (J2000) | 09 02 11,48 49 14 | 18 31 25,02 05 02 |
| 269.27,1.53 | 28.80,+3.50 | |
| size | 1.4 | 1.9 |
| 9 mag | 17 mag | |
| HII region | Gum 25 a | W40 b |
| — distance c | 1.8 kpc | 600 pc |
| — d | 7 km s-1 | 0.6 km s-1 |
(a) (b) (c)


(a) (b) (c)


3.1 Determination of cluster characteristics
While the DENIS data alone do not allow to determine the definitive membership of a star to a cluster (kinematics or distances would be needed), one may estimate a probable membership from the position on the sky and estimate the contamination by field stars. From the density around the clusters, the expected contamination in both clusters is 5 and 6 field stars respectively. The cluster size is estimated visually from the image and catalogue, as well as the stellar content. We have attempted to estimate the reddening of the clusters and in the field by fitting an extinction variable along the line of sight. The Besançon model of population synthesis (Haywood et al.,, 1997) is used to reproduce the stellar content in the fields. The extinction on the pathsight is fitted in order to reproduce the stellar distribution in the (Ks,J-Ks) plane. It is done using a distribution of diffuse extinction which is produced by a double-exponential disc of interstellar material, plus discrete clouds as needed on the line of sight. The overall extinction at position () and distance writes:
where and are the extinction scale length and scale height, the extinction due to the intervening cloud in direction at distance , the galactic coordinates. The scale length and scale height are taken as 4.5 kpc and 140 pc, following the expected distribution of the dust. is the differential diffuse extinction at the solar position in magnitude per kpc. This value is often taken between 0.5 and 1. This range of value works well at high and intermediate latitudes but often failed in the plane. It so need to be adjusted on each line of sight.
The distribution of extinction described above gives a univoque relation between distance and extinction in a given field. However observations sometimes show rapid variations of extinction from one line of sight to another especially in dense clouds. This can be accounted for by assuming a dispersion of extinction for any given star (each star being on a different line of sight). Lada et al. (1994) found in the cloud IC5146 variations of extinction which can be modeled with dispersion proportional to the extinction: in a field of 1.5’ on a side. Thoraval et al. (1997) find a lower value: . In adjusting our model of extinction we have tentatively used either a constant extinction at a given distance or variations proportional to the extinction with the above formula.
3.2 Gum 25 cluster
In this field it has been easy to describe the extinction with a simple model of diffuse extinction distributed over the line of sight with no high density cloud. The (Ks,J-Ks) diagram of field stars is well reproduced with a differential diffuse extinction at the solar position = 2.5 mag kpc-1 (Fig. 2b). With this model, the extinction reaches about 10 magnitudes at 10 kpc.
Using theoretical Padova isochrones (Bertelli et al., 1994; Girardi et al., 1996), we try to estimate the reddening of the cluster. However it appears difficult to fit a well defined isochrone on the color-magnitude diagram of this cluster due to the large dispersion in colour. The age cannot be constrained either. This dispersion cannot be interpreted by field star contamination alone and must be due to a strongly varying extinction inside or in front of the cluster. We estimate the mean extinction to be =9 mag. Fig. 2c shows the cluster (Ks,J-Ks) diagram together with the isochrones at a distance of 1.8 kpc, which is the distance of the Gum 25 HII region, and with a visual extinction of 9 magnitude. This is higher than the value proposed by 2MASS on their web page, =3.6 mag, a value which we propose as a lower limit for less extincted stars in the cluster.
3.3 W40 cluster
The distribution of extinction in this field has been more difficult to estimate. The simple extinction model from the interstellar matter disc does not allow to explain why there are so few main sequence stars in this field. A high extinction cloud at 600 pc from us, which is the distance of the W40 ionized region, allows however to reproduce the number of main sequence stars if this cloud has a visual extinction of 11 magnitudes. In this case the other background stars are reddened to J-K 2. The (Ks,J-Ks) diagram of simulated stars is given in Fig. 3b. Main sequence stars are at distances less than 2 kpc, while giants appear at 4-8 kpc. At a distance of 6 kpc in the direction of W40 cluster, the stars are above the diffuse extinction disc. Thus the diffuse extinction is not sufficient to explain the large dispersion among field giants. In order to reproduce the distribution in J-Ks of the giants as well as the observed dispersion, we adopt an internal dispersion on the extinction at a given distance of . The distribution of extinction along the line of sight is defined by = 3 mag kpc-1, and 11 mag extinction due to a cloud at 600 pc. With this model, the extinction reaches about 21 magnitudes at 10 kpc.
In the cluster, the isochrone fitting of the main sequence is obtained with the cluster being at the same distance as the main cloud d = 600 pc and an extinction in the cluster = 17 mag, larger than the cloud which reddens the field. It can be interpreted as the central dense part of a larger cloud. Fig. 3c shows the main sequence fitting of the cluster with Padova isochrones of 4 Myr, 100 Myr and 1 Gyr, visual extinction of 17 mag and distance of 600 pc. It shows that the cluster is rather young.
4 Conclusion
We elaborated a program to perform an automated search of star clusters from the catalogues of extracted sources from the DENIS survey. We concentrated on the band around the Galactic plane (), where 44% of the data have already been calibrated. Most of the already known star clusters visible on the DENIS images in the probed region have been detected. Two star clusters, not published yet, have been identified. Both clusters are embedded in their associated HII regions. Extinction in front of the clusters is estimated. Uncertainties remain large on this determination mainly due to questionnable membership and to the photometric errors at faint magnitudes. Deeper and more accurate photometry and proper motions would allow to assert the cluster characteristics.
Although we have missed known star clusters and probably not yet detected clusters, our method applied to Near-Infrared data allows to search for old star clusters and embedded star clusters in a systematic way, with a lower efficiency than when looking at the image, but much more rapidly. We plan to run again this program once the complete region around the Galactic plane will be calibrated.
Acknowledgements.
The authors thank Cyril Falvo who helped in the programming, the whole DENIS staff and all the DENIS observers who collected the data. The DENIS project is supported by the SCIENCE and the Human Capital and Mobility plans of the European Commission under grants CT920791 and CT940627 in France, by l’Institut National des Sciences de l’Univers, the Ministère de l’éducation Nationale and the Centre National de la Recherche Scientifique (CNRS) in France, by the State of Baden-Würtemberg in Germany, by the DGICYT in Spain, by the Sterrewacht Leiden in Holland, by the Consiglio Nazionale delle Ricerche (CNR) in Italy, by the Fonds zur Förderung der wissenschaftlichen Forschung and Bundesministerium für Wissenschaft und Forsch ung in Austria, and by the ESO C & EE grant A-04-046.References
- Avedisova & Palous (1989) Avedisova, V. S. & Palous, J. 1989, Bulletin of the Astronomical Institutes of Czechoslovakia, 40, 42
- Battinelli (1991) Battinelli, P. 1991, A&A, 244, 69
- Bertelli et al. (1994) Bertelli, G., Bressan, A., Chiosi, C., Fagotto, F., & Nasi, E. 1994, A&AS, 106, 275
- Brand et al. (1987) Brand, J., Blitz, L., Kerr, F. J., & Wouterloot, J. G. A. 1987, A&AS, 68, 1
- Dutra & Bica (2000) Dutra, C. M. & Bica, E. 2000, A&A, 359, L9
- Dutra & Bica (2001) Dutra, C. M. & Bica, E. 2001, A&A, 376, 434
- Epchtein et al. (1997) Epchtein, N. et al. 1997, The Messenger, 87, 27
- Epchtein et al. (1999) Epchtein, N. et al. 1999, A&A, 349, 236
- Girardi et al. (1996) Girardi, L., Bressan, A., Chiosi, C., Bertelli, G., & Nasi, E. 1996, A&AS, 117, 113
- Haywood et al., (1997) Haywood, M., Robin, A. C., Crézé, M. 1997, A&A, 320, 440
- Hodapp (1994) Hodapp, K. 1994, ApJS , 94, 615
- Hurt et al. (2000) Hurt, R. L., Jarrett, T. H., Kirkpatrick, J. D., Cutri, R. M., Schneider, S. E., Skrutskie, M., & van Driel, W. 2000, AJ, 120, 1876
- Lockman (1989) Lockman, F. J. 1989, ApJS, 71, 469
- Skrutskie et al. (1997) Skrutskie, M. F. et al. 1997, ASSL Vol. 210: The Impact of Large Scale Near-IR Sky Surveys, 25
- Thoraval et al. (1997) Thoraval, S., Boissé, P., & Duvert, G. 1997, A&A, 319, 948
- Lada et al. (1994) Lada, C. J., Lada, E. A., Clemens, D. P., & Bally, J. 1994, ApJ, 429, 694
- Vauglin et al. (2001) Vauglin, I., Rousseau, J., Paturel G. et al. 2001, A&A, submitted
- Wilson (1991) Wilson, C. D. 1991, AJ, 101, 1663
- Wu et al. (1996) Wu, Y., Huang, M., & He, J. 1996, A&AS, 115, 283